Results of the United Kingdom European Union membership referendum, 2016
| United Kingdom European Union membership referendum | ||||||||||||||||||||||
|---|---|---|---|---|---|---|---|---|---|---|---|---|---|---|---|---|---|---|---|---|---|---|
| Should the United Kingdom remain a member of the European Union or leave the European Union? | ||||||||||||||||||||||
| Location |
United Kingdom Gibraltar | |||||||||||||||||||||
| Date | 23 June 2016 | |||||||||||||||||||||
| ||||||||||||||||||||||
| ||||||||||||||||||||||
| On the map, the darker shades for a colour indicate a larger margin. | ||||||||||||||||||||||
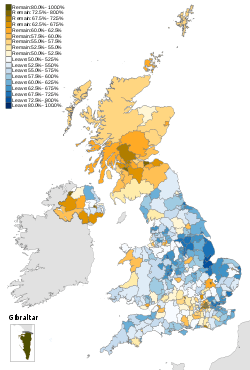
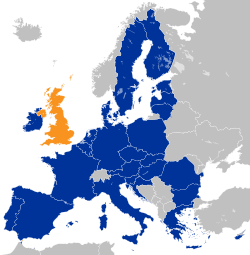
The United Kingdom European Union membership referendum, also known as the EU referendum, took place in the United Kingdom and Gibraltar on 23 June 2016.[1][2] Membership of the European Union has been a topic of debate in the United Kingdom since the country joined the European Communities (the Common Market), as it was known then, in 1973. The referendum was conducted very differently to the European Communities membership referendum in 1975 with a more localised and regionalised counting procedure and was also overseen by the Electoral Commission, a public body which did not exist at the time of the first vote. This article lists, by voting area, all the results of the referendum, each ordered into national and regional sections.
Under the provisions of the European Union Referendum Act 2015 there were a total of 382 voting areas across twelve regions using the same boundaries as used in European Parliamentary elections since 1999 under the provisions of the European Parliamentary Elections Act 2002 with votes counted at local authority level: in England the 326 local government districts were used as the voting areas; these consist of all unitary authorities, all metropolitan boroughs, all shire districts, the London boroughs, the City of London and the Isles of Scilly.[3] The nine regions of England were then also used to count the votes at the regional level with Gibraltar being regarded as part of South West England. Northern Ireland was a single voting area, as well as being a regional count, although local totals by Westminster parliamentary constituency area were announced.[3] In Scotland the 32 Scottish council areas were used as voting areas and a single national count.[3] In Wales the 22 Welsh council areas were used as the voting areas and a single national count.[3]
Counting began as soon as the polls closed on 23 June from 2200 BST onwards making it the first UK-wide referendum to be counted overnight and took nine hours and twenty minutes to complete. The result of the referendum was forecast by the BBC just before 04:40 BST (around 6 hours 40 minutes after polls closed), with around 308 results declared at the time. The first result announced was Gibraltar, and the last was Cornwall.
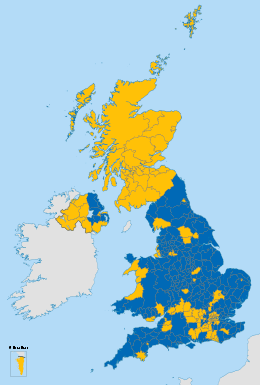
On 23 June 2016 the recorded result was that UK voters favoured leaving the European Union, by 51.9% for Leave, and 48.1% for Remain with 263 (68.85%) voting areas voting to "Leave the European Union" to 119 (31.15%) voting areas who voted to "Remain a member of the European Union". In July 2018, three reports were issued by the Electoral Commission,[4] the Information Commissioner's Office,[5] and the House of Commons Digital, Culture, Media and Sport Committee finding criminal offences of overspending by Vote Leave, data offences, and foreign interference by Russia.[6] In August 2018, this led to legal challenges to declare the referendum void for violating common law and UK constitutional law.[7]
United Kingdom
The final result of the referendum for the United Kingdom and Gibraltar was declared at Manchester Town Hall at 0720 BST on Friday 24 June 2016 after all the 382 voting areas and the twelve UK regions had declared their results by the then "chief counting officer" (CCO) for the referendum, Jenny Watson. In a UK-wide referendum, the position of "chief counting officer" (CCO) is held by the chair of the Electoral Commission.[8] The following figures are as reported by the Electoral Commission.[9]
With a national turnout of 72% the target to secure the majority win for the winning side was 16,788,672 votes. The decision by the electorate was to "Leave the European Union" which won by a majority of 1,269,501 votes (3.78%) over those who had voted in favour of "Remain a member of the European Union" with England and Wales voting to "Leave" whilst Scotland and Northern Ireland voted to "Remain".[10]
| Choice | Votes | % |
|---|---|---|
| Leave the European Union | 17,410,742 | 51.89 |
| Remain a member of the European Union | 16,141,241 | 48.11 |
| Valid votes | 33,551,983 | 99.92 |
| Invalid or blank votes | 25,359 | 0.08 |
| Total votes | 33,577,342 | 100.00 |
| Registered voters and turnout | 46,500,001 | 72.21 |
| Voting age population and turnout | 51,356,768 | 65.38 |
| Source: Electoral Commission | ||
| Leave: 17,410,742 (51.9%) |
Remain: 16,141,241 (48.1%) | ||
| ▲ | |||
Results by United Kingdom regions
| Region | Electorate | Voter turnout, of eligible |
Votes | Proportion of votes | |||
|---|---|---|---|---|---|---|---|
| Remain | Leave | Remain | Leave | ||||
| East Midlands | 3,384,299 | 74.2% | 1,033,036 | 1,475,479 | 41.18% | 58.82% | |
| East of England | 4,398,796 | 75.7% | 1,448,616 | 1,880,367 | 43.52% | 56.48% | |
| Greater London | 5,424,768 | 69.7% | 2,263,519 | 1,513,232 | 59.93% | 40.07% | |
| North East England | 1,934,341 | 69.3% | 562,595 | 778,103 | 41.96% | 58.04% | |
| North West England | 5,241,568 | 70.0% | 1,699,020 | 1,966,925 | 46.35% | 53.65% | |
| Northern Ireland | 1,260,955 | 62.7% | 440,707 | 349,442 | 55.78% | 44.22% | |
| Scotland | 3,987,112 | 67.2% | 1,661,191 | 1,018,322 | 62.00% | 38.00% | |
| South East England | 6,465,404 | 76.8% | 2,391,718 | 2,567,965 | 48.22% | 51.78% | |
| South West England (including Gibraltar) |
4,138,134 | 76.7% | 1,503,019 | 1,669,711 | 47.37% | 52.63% | |
| Wales | 2,270,272 | 71.7% | 772,347 | 854,572 | 47.47% | 52.53% | |
| West Midlands | 4,116,572 | 72.0% | 1,207,175 | 1,755,687 | 40.74% | 59.26% | |
| Yorkshire and the Humber | 3,877,780 | 70.7% | 1,158,298 | 1,580,937 | 42.29% | 57.71% | |
Results by United Kingdom constituent states
| Country | Electorate | Voter turnout, of eligible |
Votes | Proportion of votes | |||
|---|---|---|---|---|---|---|---|
| Remain | Leave | Remain | Leave | ||||
| England (including Gibraltar) |
39,005,781 | 73.0% | 13,266,996 | 15,188,406 | 46.62% | 53.38% | |
| Northern Ireland | 1,260,955 | 62.7% | 440,707 | 349,442 | 55.78% | 44.22% | |
| Scotland | 3,987,112 | 67.2% | 1,661,191 | 1,018,322 | 62.00% | 38.00% | |
| Wales | 2,270,272 | 71.7% | 772,347 | 854,572 | 47.47% | 52.53% | |
Returns from United Kingdom major cities
Out of over 33.5 million valid votes cast across the United Kingdom, over 8.8 million, or just over one quarter, were cast in thirty major cities that each gathered 100,000 votes or more.
In those 30 cities, votes to Remain outnumbered those to Leave by over 900,000 (4,872,810 to 3,955,595 or 55.2% to 44.8%), while in the other voting areas, the votes to Leave outnumbered those to Remain by nearly 2.2 million (13,455,147 to 11,268,431, or 54.4% to 45.6%).
| City | Voting region (& Remain %) [b] |
Total votes |
Turn- out |
Votes | Percent of votes [b] | |||
|---|---|---|---|---|---|---|---|---|
| Remain | Leave | Margin [c] | Remain | Leave | ||||
| Greater London | London (59.9%) | 3,776,751 | 69.7% | 2,263,519 | 1,513,232 | +750,287 | 59.9% | 40.1% |
| Birmingham | W. Midlands (40.7%) | 450,702 | 63.7% | 223,451 | 227,251 | −3,800 | 49.6% | 50.4% |
| Leeds | Yorks/Humber (42.3%) | 387,337 | 71.3% | 194,863 | 192,474 | +2,389 | 50.3% | 49.7% |
| Sheffield | Yorks/Humber (42.3%) | 266,753 | 67.3% | 130,735 | 136,018 | −5,283 | 49.0% | 51.0% |
| Glasgow | Scotland (62.0%) | 252,809 | 56.2% | 168,335 | 84,474 | +83,861 | 66.6% | 33.4% |
| Edinburgh | Scotland (62.0%) | 252,294 | 72.9% | 187,796 | 64,498 | +123,298 | 74.4% | 25.6% |
| Bradford | Yorks/Humber (42.3%) | 228,488 | 66.7% | 104,575 | 123,913 | −19,338 | 45.8% | 54.2% |
| Bristol | South West (41.2%) | 228,445 | 73.1% | 141,027 | 87,418 | +53,609 | 61.7% | 38.3% |
| Liverpool | North West (46.3%) | 203,554 | 64.0% | 118,453 | 85,101 | +33,352 | 58.2% | 41.8% |
| Manchester | North West (46.3%) | 201,814 | 59.7% | 121,823 | 79,991 | +41,832 | 60.4% | 39.6% |
| Wakefield | Yorks/Humber (42.3%) | 175,042 | 71.1% | 58,877 | 116,165 | −57,288 | 33.6% | 66.4% |
| Cardiff | Wales (47.5%) | 169,604 | 69.6% | 101,788 | 67,816 | +33,972 | 60.0% | 40.0% |
| greater Belfast [lower-alpha 1] | N. Ireland (55.8%) | 158,365 | — | 94,915 | 63,450 | +31,465 | 59.9% | 40.1% |
| Coventry | W. Midlands (40.7%) | 153,064 | 69.2% | 67,967 | 85,097 | −17,130 | 44.4% | 55.6% |
| Brighton & Hove | South East (48.2%) | 146,675 | 74.0% | 100,648 | 46,027 | +54,621 | 68.6% | 31.4% |
| Leicester | E. Midlands (41.2%) | 138,972 | 65.0% | 70,980 | 67,992 | +2,988 | 51.1% | 48.9% |
| Sunderland | North East (42.0%) | 134,324 | 64.8% | 51,930 | 82,394 | −30,464 | 38.7% | 61.3% |
| Plymouth | South West (41.2%) | 133,455 | 71.4% | 53,458 | 79,997 | −26,539 | 40.1% | 59.9% |
| Newcastle upon Tyne | North East (42.0%) | 129,003 | 67.6% | 65,405 | 63,598 | +1,807 | 50.7% | 49.3% |
| Nottingham | E. Midlands (41.2%) | 120,661 | 61.8% | 59,318 | 61,343 | −2,025 | 49.2% | 50.8% |
| Derby | E. Midlands (41.2%) | 120,655 | 70.5% | 51,612 | 69,043 | −17,431 | 42.8% | 57.2% |
| Swansea | Wales (47.5%) | 120,243 | 69.5% | 58,307 | 61,936 | −3,629 | 48.5% | 51.5% |
| Wolverhampton | W. Midlands (40.7%) | 117,936 | 67.5% | 44,138 | 73,798 | −29,660 | 37.4% | 62.6% |
| Stoke-on-Trent | W. Midlands (40.7%) | 117,590 | 65.7% | 36,027 | 81,563 | −45,536 | 30.6% | 69.4% |
| Kingston upon Hull | Yorks/Humber (42.3%) | 113,355 | 62.9% | 36,709 | 76,646 | −39,937 | 32.4% | 67.6% |
| Salford | North West (46.3%) | 109,815 | 63.2% | 47,430 | 62,385 | −14,955 | 43.2% | 56.8% |
| York | Yorks/Humber (42.3%) | 109,600 | 70.6% | 63,617 | 45,983 | +17,634 | 58.0% | 42.0% |
| Southampton | South East (48.2%) | 107,665 | 68.1% | 49,738 | 57,927 | −8,189 | 46.2% | 53.8% |
| Aberdeen | Scotland (62.0%) | 104,714 | 67.9% | 63,985 | 40,729 | +23,256 | 61.1% | 38.9% |
| Portsmouth | South East (48.2%) | 98,720 | 70.3% | 41,384 | 57,336 | −15,952 | 41.9% | 58.1% |
| Total of 30 cities | U.K. (48.1%) | 8,828,405 | — | 4,872,810 | 3,955,595 | +917,215 | 55.2% | 44.8% |
| Other voting areas | U.K. (48.1%) | 24,723,578 | — | 11,268,431 | 13,455,147 | −2,186,716 | 45.6% | 54.4% |
| United Kingdom | U.K. | 33,551,983 | 72.2% | 16,141,241 | 17,410,742 | −1,269,501 | 48.1% | 51.9% |
| Notes: [a] Vote totals for Belfast are based on the returns from the four parliamentary constituencies in Belfast. These include areas in districts outside the City of Belfast. [b] Lighter shades indicate a prevailing Remain or Leave vote of 52.0% or less; darker shades one of 58.0% or more. [c] Margins are (arbitrarily) positive (+) when they indicate the excess of Remain votes over Leave, and negative (−) when they indicate the excess of Leave votes over Remain. | ||||||||
England
The English local districts were used as the voting areas for the referendum in England; these consist of all unitary authorities, all metropolitan boroughs, all shire districts, the London boroughs, the City of London and the Isles of Scilly.[3]
Unlike the other constituent countries of the United Kingdom there was no centralised national count of the votes in England as counting was done within the nine separate regions. It should also be noted that figures from Gibraltar are also included.
United Kingdom European Union membership referendum, 2016 England (including Gibraltar) | |||
| Choice | Votes | % | |
|---|---|---|---|
| Leave the European Union | 15,188,406 | 53.38% | |
| Remain a member of the European Union | 13,266,996 | 46.62% | |
| Valid votes | 28,455,482 | 99.92% | |
| Invalid or blank votes | 22,184 | 0.08% | |
| Total votes | 28,477,666 | 100.00% | |
| Registered voters and turnout | 39,005,781 | 73.01% | |
| Leave: 15,188,406 (53.4%) |
Remain: 13,266,996 (46.6%) | ||
| ▲ | |||
England was broken down into 9 regional count areas using the same regional constituency boundaries as used in European Parliamentary elections.
East Midlands
.svg.png)
United Kingdom European Union membership referendum, 2016 East Midlands | |||
| Choice | Votes | % | |
|---|---|---|---|
| Leave the European Union | 1,475,479 | 58.82% | |
| Remain a member of the European Union | 1,033,036 | 41.18% | |
| Valid votes | 2,508,515 | 99.92% | |
| Invalid or blank votes | 1,891 | 0.08% | |
| Total votes | 2,510,496 | 100.00% | |
| Registered voters and turnout | 3,384,299 | 74.18% | |
| Source: Electoral Commission | |||
| Leave: 1,475,479 (58.9%) |
Remain: 1,033,036 (41.1%) | ||
| ▲ | |||
The East Midlands region was broken down into 40 voting areas.
| District | Voter turnout, of eligible |
Votes | Proportion of votes | ||
|---|---|---|---|---|---|
| Remain | Leave | Remain | Leave | ||
| Amber Valley | 76.3% | 29,319 | 44,501 | 39.7% | 60.3% |
| Ashfield | 72.8% | 20,179 | 46,720 | 30.2% | 69.8% |
| Bassetlaw | 74.8% | 20,575 | 43,392 | 32.2% | 67.8% |
| Blaby | 76.5% | 22,888 | 33,583 | 40.5% | 59.5% |
| Bolsover | 72.3% | 12,242 | 29,730 | 29.2% | 70.8% |
| Boston | 77.2% | 7,430 | 22,974 | 24.4% | 75.6% |
| Broxtowe | 78.3% | 29,672 | 35,754 | 45.4% | 54.6% |
| Charnwood | 70.4% | 43,500 | 50,672 | 46.2% | 53.8% |
| Chesterfield | 71.9% | 22,946 | 34,478 | 40.0% | 60.0% |
| Corby | 74.1% | 11,470 | 20,611 | 35.8% | 64.2% |
| Daventry | 80.9% | 20,443 | 28,938 | 41.4% | 58.6% |
| Derby | 70.5% | 51,612 | 69,043 | 42.8% | 57.2% |
| Derbyshire Dales | 81.9% | 22,633 | 24,095 | 48.4% | 51.6% |
| East Lindsey | 74.9% | 23,515 | 56,613 | 29.3% | 70.7% |
| East Northamptonshire | 76.9% | 21,680 | 30,894 | 41.2% | 58.8% |
| Erewash | 76.0% | 25,791 | 40,739 | 38.8% | 61.2% |
| Gedling | 76.5% | 30,035 | 37,542 | 44.4% | 55.6% |
| High Peak | 75.6% | 27,116 | 27,717 | 49.5% | 50.5% |
| Harborough | 81.4% | 27,028 | 27,850 | 49.3% | 50.7% |
| Hinckley & Bosworth | 76.7% | 25,969 | 39,501 | 39.7% | 60.3% |
| Kettering | 76.4% | 21,030 | 32,877 | 39.0% | 61.0% |
| Leicester | 65.0% | 70,980 | 67,992 | 51.1% | 48.9% |
| Lincoln | 69.3% | 18,902 | 24,992 | 43.1% | 56.9% |
| Mansfield | 72.6% | 16,417 | 39,927 | 29.1% | 70.9% |
| Melton | 81.3% | 12,695 | 17,610 | 41.9% | 58.1% |
| Newark and Sherwood | 76.8% | 26,571 | 40,516 | 39.6% | 60.4% |
| North East Derbyshire | 75.2% | 22,075 | 37,235 | 37.2% | 62.8% |
| Northampton | 72.6% | 43,805 | 61,454 | 41.6% | 58.4% |
| North Kesteven | 78.4% | 25,570 | 42,183 | 37.7% | 62.3% |
| North West Leicestershire | 77.9% | 22,642 | 34,969 | 39.3% | 60.7% |
| Nottingham | 61.8% | 59,318 | 61,343 | 49.2% | 50.8% |
| Oadby and Wigston | 73.7% | 14,292 | 17,173 | 45.4% | 54.6% |
| Rushcliffe | 81.5% | 40,522 | 29,888 | 57.6% | 42.4% |
| Rutland | 78.1% | 11,353 | 11,613 | 49.4% | 50.6% |
| South Derbyshire | 76.8% | 22,479 | 34,216 | 39.6% | 60.4% |
| South Holland | 75.3% | 13,074 | 36,423 | 26.4% | 73.6% |
| South Kesteven | 78.2% | 33,047 | 49,424 | 40.1% | 59.9% |
| South Northamptonshire | 79.4% | 25,853 | 30,771 | 45.7% | 54.3% |
| Wellingborough | 75.4% | 15,462 | 25,679 | 37.6% | 62.4% |
| West Lindsey | 74.5% | 20,906 | 33,847 | 38.2% | 61.8% |
East of England
.svg.png)
United Kingdom European Union membership referendum, 2016 East of England | |||
| Choice | Votes | % | |
|---|---|---|---|
| Leave the European Union | 1,880,367 | 56.48% | |
| Remain a member of the European Union | 1,448,616 | 43.52% | |
| Valid votes | 3,328,983 | 99.93% | |
| Invalid or blank votes | 2,329 | 0.07% | |
| Total votes | 3,331,312 | 100.00% | |
| Registered voters and turnout | 4,398,796 | 75.73% | |
| Source: Electoral Commission | |||
| Leave: 1,880,367 (56.5%) |
Remain: 1,448,616 (43.5%) | ||
| ▲ | |||
The East of England region was broken down into 47 voting areas.
| District | Voter turnout, of eligible |
Votes | Proportion of votes | ||
|---|---|---|---|---|---|
| Remain | Leave | Remain | Leave | ||
| Babergh | 78.2% | 25,309 | 29,933 | 45.8% | 54.2% |
| Basildon | 73.8% | 30,748 | 67,251 | 31.4% | 68.6% |
| Bedford | 72.1% | 41,497 | 44,569 | 48.2% | 51.8% |
| Braintree | 76.6% | 33,523 | 52,713 | 38.9% | 61.1% |
| Breckland | 74.3% | 26,313 | 47,235 | 35.8% | 64.2% |
| Brentwood | 79.5% | 19,077 | 27,627 | 40.8% | 59.2% |
| Broadland | 78.3% | 35,469 | 42,268 | 45.6% | 54.4% |
| Broxbourne | 73.7% | 17,166 | 33,706 | 33.7% | 66.3% |
| Cambridge | 72.2% | 42,682 | 15,117 | 73.8% | 26.2% |
| Castle Point | 75.3% | 14,154 | 37,691 | 27.3% | 72.7% |
| Central Bedfordshire | 77.8% | 69,670 | 89,134 | 43.9% | 56.1% |
| Chelmsford | 77.6% | 47,545 | 53,249 | 47.2% | 52.8% |
| Colchester | 75.1% | 44,414 | 51,305 | 46.4% | 53.6% |
| Dacorum | 79.1% | 42,542 | 43,702 | 49.3% | 50.7% |
| East Cambridgeshire | 77.0% | 23,599 | 24,487 | 49.1% | 50.9% |
| East Hertfordshire | 80.3% | 42,372 | 42,994 | 49.6% | 50.4% |
| Epping Forest | 76.8% | 28,676 | 48,176 | 37.3% | 62.7% |
| Fenland | 73.7% | 15,055 | 37,571 | 28.6% | 71.4% |
| Forest Heath | 72.5% | 9,791 | 18,160 | 35.0% | 65.0% |
| Great Yarmouth | 69.0% | 14,284 | 35,844 | 28.5% | 71.5% |
| Harlow | 73.5% | 13,867 | 29,602 | 31.9% | 68.1% |
| Hertsmere | 76.6% | 27,593 | 28,532 | 49.2% | 50.8% |
| Huntingdonshire | 77.8% | 45,729 | 54,198 | 45.8% | 54.2% |
| Ipswich | 72.5% | 27,698 | 38,655 | 41.7% | 58.3% |
| King's Lynn and West Norfolk | 74.7% | 28,587 | 56,493 | 33.6% | 66.4% |
| Luton | 66.2% | 36,708 | 47,773 | 43.5% | 56.5% |
| Maldon | 79.1% | 14,529 | 24,302 | 37.4% | 62.6% |
| Mid Suffolk | 78.1% | 27,391 | 33,794 | 44.8% | 55.2% |
| North Hertfordshire | 78.2% | 42,234 | 35,438 | 54.4% | 45.6% |
| North Norfolk | 76.8% | 26,214 | 37,576 | 41.1% | 58.9% |
| Norwich | 69.1% | 37,326 | 29,040 | 56.2% | 43.8% |
| Peterborough | 72.3% | 34,176 | 53,216 | 39.1% | 60.9% |
| Rochford | 78.8% | 17,510 | 34,937 | 33.4% | 66.6% |
| South Cambridgeshire | 81.2% | 56,128 | 37,061 | 60.2% | 39.8% |
| Southend-on-Sea | 72.8% | 39,348 | 54,522 | 41.9% | 58.1% |
| South Norfolk | 78.5% | 38,817 | 41,541 | 48.3% | 51.7% |
| St Albans | 82.4% | 54,208 | 32,237 | 62.7% | 37.3% |
| St. Edmundsbury | 76.7% | 26,986 | 35,224 | 43.4% | 56.6% |
| Stevenage | 73.7% | 18,659 | 27,126 | 40.8% | 59.2% |
| Suffolk Coastal | 80.6% | 37,218 | 41,966 | 47.0% | 53.0% |
| Tendring | 74.4% | 25,210 | 57,447 | 30.5% | 69.5% |
| Three Rivers | 78.4% | 25,751 | 27,097 | 48.7% | 51.3% |
| Thurrock | 72.7% | 22,151 | 57,765 | 27.7% | 72.3% |
| Uttlesford | 80.2% | 25,619 | 26,324 | 49.3% | 50.7% |
| Watford | 71.6% | 23,167 | 23,419 | 49.7% | 50.3% |
| Waveney | 72.6% | 24,356 | 41,290 | 37.1% | 62.9% |
| Welwyn Hatfield | 75.0% | 27,550 | 31,060 | 47.0% | 53.0% |
Greater London
.svg.png)
United Kingdom European Union membership referendum, 2016 Greater London | |||
| Choice | Votes | % | |
|---|---|---|---|
| Remain a member of the European Union | 2,263,519 | 59.93% | |
| Leave the European Union | 1,513,232 | 40.07% | |
| Valid votes | 3,776,751 | 99.88% | |
| Invalid or blank votes | 4,453 | 0.12% | |
| Total votes | 3,781,204 | 100.00% | |
| Registered voters and turnout | 5,424,768 | 69.70% | |
| Source: Electoral Commission | |||
| Leave: 1,513,232 (40.1%) |
Remain: 2,263,519 (59.9%) | ||
| ▲ | |||
The Greater London region was broken down into 33 voting areas.
| District | Voter turnout, of eligible |
Votes | Proportion of votes | ||
|---|---|---|---|---|---|
| Remain | Leave | Remain | Leave | ||
| Barking and Dagenham | 63.8% | 27,750 | 46,130 | 37.6% | 62.4% |
| Barnet | 72.1% | 100,210 | 60,823 | 62.2% | 37.8% |
| Bexley | 75.2% | 47,603 | 80,886 | 37.0% | 63.0% |
| Brent | 65.0% | 72,523 | 48,881 | 59.7% | 40.3% |
| Bromley | 78.8% | 92,398 | 90,034 | 50.6% | 49.4% |
| Camden | 65.4% | 71,295 | 23,838 | 74.9% | 25.1% |
| City of London | 73.5% | 3,312 | 1,087 | 75.3% | 24.7% |
| City of Westminster | 64.9% | 53,928 | 24,268 | 69.0% | 31.0% |
| Croydon | 69.8% | 92,913 | 78,221 | 54.3% | 45.7% |
| Ealing | 70.0% | 90,024 | 59,017 | 60.4% | 39.6% |
| Enfield | 69.0% | 76,425 | 60,481 | 55.8% | 44.2% |
| Greenwich | 69.5% | 65,248 | 52,117 | 55.6% | 44.4% |
| Hackney | 65.1% | 83,398 | 22,868 | 78.5% | 21.5% |
| Haringey | 70.5% | 79,991 | 25,855 | 75.6% | 24.4% |
| Harrow | 72.2% | 64,042 | 53,183 | 54.6% | 45.4% |
| Hammersmith and Fulham | 69.9% | 56,188 | 24,054 | 70.0% | 30.0% |
| Havering | 76.0% | 42,201 | 96,885 | 30.3% | 69.7% |
| Hillingdon | 68.9% | 58,040 | 74,982 | 43.6% | 56.4% |
| Hounslow | 69.7% | 58,755 | 56,321 | 51.1% | 48.9% |
| Islington | 70.3% | 76,420 | 25,180 | 75.2% | 24.8% |
| Kensington and Chelsea | 65.9% | 37,601 | 17,138 | 68.7% | 31.3% |
| Kingston upon Thames | 78.3% | 52,533 | 32,737 | 61.6% | 38.4% |
| Lambeth | 67.3% | 111,584 | 30,340 | 78.6% | 21.4% |
| Lewisham | 63.0% | 86,955 | 37,518 | 69.9% | 30.1% |
| Merton | 73.4% | 63,003 | 37,097 | 62.9% | 37.1% |
| Newham | 59.2% | 55,328 | 49,371 | 52.8% | 47.2% |
| Redbridge | 67.5% | 69,213 | 59,020 | 54.0% | 46.0% |
| Richmond upon Thames | 82.0% | 75,396 | 33,410 | 69.3% | 30.7% |
| Southwark | 66.1% | 94,293 | 35,209 | 72.8% | 27.2% |
| Sutton | 76.0% | 49,319 | 57,241 | 46.3% | 53.7% |
| Tower Hamlets | 64.5% | 73,011 | 35,224 | 67.5% | 32.5% |
| Waltham Forest | 66.6% | 64,156 | 44,395 | 59.1% | 40.9% |
| Wandsworth | 71.9% | 118,463 | 39,421 | 75.0% | 25.0% |
North East England
.svg.png)
United Kingdom European Union membership referendum, 2016 North East England | |||
| Choice | Votes | % | |
|---|---|---|---|
| Leave the European Union | 778,103 | 58.04% | |
| Remain a member of the European Union | 562,595 | 41.96% | |
| Valid votes | 1,340,698 | 99.95% | |
| Invalid or blank votes | 689 | 0.05% | |
| Total votes | 1,341,387 | 100.00% | |
| Registered voters and turnout | 1,934,341 | 69.35% | |
| Source: Electoral Commission | |||
| Leave: 778,103 (58%) |
Remain: 562,595 (42%) | ||
| ▲ | |||
The North East England region was broken down into 12 voting areas.
| District | Voter turnout, of eligible |
Votes | Proportion of votes | ||
|---|---|---|---|---|---|
| Remain | Leave | Remain | Leave | ||
| Darlington | 71.0% | 24,172 | 30,994 | 43.8% | 56.2% |
| County Durham | 68.7% | 113,521 | 153,877 | 42.5% | 57.5% |
| Gateshead | 70.6% | 44,429 | 58,529 | 43.2% | 57.8% |
| Hartlepool | 65.5% | 14,029 | 32,071 | 30.4% | 69.6% |
| Middlesbrough | 64.9% | 21,181 | 40,177 | 34.5% | 65.5% |
| Newcastle upon Tyne | 67.6% | 65,405 | 63,598 | 50.7% | 49.3% |
| North Tyneside | 72.3% | 52,873 | 60,589 | 46.6% | 53.4% |
| Northumberland | 74.3% | 82,022 | 96,699 | 45.9% | 54.1% |
| Redcar and Cleveland | 70.2% | 24,586 | 48,128 | 33.8% | 66.2% |
| South Tyneside | 68.2% | 30,014 | 49,065 | 38.0% | 62.0% |
| Stockton-on-Tees | 71.0% | 38,433 | 61,982 | 38.3% | 61.7% |
| Sunderland | 64.8% | 51,930 | 82,394 | 38.7% | 61.3% |
North West England
.svg.png)
United Kingdom European Union membership referendum, 2016 North West England | |||
| Choice | Votes | % | |
|---|---|---|---|
| Leave the European Union | 1,966,925 | 53.65% | |
| Remain a member of the European Union | 1,699,020 | 46.35% | |
| Valid votes | 3,665,945 | 99.93% | |
| Invalid or blank votes | 2,682 | 0.07% | |
| Total votes | 3,668,627 | 100.00% | |
| Registered voters and turnout | 5,241,568 | 69.99% | |
| Source: Electoral Commission | |||
| Leave: 1,966,925 (53.7%) |
Remain: 1,699,020 (46.3%) | ||
| ▲ | |||
The North West England region was broken down into 39 voting areas.
| District | Voter turnout, of eligible |
Votes | Proportion of votes | ||
|---|---|---|---|---|---|
| Remain | Leave | Remain | Leave | ||
| Allerdale | 72.9% | 22,429 | 31,809 | 41.4% | 58.6% |
| Barrow-in-Furness | 67.8% | 14,207 | 21,867 | 39.4% | 60.6% |
| Blackburn with Darwen | 65.2% | 28,522 | 36,799 | 43.7% | 56.3% |
| Blackpool | 65.4% | 21,781 | 45,146 | 32.5% | 67.5% |
| Bolton | 70.1% | 57,589 | 80,491 | 41.7% | 58.3% |
| Burnley | 67.2% | 14,462 | 28,854 | 33.4% | 66.6% |
| Bury | 71.3% | 46,354 | 54,674 | 45.9% | 54.1% |
| Carlisle | 74.5% | 23,788 | 35,895 | 39.9% | 60.1% |
| Cheshire East | 77.3% | 107,962 | 113,163 | 48.8% | 51.2% |
| Cheshire West and Chester | 74.5% | 95,455 | 98,082 | 49.3% | 50.7% |
| Chorley | 75.5% | 27,417 | 36,098 | 43.2% | 56.8% |
| Copeland | 70.0% | 14,419 | 23,528 | 38.0% | 62.0% |
| Eden | 75.7% | 14,807 | 16,911 | 46.7% | 53.3% |
| Fylde | 75.5% | 19,889 | 26,317 | 43.0% | 57.0% |
| Halton | 68.2% | 27,678 | 37,327 | 42.6% | 57.4% |
| Hyndburn | 64.7% | 13,569 | 26,568 | 33.8% | 66.2% |
| Knowsley | 63.5% | 34,345 | 36,558 | 48.4% | 51.6% |
| Lancaster | 72.6% | 35,732 | 37,309 | 48.9% | 51.1% |
| Liverpool | 64.0% | 118,453 | 85,101 | 58.2% | 41.8% |
| Manchester | 59.7% | 121,823 | 79,991 | 60.4% | 39.6% |
| Oldham | 67.9% | 42,034 | 65,369 | 39.1% | 60.9% |
| Pendle | 70.2% | 16,704 | 28,631 | 36.8% | 63.2% |
| Preston | 68.7% | 30,227 | 34,518 | 46.7% | 53.3% |
| Ribble Valley | 79.0% | 15,892 | 20,550 | 43.6% | 56.4% |
| Rochdale | 65.9% | 41,217 | 62,014 | 39.9% | 60.1% |
| Rossendale | 72.4% | 15,012 | 23,169 | 39.3% | 60.7% |
| Salford | 63.2% | 47,430 | 62,385 | 43.2% | 56.8% |
| Sefton | 71.7% | 76,702 | 71,176 | 51.9% | 48.1% |
| South Lakeland | 79.7% | 34,531 | 30,800 | 52.9% | 47.1% |
| South Ribble | 75.3% | 26,406 | 37,318 | 41.4% | 58.6% |
| St. Helens | 68.8% | 39,322 | 54,357 | 42.0% | 58.0% |
| Stockport | 74.9% | 85,559 | 77,930 | 52.5% | 47.5% |
| Tameside | 66.0% | 43,118 | 67,829 | 38.9% | 61.1% |
| Trafford | 75.8% | 72,293 | 53,018 | 57.7% | 42.3% |
| Warrington | 73.3% | 52,657 | 62,487 | 45.7% | 54.3% |
| West Lancashire | 74.4% | 28,546 | 35,323 | 44.7% | 55.3% |
| Wigan | 69.2% | 58,942 | 104,331 | 36.1% | 63.9% |
| Wirral | 70.9% | 88,931 | 83,069 | 51.7% | 48.3% |
| Wyre | 74.6% | 22,816 | 40,163 | 36.2% | 63.8% |
South East England
.svg.png)
United Kingdom European Union membership referendum, 2016 South East England | |||
| Choice | Votes | % | |
|---|---|---|---|
| Leave the European Union | 2,567,965 | 51.78% | |
| Remain a member of the European Union | 2,391,718 | 48.22% | |
| Valid votes | 4,959,683 | 99.93% | |
| Invalid or blank votes | 3,427 | 0.07% | |
| Total votes | 4,963,110 | 100.00% | |
| Registered voters and turnout | 6,465,404 | 76.76% | |
| Source: Electoral Commission | |||
| Leave: 2,567,965 (51.8%) |
Remain: 2,391,718 (48.2%) | ||
| ▲ | |||
The South East England region was broken down into 67 voting areas.
| District | Voter turnout, of eligible |
Votes | Proportion of votes | ||
|---|---|---|---|---|---|
| Remain | Leave | Remain | Leave | ||
| Adur | 76.4% | 16,914 | 20,315 | 45.4% | 54.6% |
| Arun | 77.8% | 34,193 | 56,936 | 37.5% | 62.5% |
| Ashford | 77.1% | 28,314 | 41,472 | 40.6% | 59.4% |
| Aylesbury Vale | 78.4% | 52,877 | 53,956 | 49.5% | 50.5% |
| Basingstoke and Deane | 78.0% | 48,257 | 52,071 | 48.1% | 51.9% |
| Bracknell Forest | 76.1% | 29,888 | 35,002 | 46.1% | 53.9% |
| Brighton & Hove | 74.0% | 100,648 | 46,027 | 68.6% | 31.4% |
| Canterbury | 75.0% | 40,169 | 41,879 | 49.0% | 51.0% |
| Cherwell | 75.5% | 40,668 | 41,168 | 49.7% | 50.3% |
| Chichester | 77.8% | 35,011 | 36,326 | 49.1% | 50.9% |
| Chiltern | 83.5% | 32,241 | 26,363 | 55.0% | 45.0% |
| Crawley | 73.2% | 22,388 | 31,447 | 41.6% | 58.4% |
| Dartford | 75.5% | 19,985 | 35,870 | 35.8% | 64.2% |
| Dover | 76.5% | 24,606 | 40,410 | 37.8% | 62.2% |
| Eastbourne | 74.7% | 22,845 | 30,700 | 42.7% | 57.3% |
| Eastleigh | 78.2% | 36,172 | 39,902 | 47.5% | 52.5% |
| East Hampshire | 81.6% | 37,346 | 36,576 | 50.5% | 49.5% |
| Elmbridge | 78.1% | 45,841 | 31,162 | 59.5% | 40.5% |
| Epsom and Ewell | 80.4% | 23,596 | 21,707 | 52.1% | 47.9% |
| Fareham | 79.6% | 32,210 | 39,525 | 44.9% | 55.1% |
| Gosport | 73.5% | 16,671 | 29,456 | 36.1% | 63.9% |
| Gravesham | 74.9% | 18,876 | 35,643 | 34.6% | 65.4% |
| Guildford | 76.9% | 44,155 | 34,458 | 56.2% | 43.8% |
| Hart | 82.6% | 30,282 | 27,513 | 52.4% | 47.6% |
| Hastings | 71.6% | 20,011 | 24,339 | 45.1% | 54.9% |
| Havant | 74.1% | 26,582 | 44,047 | 37.6% | 62.4% |
| Horsham | 81.6% | 43,785 | 41,303 | 51.5% | 48.5% |
| Isle of Wight | 72.3% | 30,207 | 49,173 | 38.1% | 61.9% |
| Lewes | 77.8% | 30,974 | 28,508 | 52.1% | 47.9% |
| Maidstone | 76.0% | 36,762 | 52,365 | 41.2% | 58.8% |
| Medway | 72.1% | 49,889 | 88,997 | 35.9% | 64.1% |
| Mid Sussex | 80.7% | 46,471 | 41,057 | 53.1% | 46.9% |
| Milton Keynes | 73.6% | 63,393 | 67,063 | 48.6% | 51.4% |
| Mole Valley | 82.1% | 29,088 | 25,708 | 53.1% | 46.9% |
| New Forest | 79.2% | 47,199 | 64,541 | 42.2% | 57.8% |
| Oxford | 72.3% | 49,424 | 20,913 | 70.3% | 29.7% |
| Portsmouth | 70.3% | 41,384 | 57,336 | 41.9% | 58.1% |
| Reading | 72.5% | 43,385 | 31,382 | 58.0% | 42.0% |
| Reigate and Banstead | 78.2% | 40,181 | 40,980 | 49.5% | 50.5% |
| Rother | 79.3% | 23,916 | 33,753 | 41.5% | 58.5% |
| Runnymede | 76.0% | 20,259 | 24,035 | 45.7% | 54.3% |
| Rushmoor | 74.1% | 20,384 | 28,396 | 41.8% | 58.2% |
| Sevenoaks | 80.6% | 32,091 | 38,258 | 45.6% | 54.4% |
| Shepway | 74.9% | 22,884 | 37,729 | 37.8% | 62.2% |
| Slough | 62.1% | 24,911 | 29,631 | 45.7% | 54.3% |
| Southampton | 68.1% | 49,738 | 57,927 | 46.2% | 53.8% |
| South Bucks | 78.0% | 20,077 | 20,647 | 49.3% | 50.7% |
| South Oxfordshire | 80.7% | 46,245 | 37,865 | 55.0% | 45.0% |
| Spelthorne | 77.9% | 22,474 | 34,135 | 39.7% | 60.3% |
| Surrey Heath | 79.8% | 25,638 | 26,667 | 49.0% | 51.0% |
| Swale | 74.2% | 28,481 | 47,388 | 37.5% | 62.5% |
| Tandridge | 80.3% | 24,251 | 27,169 | 47.2% | 52.8% |
| Test Valley | 79.6% | 36,170 | 39,091 | 48.1% | 51.9% |
| Thanet | 72.7% | 26,065 | 46,037 | 36.2% | 63.8% |
| Tonbridge and Malling | 79.6% | 32,792 | 41,229 | 44.3% | 55.7% |
| Tunbridge Wells | 79.1% | 35,676 | 29,320 | 54.9% | 45.1% |
| Vale of White Horse | 81.1% | 43,462 | 33,192 | 56.7% | 43.3% |
| Waverley | 82.3% | 44,341 | 31,601 | 58.4% | 41.6% |
| Wealden | 80.0% | 44,084 | 52,808 | 45.5% | 54.5% |
| West Berkshire | 79.9% | 48,300 | 44,977 | 51.8% | 48.2% |
| West Oxfordshire | 79.7% | 35,236 | 30,435 | 53.7% | 46.3% |
| Winchester | 81.2% | 42,878 | 29,886 | 58.9% | 41.1% |
| Windsor and Maidenhead | 79.7% | 44,086 | 37,706 | 53.9% | 46.1% |
| Woking | 77.4% | 31,007 | 24,214 | 56.2% | 43.8% |
| Wokingham | 79.2% | 55,272 | 42,229 | 56.7% | 43.3% |
| Worthing | 75.4% | 28,851 | 32,515 | 47.0% | 53.0% |
| Wycombe | 75.7% | 49,261 | 45,529 | 52.0% | 48.0% |
South West England (including Gibraltar)
.svg.png)
United Kingdom European Union membership referendum, 2016 South West England (including Gibraltar) | |||
| Choice | Votes | % | |
|---|---|---|---|
| Leave the European Union | 1,669,711 | 52.62% | |
| Remain a member of the European Union | 1,503,019 | 47.37% | |
| Valid votes | 3,172,730 | 99.93% | |
| Invalid or blank votes | 2,179 | 0.07% | |
| Total votes | 3,174,909 | 100.00% | |
| Registered voters and turnout | 4,138,134 | 73.01% | |
| Source: Electoral Commission | |||
| Leave: 1,669,711 (52.6%) |
Remain: 1,503,019 (47.4%) | ||
| ▲ | |||
The South West England region was broken down into 38 voting areas.
| District | Voter turnout, of eligible |
Votes | Proportion of votes | ||
|---|---|---|---|---|---|
| Remain | Leave | Remain | Leave | ||
| Bath and North East Somerset | 77.1% | 60,878 | 44,352 | 57.9% | 42.1% |
| Bournemouth | 69.2% | 41,473 | 50,453 | 45.1% | 54.9% |
| Bristol | 73.1% | 141,027 | 87,418 | 61.7% | 38.3% |
| Cheltenham | 75.8% | 37,081 | 28,932 | 56.2% | 43.8% |
| Christchurch | 79.3% | 12,782 | 18,268 | 41.2% | 58.8% |
| Cornwall | 77.0% | 140,540 | 182,665 | 43.5% | 56.5% |
| Cotswold | 79.8% | 28,015 | 26,806 | 51.1% | 48.9% |
| East Devon | 78.9% | 40,743 | 48,040 | 45.9% | 54.1% |
| East Dorset | 81.3% | 24,786 | 33,702 | 42.4% | 57.6% |
| Exeter | 73.8% | 35,270 | 28,533 | 55.3% | 44.7% |
| Forest of Dean | 77.4% | 21,392 | 30,251 | 41.4% | 58.6% |
| Gloucester | 72.0% | 26,801 | 37,776 | 41.5% | 58.5% |
| Isles of Scilly | 79.2% | 803 | 621 | 56.4% | 43.6% |
| Mendip | 76.9% | 33,427 | 32,028 | 51.1% | 48.9% |
| Mid Devon | 79.3% | 22,400 | 25,606 | 46.7% | 53.3% |
| North Dorset | 79.7% | 18,399 | 23,802 | 43.6% | 56.4% |
| North Devon | 76.8% | 24,931 | 33,100 | 43.0% | 57.0% |
| North Somerset | 77.4% | 59,572 | 64,976 | 47.8% | 52.2% |
| Plymouth | 71.4% | 53,458 | 79,997 | 40.1% | 59.9% |
| Poole | 75.3% | 35,741 | 49,707 | 41.8% | 58.2% |
| Purbeck | 78.9% | 11,754 | 16,966 | 40.9% | 59.1% |
| Sedgemoor | 76.3% | 26,545 | 41,869 | 38.8% | 61.2% |
| South Gloucestershire | 76.2% | 74,928 | 83,405 | 47.3% | 52.7% |
| South Hams | 80.2% | 29,308 | 26,142 | 52.9% | 47.1% |
| South Somerset | 78.6% | 42,527 | 56,940 | 42.8% | 57.2% |
| Stroud | 80.0% | 40,446 | 33,618 | 54.6% | 45.4% |
| Swindon | 75.8% | 51,220 | 61,745 | 45.3% | 54.7% |
| Taunton Deane | 78.1% | 30,944 | 34,789 | 47.1% | 52.9% |
| Teignbridge | 79.3% | 37,949 | 44,363 | 46.1% | 53.9% |
| Tewkesbury | 79.1% | 25,084 | 28,568 | 46.8% | 53.2% |
| Torbay | 73.6% | 27,935 | 47,889 | 36.8% | 63.2% |
| Torridge | 78.3% | 16,229 | 25,200 | 39.2% | 60.8% |
| West Dorset | 79.4% | 31,924 | 33,267 | 49.0% | 51.0% |
| West Devon | 81.2% | 16,658 | 18,937 | 46.8% | 53.2% |
| West Somerset | 79.1% | 8,566 | 13,168 | 39.4% | 60.6% |
| Wiltshire | 78.8% | 137,258 | 151,637 | 47.5% | 52.5% |
| Weymouth and Portland | 75.8% | 14,903 | 23,352 | 39.0% | 61.0% |
Gibraltar
For the purposes of this referendum and as has been the case with European Parliamentary elections, the overseas territory of Gibraltar was a single voting area placed in the South West England constituency. It is the first time the territory has taken part in any UK-wide referendum as they did not participate in either the original 1975 EC Referendum or the 2011 AV Referendum as Gibraltar does not send any Members of Parliament to the House of Commons in Westminster.
| Overseas Territory | Voter turnout, of eligible |
Votes | Proportion of votes | ||
|---|---|---|---|---|---|
| Remain | Leave | Remain | Leave | ||
| Gibraltar | 83.6% | 19,322 | 823 | 95.9% | 4.1% |
West Midlands
.svg.png)
United Kingdom European Union membership referendum, 2016 West Midlands | |||
| Choice | Votes | % | |
|---|---|---|---|
| Leave the European Union | 1,755,687 | 59.26% | |
| Remain a member of the European Union | 1,207,175 | 40.74% | |
| Valid votes | 2,962,862 | 99.92% | |
| Invalid or blank votes | 2,507 | 0.08% | |
| Total votes | 2,965,369 | 100.00% | |
| Registered voters and turnout | 4,116,572 | 72.03% | |
| Source: Electoral Commission | |||
| Leave: 1,775,687 (59.3%) |
Remain: 1,207,175 (40.7%) | ||
| ▲ | |||
The West Midlands region was broken down into 30 voting areas.
| District | Voter turnout, of eligible |
Votes | Proportion of votes | ||
|---|---|---|---|---|---|
| Remain | Leave | Remain | Leave | ||
| Birmingham | 63.7% | 223,451 | 227,251 | 49.6% | 50.4% |
| Bromsgrove | 79.3% | 26,252 | 32,563 | 44.6% | 55.4% |
| Cannock Chase | 71.4% | 16,684 | 36,894 | 31.1% | 68.9% |
| Coventry | 69.2% | 67,967 | 85,097 | 44.4% | 55.6% |
| Dudley | 71.7% | 56,780 | 118,446 | 32.4% | 67.6% |
| East Staffordshire | 74.3% | 22,850 | 39,266 | 36.8% | 63.2% |
| Herefordshire | 78.3% | 44,148 | 64,122 | 40.8% | 59.2% |
| Lichfield | 78.7% | 26,064 | 37,214 | 41.2% | 58.8% |
| Malvern Hills | 80.5% | 23,203 | 25,294 | 47.8% | 52.2% |
| Newcastle-under-Lyme | 74.3% | 25,477 | 43,457 | 37.0% | 63.0% |
| North Warwickshire | 76.2% | 12,569 | 25,385 | 33.1% | 66.9% |
| Nuneaton and Bedworth | 74.3% | 23,736 | 46,095 | 34.0% | 66.0% |
| Redditch | 75.2% | 17,303 | 28,579 | 37.7% | 62.3% |
| Rugby | 79.0% | 25,350 | 33,199 | 43.3% | 56.7% |
| Sandwell | 66.5% | 49,004 | 98,250 | 33.3% | 66.7% |
| Shropshire | 77.3% | 78,987 | 104,166 | 43.1% | 56.9% |
| Solihull | 76.0% | 53,466 | 68,484 | 43.8% | 56.2% |
| South Staffordshire | 77.8% | 23,444 | 43,248 | 35.2% | 64.8% |
| Stafford | 77.8% | 34,098 | 43,386 | 44.0% | 56.0% |
| Staffordshire Moorlands | 75.3% | 21,076 | 38,684 | 35.3% | 64.7% |
| Stoke-on-Trent | 65.7% | 36,027 | 81,563 | 30.6% | 69.4% |
| Stratford-on-Avon | 80.8% | 38,341 | 40,817 | 48.4% | 51.6% |
| Tamworth | 74.1% | 13,705 | 28,424 | 32.5% | 67.5% |
| Telford and Wrekin | 72.1% | 32,954 | 56,649 | 36.8% | 63.2% |
| Walsall | 69.6% | 43,572 | 92,007 | 32.1% | 67.9% |
| Warwick | 79.2% | 47,976 | 33,642 | 58.8% | 41.2% |
| Wolverhampton | 67.5% | 44,138 | 73,798 | 37.4% | 62.6% |
| Worcester | 73.8% | 25,125 | 29,114 | 46.3% | 53.7% |
| Wychavon | 80.8% | 32,188 | 44,201 | 42.1% | 57.9% |
| Wyre Forest | 74.0% | 21,240 | 36,392 | 36.9% | 63.1% |
Yorkshire and the Humber
.svg.png)
United Kingdom European Union membership referendum, 2016 Yorkshire and the Humber | |||
| Choice | Votes | % | |
|---|---|---|---|
| Leave the European Union | 1,580,937 | 57.71% | |
| Remain a member of the European Union | 1,158,298 | 42.29% | |
| Valid votes | 2,739,235 | 99.93% | |
| Invalid or blank votes | 1,937 | 0.07% | |
| Total votes | 2,741,172 | 100.00% | |
| Registered voters and turnout | 3,877,780 | 70.69% | |
| Source: Electoral Commission | |||
| Leave: 1,580,937 (57.7%) |
Remain: 1,158,298 (42.3%) | ||
| ▲ | |||
The Yorkshire and the Humber region was broken down into 21 voting areas.
| District | Voter turnout, of eligible |
Votes | Proportion of votes | ||
|---|---|---|---|---|---|
| Remain | Leave | Remain | Leave | ||
| Barnsley | 69.9% | 38,951 | 83,958 | 31.7% | 68.3% |
| Bradford | 66.7% | 104,575 | 123,913 | 45.8% | 54.2% |
| Calderdale | 71.0% | 46,950 | 58,975 | 44.3% | 55.7% |
| Craven | 81.0% | 16,930 | 18,961 | 47.2% | 52.8% |
| Doncaster | 69.5% | 46,922 | 104,260 | 31.0% | 69.0% |
| East Riding of Yorkshire | 74.9% | 78,779 | 120,136 | 39.6% | 60.4% |
| Hambleton | 78.4% | 25,480 | 29,502 | 46.3% | 53.7% |
| Harrogate | 78.8% | 48,211 | 46,374 | 51.0% | 49.0% |
| Kingston upon Hull | 62.9% | 36,709 | 76,646 | 32.4% | 67.6% |
| Kirklees | 70.8% | 98,485 | 118,755 | 45.3% | 54.7% |
| Leeds | 71.3% | 194,863 | 192,474 | 50.3% | 49.7% |
| North East Lincolnshire | 67.9% | 23,797 | 55,185 | 30.1% | 69.9% |
| North Lincolnshire | 71.9% | 29,947 | 58,915 | 33.7% | 66.3% |
| Richmondshire | 75.1% | 11,945 | 15,691 | 43.2% | 56.8% |
| Rotherham | 69.5% | 44,115 | 93,272 | 32.1% | 67.9% |
| Ryedale | 77.2% | 14,340 | 17,710 | 44.7% | 55.3% |
| Scarborough | 73.0% | 22,999 | 37,512 | 38.0% | 62.0% |
| Selby | 79.1% | 21,071 | 30,532 | 40.8% | 59.2% |
| Sheffield | 67.3% | 130,735 | 136,018 | 49.0% | 51.0% |
| Wakefield | 71.1% | 58,877 | 116,165 | 33.6% | 66.4% |
| York | 70.6% | 63,617 | 45,983 | 58.0% | 42.0% |
Northern Ireland
Northern Ireland was a single voting area, as well as being a regional count although local totals were announced in each of the Westminister Parliamentary constituency areas within Northern Ireland but did not constitute as voting areas.[3]
.svg.png)
| United Kingdom European Union membership referendum, 2016 Northern Ireland | |||
| Choice | Votes | % | |
|---|---|---|---|
| Remain a member of the European Union | 440,707 | 55.78% | |
| Leave the European Union | 349,442 | 44.22% | |
| Valid votes | 790,149 | 99.95% | |
| Invalid or blank votes | 374 | 0.05% | |
| Total votes | 790,523 | 100.00% | |
| Registered voters and turnout | 1,260,955 | 62.69% | |
| Source: Electoral Commission | |||
| Leave: 349,442 (44.2%) |
Remain: 470,707 (55.8%) | ||
| ▲ | |||
Northern Ireland local totals by Parliamentary constituencies.
| Constituency | Voter turnout, of eligible |
Votes | Proportion of votes | ||
|---|---|---|---|---|---|
| Remain | Leave | Remain | Leave | ||
| Belfast East | 65.8% | 20,728 | 21,918 | 48.6% | 51.4% |
| Belfast North | 57.5% | 20,128 | 19,844 | 50.4% | 49.6% |
| Belfast South | 67.6% | 30,960 | 13,596 | 69.5% | 30.5% |
| Belfast West | 48.9% | 23,099 | 8,092 | 74.1% | 25.9% |
| East Antrim | 65.2% | 18,616 | 22,929 | 44.8% | 55.2% |
| East Londonderry | 59.7% | 21,098 | 19,455 | 52.0% | 48.0% |
| Fermanagh and South Tyrone | 67.8% | 28,200 | 19,958 | 58.6% | 41.4% |
| Foyle | 57.4% | 32,064 | 8,905 | 78.3% | 21.7% |
| Lagan Valley | 66.6% | 22,710 | 25,704 | 46.9% | 53.1% |
| Mid Ulster | 61.6% | 25,612 | 16,799 | 60.4% | 39.6% |
| Newry and Armagh | 63.9% | 31,963 | 18,659 | 62.9% | 36.9% |
| North Antrim | 64.9% | 18,782 | 30,938 | 37.8% | 62.2% |
| North Down | 67.7% | 23,131 | 21,046 | 52.4% | 47.6% |
| South Antrim | 63.1% | 21,498 | 22,055 | 49.4% | 50.6% |
| South Down | 62.2% | 32,076 | 15,625 | 67.2% | 32.8% |
| Strangford | 64.5% | 18,727 | 23,383 | 44.5% | 55.5% |
| Upper Bann | 63.6% | 24,550 | 27,262 | 47.4% | 52.6% |
| West Tyrone | 61.8% | 26,765 | 13,274 | 66.8% | 33.2% |
Scotland
.svg.png)
The Scottish council areas were used as the voting areas for the referendum throughout Scotland.
United Kingdom European Union membership referendum, 2016 Scotland | |||
| Choice | Votes | % | |
|---|---|---|---|
| Remain a member of the European Union | 1,661,191 | 62.00% | |
| Leave the European Union | 1,018,322 | 38.00% | |
| Valid votes | 2,679,513 | 99.94% | |
| Invalid or blank votes | 1,666 | 0.06% | |
| Total votes | 2,681,179 | 100.00% | |
| Registered voters and turnout | 3,987,112 | 67.25% | |
| Source: Electoral Commission | |||
| Leave: 1,018,322 (38%) |
Remain: 1,661,191 (62%) | ||
| ▲ | |||
Scotland was broken down into 32 voting areas.
| Council area | Voter turnout, of eligible |
Votes | Proportion of votes | ||
|---|---|---|---|---|---|
| Remain | Leave | Remain | Leave | ||
| Aberdeen City | 67.9% | 63,985 | 40,729 | 61.1% | 38.9% |
| Aberdeenshire | 70.6% | 76,445 | 62,516 | 55.0% | 45.0% |
| Angus | 68.0% | 32,747 | 26,511 | 55.3% | 44.7% |
| Argyll and Bute | 73.1% | 29,494 | 19,202 | 60.6% | 39.4% |
| Clackmannanshire | 67.2% | 14,691 | 10,736 | 57.8% | 42.2% |
| Dumfries and Galloway | 71.4% | 43,864 | 38,803 | 53.1% | 46.9% |
| Dundee City | 62.9% | 39,688 | 26,697 | 59.8% | 40.2% |
| East Ayrshire | 62.9% | 33,891 | 23,942 | 58.6% | 41.4% |
| East Dunbartonshire | 75.1% | 44,534 | 17,840 | 71.4% | 28.6% |
| East Lothian | 71.7% | 36,026 | 19,738 | 64.6% | 35.4% |
| East Renfrewshire | 76.1% | 39,345 | 13,596 | 74.3% | 25.7% |
| City of Edinburgh | 72.9% | 187,796 | 64,498 | 74.4% | 25.6% |
| Falkirk | 67.5% | 44,987 | 34,271 | 56.8% | 43.2% |
| Fife | 66.7% | 106,754 | 75,466 | 58.6% | 41.4% |
| Glasgow City | 56.2% | 168,335 | 84,474 | 66.6% | 33.4% |
| Highland | 71.6% | 70,308 | 55,349 | 56.0% | 44.0% |
| Inverclyde | 66.0% | 24,688 | 14,010 | 63.8% | 36.2% |
| Midlothian | 68.1% | 28,217 | 17,251 | 62.1% | 37.9% |
| Moray | 67.4% | 24,114 | 23,992 | 50.1% | 49.9% |
| North Ayrshire | 64.6% | 38,394 | 29,110 | 56.9% | 43.1% |
| North Lanarkshire | 60.9% | 95,549 | 59,400 | 61.7% | 38.3% |
| Perth and Kinross | 73.7% | 49,641 | 31,614 | 61.1% | 38.9% |
| Renfrewshire | 69.2% | 57,119 | 31,010 | 64.8% | 35.2% |
| Scottish Borders | 73.4% | 37,952 | 26,962 | 58.5% | 41.5% |
| Stirling | 74.0% | 33,112 | 15,787 | 67.7% | 32.3% |
| South Lanarkshire | 65.3% | 102,568 | 60,024 | 63.1% | 36.9% |
| South Ayrshire | 69.8% | 36,265 | 25,241 | 59.0% | 41.0% |
| West Dunbartonshire | 63.9% | 26,794 | 16,426 | 62.0% | 38.0% |
| West Lothian | 67.6% | 51,560 | 36,948 | 58.3% | 41.7% |
| Na h-Eileanan Siar (Western Isles) | 70.1% | 8,232 | 6,671 | 55.2% | 44.8% |
| Orkney | 68.3% | 7,189 | 4,193 | 63.2% | 36.8% |
| Shetland | 70.3% | 6,907 | 5,315 | 56.5% | 43.5% |
Whilst all council counting areas show a majority for Remain one constituency, Banff and Buchan, voted to Leave the European Union at the 2016 European Union membership referendum on an estimated margin of 54% Leave 46% Remain.[11][12] The Leave vote in the area was concentrated around the north coast of Aberdeenshire between the fishing towns of Banff and Peterhead, where there were 23,707 Leave votes to 14,918 Remain votes (61% Leave 39% Remain).[13][14]
The areas of Whalsay and South Unst in the Shetland Islands and An Taobh Siar agus Nis in the Na h-Eileanan an Iar (Western Isles) also voted by a majority for Leave,[15] as did the town of Lossiemouth in Moray.[16][17]
Wales
.svg.png)
The Welsh council areas were used as the voting areas for the referendum throughout Wales.
United Kingdom European Union membership referendum, 2016 Wales | |||
| Choice | Votes | % | |
|---|---|---|---|
| Leave the European Union Gadael yr Undeb Ewropeaidd |
854,572 | 52.53% | |
| Remain a member of the European Union Aros yn aelod o'r Undeb Ewropeaidd |
772,347 | 47.47% | |
| Valid votes | 1,626,919 | 99.93% | |
| Invalid or blank votes | 1,135 | 0.07% | |
| Total votes | 1,628,054 | 100.00% | |
| Registered voters and turnout | 2,270,272 | 71.71% | |
| Source: Electoral Commission | |||
| Leave: 854,572 (52.5%) |
Remain: 772,347 (47.5%) | ||
| ▲ | |||
Wales was broken down into 22 voting areas.
| Council area | Voter turnout, of eligible |
Votes | Proportion of votes | ||
|---|---|---|---|---|---|
| Remain | Leave | Remain | Leave | ||
| Anglesey | 73.8% | 18,618 | 19,333 | 49.1% | 50.9% |
| Blaenau Gwent | 68.1% | 13,215 | 21,587 | 38.0% | 62.0% |
| Bridgend | 71.1% | 33,723 | 40,622 | 45.4% | 54.6% |
| Caerphilly | 70.7% | 39,178 | 53,295 | 42.4% | 57.6% |
| Cardiff | 69.6% | 101,788 | 67,816 | 60.0% | 40.0% |
| Carmarthenshire | 74.0% | 47,654 | 55,381 | 46.3% | 53.7% |
| Ceredigion | 74.4% | 21,711 | 18,031 | 54.6% | 45.4% |
| Conwy | 71.7% | 30,147 | 35,357 | 46.0% | 54.0% |
| Denbighshire | 69.1% | 23,955 | 28,117 | 46.0% | 54.0% |
| Flintshire | 74.8% | 37,867 | 48,930 | 43.6% | 56.4% |
| Gwynedd | 72.3% | 35,517 | 25,665 | 58.1% | 41.9% |
| Merthyr Tydfil | 67.4% | 12,574 | 16,291 | 43.6% | 56.4% |
| Monmouthshire | 77.7% | 28,061 | 27,569 | 50.4% | 49.6% |
| Neath Port Talbot | 71.5% | 32,651 | 43,001 | 43.2% | 56.8% |
| Newport | 70.2% | 32,413 | 41,236 | 44.0% | 56.0% |
| Pembrokeshire | 74.4% | 29,367 | 39,155 | 42.9% | 57.1% |
| Powys | 77.0% | 36,762 | 42,707 | 46.3% | 53.7% |
| Rhondda Cynon Taf | 67.4% | 53,973 | 62,590 | 46.3% | 53.7% |
| Swansea | 69.5% | 58,307 | 61,936 | 48.5% | 51.5% |
| Torfaen | 69.8% | 19,363 | 28,781 | 40.2% | 59.8% |
| Vale of Glamorgan | 76.1% | 36,681 | 35,628 | 50.7% | 49.3% |
| Wrexham | 71.5% | 28,822 | 41,544 | 41.0% | 59.0% |
Results by constituency
The EU referendum vote was not counted by parliamentary constituencies except for Northern Ireland. However a number of local councils and districts have released the referendum results by electoral ward or constituency. Moreover, several constituency boundaries are coterminous with their local government district. For constituencies elswhere, Dr Chris Hanretty, a Reader in Politics at the University of East Anglia, estimated through a demographic model the 'Leave' and 'Remain' votes in each constituency.[18] Hanretty urges caution in the interpretation of the data as the estimates have a margin of error.
Constituency results by party
| Party | Remain | Leave | Remain % | Leave % | |
|---|---|---|---|---|---|
| Conservative Party | 80 | 247 | 26% | 74% | |
| Labour Party | 84 | 148 | 36% | 64% | |
| SNP | 55 | 1 | 98% | 2% | |
| Liberal Democrats | 6 | 2 | 75% | 25% | |
| DUP | 2 | 6 | 25% | 75% | |
| Sinn Féin | 4 | 0 | 100% | 0% | |
| Plaid Cymru | 2 | 1 | 67% | 33% | |
| Social Democratic and Labour Party | 3 | 0 | 100% | 0% | |
| Independent | 1 | 1 | 50% | 50% | |
| Ulster Unionist Party | 1 | 1 | 50% | 50% | |
| Green Party | 1 | 0 | 100% | 0% | |
| Speaker | 1 | 0 | 100% | 0% | |
| Total | 242 | 406 | 37% | 63% | |
List of constituency results
| Constituency | Member of Parliament | MP position | MP's majority | Region | Proportion of votes | Notes | |||
|---|---|---|---|---|---|---|---|---|---|
| Remain % | Leave % | ||||||||
| Streatham | Chuka Umunna | Remain | 27.9% | Greater London | 79.5% | 20.5% | [19] | ||
| Bristol West | Thangam Debbonaire | Remain | 8.4% | South West England | 79.3% | 20.7% | [20] | ||
| Hackney North and Stoke Newington | Diane Abbott | Remain | 48.1% | Greater London | 79.1% | 20.9% | [21] | ||
| Glasgow North | Patrick Grady | Remain | 25.2% | Scotland | 78.4% | 21.6% | [22] | ||
| Islington North | Jeremy Corbyn | Remain | 43.0% | Greater London | 78.4% | 21.6% | [23] | ||
| Foyle | Mark Durkan | Remain | 16.3% | Northern Ireland | 78.3% | 21.7% | |||
| Edinburgh North and Leith | Deidre Brock | Remain | 9.6% | Scotland | 78.2% | 21.8% | [24] | ||
| Dulwich and West Norwood | Helen Hayes | Remain | 31.4% | Greater London | 78.0% | 22.0% | [21] | ||
| Hackney South and Shoreditch | Meg Hillier | Remain | 50.9% | Greater London | 77.9% | 22.1% | [21] | ||
| Edinburgh South | Ian Murray | Remain | 5.4% | Scotland | 77.8% | 22.2% | [24] | ||
| Vauxhall | Kate Hoey | Leave | 26.5% | Greater London | 77.6% | 22.4% | [19] | ||
| Battersea | Jane Ellison | Remain | 15.6% | Greater London | 77.0% | 23.0% | [21] | ||
| Hampstead and Kilburn | Tulip Siddiq | Remain | 2.1% | Greater London | 76.6% | 23.4% | [21] | ||
| Tottenham | David Lammy | Remain | 55.4% | Greater London | 76.2% | 23.8% | [23] | ||
| Lewisham Deptford | Vicky Foxcroft | Remain | 45.4% | Greater London | 75.4% | 24.6% | [21] | ||
| Hornsey and Wood Green | Catherine West | Remain | 19.1% | Greater London | 75.0% | 25.0% | [23] | ||
| Tooting | Rosena Allin-Khan | Remain | 19.9% | Greater London | 74.7% | 25.3% | [21] | ||
| East Renfrewshire | Kirsten Oswald | Remain | 6.6% | Scotland | 74.3% | 25.7% | |||
| Belfast West | Paul Maskey | Remain | 35.0% | Northern Ireland | 74.1% | 25.9% | |||
| Cambridge | Daniel Zeichner | Remain | 1.2% | East of England | 73.8% | 26.2% | [25] | ||
| Manchester Withington | Jeff Smith | Remain | 29.8% | North West England | 73.7% | 26.3% | [21] | ||
| Brighton Pavilion | Caroline Lucas | Remain | 14.6% | South East England | 73.4% | 26.6% | [23] | ||
| East Dunbartonshire | John Nicolson | Remain | 4.0% | Scotland | 73.3% | 26.7% | [21] | ||
| Holborn and St Pancras | Keir Starmer | Remain | 31.0% | Greater London | 73.3% | 26.7% | [26] | ||
| Richmond Park | Zac Goldsmith | Leave | 38.9% | Greater London | 73.3% | 27.7% | [21] | ||
| Liverpool Riverside | Louise Ellman | Remain | 55.3% | North West England | 73.2% | 26.8% | [21] | ||
| Putney | Justine Greening | Remain | 23.8% | Greater London | 73.2% | 26.8% | [21] | ||
| Bermondsey and Old Southwark | Neil Coyle | Remain | 8.7% | Greater London | 73.0% | 27.0% | [21] | ||
| Edinburgh East | Tommy Sheppard | Remain | 19.3% | Scotland | 72.4% | 27.6% | [24] | ||
| Edinburgh South West | Joanna Cherry | Remain | 15.8% | Scotland | 72.1% | 27.9% | [24] | ||
| Glasgow South | Stewart McDonald | Remain | 25.2% | Scotland | 71.8% | 28.2% | [22] | ||
| Islington South and Finsbury | Emily Thornberry | Remain | 28.7% | Greater London | 71.7% | 28.3% | [23] | ||
| Cities of London and Westminster | Mark Field | Remain | 26.7% | Greater London | 71.4% | 28.6% | [21] | ||
| Edinburgh West | Michelle Thomson | Remain | 5.9% | Scotland | 71.2% | 28.8% | [24] | ||
| Glasgow Central | Alison Thewliss | Remain | 19.5% | Scotland | 71.2% | 28.8% | [22] | ||
| Ealing Central and Acton | Rupa Huq | Remain | 0.5% | Greater London | 70.9% | 29.1% | [27] | ||
| Chelsea and Fulham | Greg Hands | Remain | 39.8% | Greater London | 70.8% | 29.2% | [21] | ||
| Wimbledon | Stephen Hammond | Remain | 26.1% | Greater London | 70.6% | 29.4% | [23] | ||
| Camberwell and Peckham | Harriet Harman | Remain | 50.1% | Greater London | 69.9% | 30.1% | [21] | ||
| Cardiff Central | Jo Stevens | Remain | 12.9% | Wales | 69.7% | 30.3% | [21] | ||
| Sheffield Central | Paul Blomfield | Remain | 39.2% | Yorkshire and the Humber | 69.6% | 30.4% | [21] | ||
| Belfast South | Alasdair McDonnell | Remain | 2.3% | Northern Ireland | 69.5% | 30.5% | |||
| Bethnal Green and Bow | Rushanara Ali | Remain | 45.9% | Greater London | 69.1% | 30.9% | [21] | ||
| Finchley and Golders Green | Mike Freer | Remain | 11.2% | Greater London | 69.1% | 30.9% | [21] | ||
| Hammersmith | Andy Slaughter | Remain | 13.6% | Greater London | 69.0% | 31.0% | [21] | ||
| Kensington | Victoria Borwick | Leave | 21.1% | Greater London | 68.7% | 31.3% | [21] | ||
| Glasgow North West | Carol Monaghan | Remain | 23.6% | Scotland | 68.5% | 31.5% | [22] | ||
| Bath | Ben Howlett | Remain | 8.1% | South West England | 68.4% | 31.6% | [21] | ||
| Aberdeen South | Callum McCaig | Remain | 14.9% | Scotland | 67.7% | 32.3% | [21] | ||
| Stirling | Steven Paterson | Remain | 23.4% | Scotland | 67.7% | 32.3% | [23] | ||
| Oxford East | Andrew David Smith | Remain | 30.1% | South East England | 67.7% | 32.3% | [21] | ||
| South Down | Margaret Ritchie | Remain | 13.8% | Northern Ireland | 67.2% | 32.8% | |||
| Westminster North | Karen Patricia Buck | Remain | 5.4% | Greater London | 67.1% | 32.9% | [21] | ||
| West Tyrone | Pat Doherty | Remain | 26.0% | Northern Ireland | 66.8% | 33.2% | |||
| Walthamstow | Stella Creasy | Remain | 23.4% | Greater London | 66.5% | 33.5% | [28] | ||
| Birmingham Hall Green | Roger Godsiff | Leave | 42.1% | West Midlands | 66.4% | 33.6% | [29] | ||
| Twickenham | Tania Mathias | Remain | 3.2% | Greater London | 66.4% | 33.6% | [21] | ||
| Hove | Peter Kyle | Remain | 2.4% | South East England | 66.1% | 33.9% | [21] | ||
| Paisley and Renfrewshire South | Mhairi Black | Remain | 12.3% | Scotland | 65.9% | 34.1% | [21] | ||
| Poplar and Limehouse | Jim Fitzpatrick | Remain | 33.1% | Greater London | 65.9% | 34.1% | [21] | ||
| Lewisham West and Penge | Jim Dowd | Remain | 26.4% | Greater London | 65.6% | 34.4% | [21] | ||
| Arfon | Hywel Williams | Remain | 13.7% | Wales | 65.1% | 34.9% | [21] | ||
| Leeds North West | Greg Mulholland | Remain | 6.7% | Yorkshire and the Humber | 64.7% | 35.3% | [21] | ||
| East Lothian | George Kerevan | Remain | 11.5% | Scotland | 64.6% | 35.4% | |||
| Lanark and Hamilton East | Angela Crawley | Remain | 18.3% | Scotland | 64.6% | 35.4% | [21] | ||
| Lewisham East | Heidi Alexander | Remain | 33.4% | Greater London | 64.6% | 35.4% | [21] | ||
| Birmingham Ladywood | Shabana Mahmood | Remain | 60.9% | West Midlands | 64.4% | 35.6% | [29] | ||
| Greenwich and Woolwich | Matthew Pennycook | Remain | 25.6% | Greater London | 64.3% | 35.7% | [30] | ||
| Liverpool Wavertree | Luciana Berger | Remain | 59.3% | North West England | 64.2% | 35.8% | [21] | ||
| Sheffield Hallam | Nick Clegg | Remain | 4.2% | Yorkshire and the Humber | 64.1% | 35.9% | [21] | ||
| Paisley and Renfrewshire North | Gavin Newlands | Remain | 18.0% | Scotland | 64.0% | 36.0% | [21] | ||
| Inverclyde | Ronnie Cowan | Remain | 24.8% | Scotland | 63.8% | 36.2% | |||
| Manchester Central | Lucy Powell | Remain | 47.7% | North West England | 63.4% | 36.6% | [21] | ||
| Motherwell and Wishaw | Marion Fellows | Remain | 24.6% | Scotland | 63.1% | 36.9% | [21] | ||
| Leyton and Wanstead | John Cryer | Leave | 27.9% | Greater London | 62.9% | 37.1% | [28] | ||
| Newry and Armagh | Mickey Brady | Remain | 8.4% | Northern Ireland | 62.9% | 37.1% | |||
| Leeds North East | Fabian Hamilton | Remain | 15.0% | Yorkshire and the Humber | 62.7% | 37.3% | [21] | ||
| Rutherglen and Hamilton West | Margaret Ferrier | Remain | 17.3% | Scotland | 62.7% | 37.3% | [21] | ||
| St Albans | Anne Main | Leave | 23.4% | East of England | 62.6% | 37.4% | [23] | ||
| Cumbernauld, Kilsyth and Kirkintilloch East | Stuart McDonald | Remain | 29.9% | Scotland | 62.1% | 37.9% | [21] | ||
| East Kilbride, Strathaven and Lesmahagow | Lisa Cameron | Remain | 27.3% | Scotland | 62.1% | 37.9% | [21] | ||
| Enfield Southgate | David Burrowes | Leave | 10.4% | Greater London | 62.1% | 37.9% | [23] | ||
| Manchester Gorton | Gerald Kaufman | Remain | 57.3% | North West England | 62.1% | 37.9% | [21] | ||
| Midlothian | Owen Thompson | Remain | 20.4% | Scotland | 62.1% | 37.9% | [14] | ||
| West Dunbartonshire | Martin Docherty | Remain | 27.7% | Scotland | 62.0% | 38.0% | |||
| North East Fife | Stephen Gethins | Remain | 9.6% | Scotland | 61.9% | 38.1% | [21] | ||
| Oxford West and Abingdon | Nicola Blackwood | Remain | 16.7% | South East England | 61.9% | 38.1% | [21] | ||
| Dundee East | Stewart Hosie | Remain | 39.8% | Scotland | 61.8% | 38.2% | [21] | ||
| Reading East | Rob Wilson | Remain | 12.9% | South East England | 61.8% | 38.2% | [21] | ||
| Altrincham and Sale West | Graham Brady | Leave | 26.3% | North West England | 61.6% | 38.4% | [21] | ||
| South Cambridgeshire | Heidi Allen | Remain | 33.5% | East of England | 61.6% | 38.4% | [21] | ||
| York Central | Rachael Maskell | Remain | 14.1% | Yorkshire and the Humber | 61.5% | 38.5% | [21] | ||
| West Aberdeenshire and Kincardine | Stuart Donaldson | Remain | 12.7% | Scotland | 61.4% | 38.6% | [21] | ||
| Coatbridge, Chryston and Bellshill | Phil Boswell | Remain | 22.7% | Scotland | 61.3% | 38.7% | [21] | ||
| Cardiff North | Craig Williams | Remain | 4.2% | Wales | 60.9% | 39.0% | [21] | ||
| Ochil and South Perthshire | Tasmina Ahmed-Sheikh | Remain | 17.6% | Scotland | 60.8% | 39.2% | [21] | ||
| Argyll and Bute | Brendan O'Hara | Remain | 16.3% | Scotland | 60.6% | 39.4% | |||
| Kilmarnock and Loudoun | Alan Brown | Remain | 25.3% | Scotland | 60.4% | 39.6% | [21] | ||
| Mid Ulster | Francie Molloy | Remain | 33.3% | Northern Ireland | 60.4% | 39.6% | |||
| Hitchin and Harpenden | Peter Lilley | Leave | 36.2% | East of England | 60.3% | 39.7% | [23] | ||
| Winchester | Steve Brine | Remain | 30.6% | South East England | 60.3% | 39.7% | [21] | ||
| Airdrie and Shotts | Neil Gray | Remain | 19.8% | Scotland | 60.0% | 40.0% | [21] | ||
| Dunfermline and West Fife | Douglas Chapman | Remain | 18.5% | Scotland | 60.0% | 40.0% | [21] | ||
| Perth and North Perthshire | Pete Wishart | Remain | 17.8% | Scotland | 59.9% | 40.1% | [21] | ||
| Norwich South | Clive Lewis | Remain | 15.8% | East of England | 59.8% | 40.2% | [31] | ||
| Orkney and Shetland | Alistair Carmichael | Remain | 3.6% | Scotland | 59.7% | 40.3% | |||
| South West Surrey | Jeremy Hunt | Remain | 49.8% | South East England | 59.4% | 40.6% | [21] | ||
| Glasgow North East | Anne McLaughlin | Remain | 24.4% | Scotland | 59.3% | 40.7% | [22] | ||
| Chipping Barnet | Theresa Villiers | Leave | 14.4% | Greater London | 59.1% | 40.9% | [21] | ||
| Croydon North | Steve Reed | Remain | 39.9% | Greater London | 59.1% | 40.9% | [32] | ||
| Glasgow South West | Chris Stephens | Remain | 24.3% | Scotland | 59.1% | 40.9% | [22] | ||
| Dundee West | Chris Law | Remain | 38.2% | Scotland | 58.9% | 41.1% | [21] | ||
| Guildford | Anne Milton | Unknown | 41.6% | South East England | 58.9% | 41.1% | [21] | ||
| Newcastle upon Tyne East | Nick Brown | Remain | 31.9% | North East England | 58.9% | 41.1% | [21] | ||
| Warwick and Leamington | Chris White | Remain | 13.1% | West Midlands | 58.9% | 41.1% | [21] | ||
| Inverness, Nairn, Badenoch and Strathspey | Drew Hendry | Remain | 18.8% | Scotland | 58.7% | 41.3% | [21] | ||
| Rushcliffe | Kenneth Clarke | Remain | 25.1% | East Midlands | 58.7% | 41.3% | [21] | ||
| Fermanagh and South Tyrone | Tom Elliott | Leave | 1.0% | Northern Ireland | 58.6% | 41.4% | |||
| Kingston and Surbiton | James Berry | Remain | 4.8% | Greater London | 58.5% | 41.5% | [21] | ||
| Bristol North West | Charlotte Leslie | Leave | 9.5% | South West England | 58.4% | 41.6% | [20] | ||
| Esher and Walton | Dominic Raab | Leave | 50.2% | South East England | 58.4% | 41.6% | [21] | ||
| Kirkcaldy and Cowdenbeath | Roger Mullin | Remain | 18.9% | Scotland | 58.4% | 41.6% | [21] | ||
| Linlithgow and East Falkirk | Martyn Day | Remain | 21.0% | Scotland | 58.4% | 41.6% | [21] | ||
| Ealing Southall | Virendra Sharma | Remain | 43.3% | Greater London | 58.2% | 41.8% | [27] | ||
| Falkirk | John McNally | Remain | 32.6% | Scotland | 58.1% | 41.9% | [21] | ||
| Hendon | Matthew Offord | Leave | 7.5% | Greater London | 58.1% | 41.9% | [21] | ||
| North Ayrshire and Arran | Patricia Gibson | Remain | 25.2% | Scotland | 57.8% | 42.2% | [21] | ||
| Central Ayrshire | Philippa Whitford | Remain | 26.8% | Scotland | 57.8% | 42.2% | [21] | ||
| Wokingham | John Redwood | Leave | 43.2% | South East England | 57.6% | 42.4% | [21] | ||
| Leicester South | Jon Ashworth | Remain | 38.9% | East Midlands | 57.5% | 42.5% | [21] | ||
| Swansea West | Geraint Davies | Remain | 20.0% | Wales | 57.4% | 42.6% | [21] | ||
| Cheadle | Mary Robinson | Remain | 12.2% | North West England | 57.3% | 42.7% | [33] | ||
| Cheltenham | Alex Chalk | Remain | 12.1% | South West England | 57.3% | 42.7% | [21] | ||
| City of Chester | Chris Matheson | Remain | 0.2% | North West England | 57.3% | 42.7% | [21] | ||
| Ayr, Carrick, and Cumnock | Corri Wilson | Remain | 21.6% | Scotland | 57.1% | 42.9% | [21] | ||
| Brent Central | Dawn Butler | Remain | 41.8% | Greater London | 57.1% | 42.9% | [21] | ||
| Nottingham East | Chris Leslie | Remain | 33.8% | East Midlands | 57.1% | 42.9% | [34] | ||
| Aberdeen North | Kirsty Blackman | Remain | 30.5% | Scotland | 57.0% | 43.0% | [21] | ||
| Brent North | Barry Gardiner | Remain | 20.7% | Greater London | 57.0% | 43.0% | [21] | ||
| Henley | John Howell | Remain | 45.9% | South East England | 57.0% | 43.0% | [21] | ||
| Berwickshire, Roxburgh & Selkirk | Calum Kerr | Remain | 0.6% | Scotland | 56.8% | 43.2% | [21] | ||
| Brentford and Isleworth | Ruth Cadbury | Remain | 0.8% | Greater London | 56.7% | 43.3% | [35] | ||
| Ross, Skye and Lochaber | Ian Blackford | Remain | 12.3% | Scotland | 56.7% | 43.3% | [21] | ||
| Brighton Kemptown | Simon Kirby | Remain | 1.5% | South East England | 57.6% | 43.4% | [21] | ||
| Harrow West | Gareth Thomas | Remain | 4.7% | Greater London | 56.6% | 43.4% | [23] | ||
| Glasgow East | Natalie McGarry | Remain | 24.5% | Scotland | 56.2% | 43.8% | [22] | ||
| Ilford South | Mike Gapes | Remain | 38.1% | Greater London | 56.2% | 43.8% | [21] | ||
| Livingston | Hannah Bardell | Remain | 29.3% | Scotland | 56.2% | 43.8% | [21] | ||
| Dumfriesshire, Clydesdale and Tweeddale | David Mundell | Remain | 1.5% | Scotland | 56.1% | 43.9% | [21] | ||
| Woking | Jonathan Lord | Leave | 40.2% | South East England | 56.0% | 44.0% | [21] | ||
| City of Durham | Roberta Blackman-Woods | Remain | 25.0% | North East England | 55.7% | 44.3% | [21] | ||
| Gordon | Alex Salmond | Remain | 15.0% | Scotland | 55.5% | 44.5% | [21] | ||
| Exeter | Ben Bradshaw | Remain | 13.3% | South West England | 55.3% | 44.7% | [21] | ||
| Mitcham and Morden | Siobhain McDonagh | Remain | 37.5% | Greater London | 55.3% | 44.7% | [23] | ||
| Tunbridge Wells | Greg Clark | Remain | 44.5% | South East England | 55.3% | 44.7% | [21] | ||
| Wirral West | Margaret Greenwood | Remain | 1.0% | North West England | 55.3% | 44.7% | [36] | ||
| Cardiff West | Kevin Brennan | Remain | 15.5% | Wales | 55.2% | 44.8% | [21] | ||
| Na h-Eileanan an Iar | Angus MacNeil | Remain | 25.7% | Scotland | 55.2% | 44.8% | [23] | ||
| Cardiff South and Penarth | Stephen Doughty | Remain | 16.0% | Wales | 55.1% | 44.9% | [21] | ||
| South East Cambridgeshire | Lucy Frazer | Remain | 28.3% | East of England | 55.1% | 44.9% | [21] | ||
| York Outer | Julian Sturdy | Leave | 24.4% | Yorkshire and the Humber | 55.1% | 44.9% | [21] | ||
| Chesham and Amersham | Cheryl Gillan | Leave | 45.4% | South East England | 55.0% | 45.0% | |||
| Sefton Central | Bill Esterson | Remain | 24.2% | North West England | 54.9% | 45.1% | [21] | ||
| Canterbury | Julian Brazier | Leave | 18.3% | South East England | 54.7% | 45.3% | [21] | ||
| Dumfries and Galloway | Richard Arkless | Remain | 11.5% | Scotland | 54.7% | 45.3% | [21] | ||
| Hexham | Guy Opperman | Remain | 27.8% | North East England | 54.7% | 45.3% | [21] | ||
| Ceredigion | Mark Williams | Remain | 8.2% | Wales | 54.6% | 45.4% | |||
| Maidenhead | Theresa May | Remain | 54.0% | South East England | 54.6% | 45.4% | [21] | ||
| Edmonton | Kate Osamor | Remain | 37.3% | Greater London | 54.5% | 45.5% | [23] | ||
| Southport | John Pugh | Remain | 3.0% | North West England | 54.5% | 45.5% | [21] | ||
| Croydon South | Chris Philp | Remain | 29.7% | Greater London | 54.2% | 45.8% | [32] | ||
| Pontypridd | Owen Smith | Remain | 23.7% | Wales | 54.2% | 45.8% | [21] | ||
| Romsey and Southampton North | Caroline Nokes | Remain | 36.6% | South East England | 54.2% | 45.8% | [21] | ||
| Tatton | George Osborne | Remain | 40.3% | North West England | 54.2% | 45.8% | [21] | ||
| North East Hampshire | Ranil Jayawardena | Leave | 55.4% | South East England | 54.1% | 45.9% | [21] | ||
| Stroud | Neil Carmichael | Remain | 8.0% | South West England | 54.1% | 45.9% | [21] | ||
| Windsor | Adam Afriyie | Leave | 50.0% | South East England | 54.0% | 46.0% | [21] | ||
| Ealing North | Stephen Pound | Remain | 25.4% | Greater London | 53.7% | 46.3% | [27] | ||
| Witney | David Cameron | Remain | 14.8% | South East England | 53.7% | 46.3% | |||
| South West Hertfordshire | David Gauke | Remain | 40.6% | East of England | 53.7% | 46.3% | [21] | ||
| Wantage | Ed Vaizey | Remain | 37.3% | South East England | 53.6% | 46.4% | [21] | ||
| Glenrothes | Peter Grant | Remain | 29.2% | Scotland | 53.6% | 46.4% | [21] | ||
| Kenilworth and Southam | Jeremy Wright | Remain | 43.0% | West Midlands | 53.5% | 46.5% | [21] | ||
| Nottingham South | Lilian Greenwood | Remain | 16.0% | East Midlands | 53.5% | 46.5% | [34] | ||
| Mid Sussex | Nicholas Soames | Remain | 42.2% | South East England | 53.4% | 46.6% | [21] | ||
| Wirral South | Alison McGovern | Remain | 11.0% | North West England | 53.4% | 46.6% | [36] | ||
| Bradford West | Naz Shah | Remain | 28.3% | Yorkshire and the Humber | 53.3% | 46.7% | [23] | ||
| Bristol East | Kerry McCarthy | Remain | 8.6% | South West England | 53.2% | 46.8% | [20] | ||
| Stockport | Ann Coffey | Remain | 25.4% | North West England | 53.2% | 46.8% | [33] | ||
| Lewes | Maria Caulfield | Leave | 2.1% | South East England | 53.1% | 46.9% | [21] | ||
| Birmingham Selly Oak | Steve McCabe | Remain | 18.6% | West Midlands | 53.1% | 46.9% | [29] | ||
| East Ham | Stephen Timms | Remain | 65.5% | Greater London | 53.1% | 46.9% | [21] | ||
| Bristol South | Karin Smyth | Remain | 14.0% | South West England | 52.9% | 47.1% | [20] | ||
| Truro and Falmouth | Sarah Newton | Remain | 27.2% | South West England | 52.9% | 47.1% | [37] | ||
| Harrogate and Knaresborough | Andrew Jones | Remain | 30.7% | Yorkshire and the Humber | 52.8% | 47.2% | [21] | ||
| Birmingham Edgbaston | Gisela Stuart | Leave | 6.6% | West Midlands | 52.7% | 47.3% | [29] | ||
| West Ham | Lyn Brown | Remain | 53.0% | Greater London | 52.7% | 47.3% | [21] | ||
| Leeds Central | Hilary Benn | Remain | 37.7% | Yorkshire and the Humber | 52.4% | 47.4% | [21] | ||
| Westmorland and Lonsdale | Tim Farron | Remain | 18.3% | North West England | 52.6% | 47.4% | [21] | ||
| Harrow East | Bob Blackman | Leave | 9.7% | Greater London | 52.5% | 47.5% | [23] | ||
| Newbury | Richard Benyon | Remain | 46.0% | South East England | 52.5% | 47.5% | [21] | ||
| Mole Valley | Paul Beresford | Remain | 46.1% | South East England | 52.5% | 47.5% | [21] | ||
| North Down | Sylvia Hermon | Remain | 25.6% | Northern Ireland | 52.4% | 47.6% | |||
| Reigate | Crispin Blunt | Leave | 43.5% | South East England | 52.3% | 47.7% | [21] | ||
| The Cotswolds | Geoffrey Clifton-Brown | Leave | 37.9% | South West England | 52.3% | 47.7% | [21] | ||
| Garston and Halewood | Maria Eagle | Remain | 55.4% | North West England | 52.2% | 47.8% | [21] | ||
| Monmouth | David Davies | Leave | 23.1% | Wales | 52.2% | 47.8% | [21] | ||
| Tynemouth | Alan Campbell | Remain | 15.4% | North East England | 52.2% | 47.8% | [21] | ||
| Epsom and Ewell | Chris Grayling | Leave | 42.8% | South East England | 52.1% | 47.9% | [21] | ||
| Filton and Bradley Stoke | Jack Lopresti | Leave | 20.0% | South West England | 52.1% | 47.9% | [21] | ||
| North Somerset | Liam Fox | Leave | 39.2% | South West England | 52.1% | 47.9% | [21] | ||
| East Londonderry | Gregory Campbell | Leave | 22.5% | Northern Ireland | 52.0% | 48.0% | |||
| Wycombe | Steve Baker | Leave | 28.9% | South East England | 52.0% | 48.0% | [21] | ||
| Angus | Mike Weir | Remain | 25.2% | Scotland | 51.9% | 48.1% | [21] | ||
| Macclesfield | David Rutley | Remain | 29.9% | North West England | 51.9% | 48.1% | [21] | ||
| Dwyfor Meirionnydd | Liz Saville-Roberts | Remain | 18.2% | Wales | 51.7% | 48.3% | [21] | ||
| Newcastle upon Tyne Central | Chi Onwurah | Remain | 36.1% | North East England | 51.7% | 48.3% | [21] | ||
| Pudsey | Stuart Andrew | Leave | 8.8% | Yorkshire and the Humber | 51.7% | 48.3% | [21] | ||
| Beckenham | Bob Stewart | Leave | 37.8% | Greater London | 51.6% | 48.4% | [38] | ||
| Stretford and Urmston | Kate Green | Remain | 25.2% | North West England | 51.6% | 48.4% | [21] | ||
| Buckingham | John Bercow | Remain | 42.7% | South East England | 51.4% | 48.6% | [21] | ||
| Horsham | Jeremy Quin | Remain | 43.3% | South East England | 51.4% | 48.6% | [21] | ||
| East Hampshire | Damian Hinds | Remain | 48.7% | South East England | 51.3% | 48.7% | [21] | ||
| Coventry South | Jim Cunningham | Remain | 7.3% | West Midlands | 51.1% | 48.9% | [21] | ||
| Ruislip, Northwood and Pinner | Nick Hurd | Remain | 39.5% | Greater London | 51.0% | 49.0% | [21] | ||
| Beaconsfield | Dominic Grieve | Remain | 49.5% | South East England | 50.8% | 49.2% | [21] | ||
| Chingford and Woodford Green | Iain Duncan Smith | Leave | 19.1% | Greater London | 50.8% | 49.2% | [21] | ||
| Enfield North | Joan Ryan | Remain | 2.4% | Greater London | 50.8% | 49.2% | [23] | ||
| Hertford and Stortford | Mark Prisk | Remain | 38.2% | East of England | 50.8% | 49.2% | [21] | ||
| Caithness, Sutherland and Easter Ross | Paul Monaghan | Remain | 11.2% | Scotland | 50.6% | 49.4% | [21] | ||
| Belfast North | Nigel Dodds | Leave | 13.1% | Northern Ireland | 50.4% | 49.6% | |||
| Bridgend | Madeleine Moon | Remain | 4.9% | Wales | 50.4% | 49.6% | [21] | ||
| Loughborough | Nicky Morgan | Remain | 17.7% | East Midlands | 50.4% | 49.6% | [21] | ||
| Bromley and Chislehurst | Bob Neill | Remain | 30.8% | Greater London | 50.2% | 49.8% | [38] | ||
| Colne Valley | Jason McCartney | Leave | 9.5% | Yorkshire and the Humber | 50.2% | 49.8% | [21] | ||
| Milton Keynes North | Mark Lancaster | Remain | 16.9% | South East England | 50.2% | 49.8% | [21] | ||
| Runnymede and Weybridge | Philip Hammond | Remain | 44.2% | South East England | 50.2% | 49.8% | [21] | ||
| Wythenshawe and Sale East | Mike Kane | Remain | 24.4% | North West England | 50.2% | 49.8% | [21] | ||
| Moray | Angus Robertson | Remain | 18.4% | Scotland | 50.1% | 49.9% | |||
| Wallasey | Angela Eagle | Remain | 37.7% | North West England | 50.1% | 49.9% | [36] | ||
| Gower | Byron Davies | Remain | 0.1% | Wales | 49.9% | 50.1% | [21] | ||
| Weaver Vale | Graham Evans | Remain | 1.7% | North West England | 49.9% | 50.1% | [21] | ||
| Liverpool West Derby | Stephen Twigg | Remain | 66.7% | North West England | 49.8% | 50.2% | [21] | ||
| Croydon Central | Gavin Barwell | Remain | 0.3% | Greater London | 49.7% | 50.3% | [23] | ||
| North Wiltshire | James Gray | Leave | 41.6% | South West England | 49.7% | 50.3% | [21] | ||
| Salisbury | John Glen | Remain | 40.3% | South West England | 49.7% | 50.3% | [21] | ||
| East Devon | Hugo Swire | Remain | 22.4% | South West England | 49.6% | 50.4% | [21] | ||
| High Peak | Andrew Bingham | Leave | 9.6% | East Midlands | 49.5% | 50.5% | |||
| Banbury | Victoria Prentis | Remain | 31.7% | South East England | 49.5% | 50.5% | [21] | ||
| Chelmsford | Simon Burns | Remain | 35.9% | East of England | 49.5% | 50.5% | [21] | ||
| Arundel and South Downs | Nick Herbert | Remain | 46.3% | South East England | 49.4% | 50.6% | [21] | ||
| Chichester | Andrew Tyrie | Remain | 42.7% | South East England | 49.4% | 50.6% | [21] | ||
| Southampton Test | Alan Whitehead | Remain | 8.7% | South East England | 49.4% | 50.6% | [21] | ||
| South Antrim | Danny Kinahan | Remain | 2.6% | Northern Ireland | 49.4% | 50.6% | |||
| Warrington South | David Mowat | Remain | 4.6% | North West England | 49.4% | 50.6% | [21] | ||
| Hertsmere | Oliver Dowden | Remain | 36.9% | East of England | 49.2% | 50.8% | |||
| Lancaster and Fleetwood | Cat Smith | Remain | 3.0% | North West England | 49.1% | 50.9% | [21] | ||
| Saffron Walden | Alan Haselhurst | Remain | 43.4% | East of England | 49.1% | 50.9% | [21] | ||
| Somerton and Frome | David Warburton | Leave | 33.6% | South West England | 49.1% | 50.9% | [21] | ||
| West Dorset | Oliver Letwin | Remain | 28.6% | South West England | 49.1% | 50.9% | [21] | ||
| Ynys Môn | Albert Owen | Remain | 0.7% | Wales | 49.1% | 50.9% | |||
| Colchester | Will Quince | Leave | 11.5% | East of England | 49.0% | 51.0% | [21] | ||
| Huddersfield | Barry Sheerman | Remain | 18.1% | Yorkshire and the Humber | 49.0% | 51.0% | [21] | ||
| Central Devon | Mel Stride | Remain | 39.0% | South West England | 48.9% | 51.1% | [21] | ||
| South Norfolk | Richard Bacon | Leave | 35.9% | East of England | 48.9% | 51.1% | [21] | ||
| Stratford-on-Avon | Nadhim Zahawi | Leave | 44.5% | West Midlands | 48.9% | 51.1% | [21] | ||
| Watford | Richard Harrington | Remain | 17.4% | East of England | 48.9% | 51.1% | [21] | ||
| Birmingham Perry Barr | Khalid Mahmood | Remain | 35.9% | West Midlands | 48.8% | 51.2% | [29] | ||
| Derbyshire Dales | Patrick McLoughlin | Remain | 29.7% | East Midlands | 48.8% | 51.2% | [21] | ||
| Sutton and Cheam | Paul Scully | Leave | 7.9% | Greater London | 48.8% | 51.2% | [21] | ||
| Blackley and Broughton | Graham Stringer | Leave | 45.5% | North West England | 48.7% | 51.3% | [21] | ||
| North East Hertfordshire | Oliver Heald | Remain | 36.5% | East of England | 48.7% | 51.3% | [21] | ||
| Belfast East | Gavin Robinson | Leave | 6.5% | Northern Ireland | 48.6% | 51.4% | |||
| Devizes | Claire Perry | Remain | 42.3% | South West England | 48.6% | 51.4% | [21] | ||
| Birmingham Hodge Hill | Liam Byrne | Remain | 56.9% | West Midlands | 48.5% | 51.5% | [29] | ||
| Shipley | Philip Davies | Leave | 19.0% | Yorkshire and the Humber | 48.5% | 51.5% | [23] | ||
| South Swindon | Robert Buckland | Remain | 11.7% | South West England | 48.5% | 51.5% | [21] | ||
| Leicester West | Liz Kendall | Remain | 20.9% | East Midlands | 48.4% | 51.6% | [21] | ||
| Birkenhead | Frank Field | Leave | 52.8% | North West England | 48.3% | 51.7% | [36] | ||
| Brecon and Radnorshire | Christopher Davies | Leave | 12.7% | Wales | 48.3% | 51.7% | [21] | ||
| Sutton Coldfield | Andrew Mitchell | Remain | 32.3% | West Midlands | 48.3% | 51.7% | [29] | ||
| Portsmouth South | Flick Drummond | Remain | 12.5% | South East England | 48.2% | 51.8% | [23] | ||
| Eltham | Clive Efford | Remain | 6.2% | Greater London | 48.2% | 51.8% | [30] | ||
| Bedford | Richard Fuller | Leave | 2.4% | East of England | 48.1% | 51.9% | [23] | ||
| Surrey Heath | Michael Gove | Leave | 45.6% | South East England | 48.1% | 51.9% | [21] | ||
| Aylesbury | David Lidington | Remain | 31.0% | South East England | 47.9% | 52.1% | [21] | ||
| North East Somerset | Jacob Rees-Mogg | Leave | 24.9% | South West England | 47.9% | 52.1% | [21] | ||
| Eddisbury | Antoinette Sandbach | Remain | 27.4% | North West England | 47.8% | 52.2% | [21] | ||
| Harborough | Edward Garnier | Remain | 37.4% | East Midlands | 47.8% | 52.2% | [21] | ||
| Hazel Grove | William Wragg | Leave | 15.2% | North West England | 47.8% | 52.2% | [33] | ||
| Mid Bedfordshire | Nadine Dorries | Leave | 40.2% | East of England | 47.8% | 52.2% | [21] | ||
| Chippenham | Michelle Donelan | Remain | 18.2% | South West England | 47.7% | 52.3% | [21] | ||
| Vale of Glamorgan | Alun Cairns | Remain | 13.4% | Wales | 47.7% | 52.3% | [21] | ||
| Broxtowe | Anna Soubry | Remain | 8.0% | East Midlands | 47.6% | 52.4% | [21] | ||
| Knowsley | George Howarth | Remain | 68.3% | North West England | 47.6% | 52.4% | [21] | ||
| Clwyd West | David Jones | Leave | 17.7% | Wales | 47.5% | 52.5% | [21] | ||
| Ilford North | Wes Streeting | Remain | 1.2% | Greater London | 47.5% | 52.5% | [21] | ||
| Mid Derbyshire | Pauline Latham | Remain | 26.8% | East Midlands | 47.5% | 52.5% | [21] | ||
| Tonbridge and Malling | Tom Tugendhat | Remain | 44.2% | South East England | 47.5% | 52.5% | [21] | ||
| Wealden | Nusrat Ghani | Leave | 40.3% | South East England | 47.5% | 52.5% | [21] | ||
| Welwyn Hatfield | Grant Shapps | Remain | 24.2% | East of England | 47.5% | 52.5% | [21] | ||
| West Worcestershire | Harriett Baldwin | Remain | 41.7% | West Midlands | 47.5% | 52.5% | [21] | ||
| Congleton | Fiona Bruce | Leave | 32.9% | North West England | 47.4% | 52.6% | [21] | ||
| Reading West | Alok Sharma | Remain | 13.7% | South East England | 47.4% | 52.6% | [21] | ||
| South Northamptonshire | Andrea Leadsom | Leave | 43.4% | East Midlands | 47.4% | 52.6% | [21] | ||
| Upper Bann | David Simpson | Leave | 4.8% | Northern Ireland | 47.4% | 52.6% | |||
| Meon Valley | George Hollingbery | Remain | 46.2% | South East England | 47.1% | 52.9% | [21] | ||
| Milton Keynes South | Iain Stewart | Leave | 14.7% | South East England | 47.1% | 52.9% | [21] | ||
| Taunton Deane | Rebecca Pow | Remain | 26.8% | South West England | 47.1% | 52.9% | |||
| Shrewsbury and Atcham | Daniel Kawczynski | Leave | 17.7% | West Midlands | 47.0% | 53.0% | [21] | ||
| Newport West | Paul Flynn | Remain | 8.7% | Wales | 47.0% | 53.0% | [21] | ||
| Skipton and Ripon | Julian Smith | Remain | 38.1% | Yorkshire and the Humber | 47.0% | 53.0% | [21] | ||
| Lagan Valley | Jeffrey Donaldson | Leave | 32.7% | Northern Ireland | 46.9% | 53.1% | |||
| Leicester East | Keith Vaz | Remain | 38.2% | East Midlands | 46.9% | 53.1% | [21] | ||
| Bracknell | Phillip Lee | Remain | 38.9% | South East England | 46.8% | 53.2% | [21] | ||
| Calder Valley | Craig Whittaker | Remain | 8.3% | Yorkshire and the Humber | 46.8% | 53.2% | [23] | ||
| Huntingdon | Jonathan Djanogly | Remain | 34.7% | East of England | 46.8% | 53.2% | [21] | ||
| North East Bedfordshire | Alistair Burt | Remain | 43.7% | East of England | 46.8% | 53.2% | [21] | ||
| Aberconwy | Guto Bebb | Remain | 13.3% | Wales | 46.7% | 53.3% | [21] | ||
| Keighley | Kris Hopkins | Remain | 6.2% | Yorkshire and the Humber | 46.7% | 53.3% | [23] | ||
| Solihull | Julian Knight | Remain | 23.6% | West Midlands | 46.7% | 53.3% | [23] | ||
| Thornbury and Yate | Luke Hall | Remain | 3.1% | South West England | 46.7% | 53.3% | [21] | ||
| Wells | James Heappey | Remain | 13.3% | South West England | 46.6% | 53.4% | [21] | ||
| Bournemouth East | Tobias Ellwood | Remain | 32.6% | South West England | 46.5% | 53.5% | [21] | ||
| Basingstoke | Maria Miller | Remain | 20.8% | South East England | 46.4% | 53.6% | [21] | ||
| Bury North | David Nuttall | Leave | 0.8% | North West England | 46.4% | 53.6% | [21] | ||
| East Worthing and Shoreham | Tim Loughton | Leave | 30.0% | South East England | 46.4% | 53.6% | [21] | ||
| Salford and Eccles | Rebecca Long-Bailey | Remain | 29.0% | North West England | 46.4% | 53.6% | [39] | ||
| Blackburn | Kate Hollern | Remain | 29.0% | North West England | 46.3% | 53.7% | [23] | ||
| Bury St Edmunds | Jo Churchill | Remain | 35.9% | East of England | 46.3% | 53.7% | [21] | ||
| Carmarthen East and Dinefwr | Jonathan Edwards | Remain | 14.2% | Wales | 46.3% | 53.7% | [21] | ||
| Derby North | Amanda Solloway | Remain | 0.1% | East Midlands | 46.3% | 53.7% | [21] | ||
| Tewkesbury | Laurence Robertson | Leave | 39.7% | South West England | 46.3% | 53.7% | [21] | ||
| Worcester | Robin Walker | Remain | 11.4% | West Midlands | 46.3% | 53.7% | [23] | ||
| Liverpool Walton | Steve Rotheram | Remain | 72.3% | North West England | 46.2% | 53.8% | [21] | ||
| Sevenoaks | Michael Fallon | Remain | 39.0% | South East England | 46.2% | 53.8% | [21] | ||
| Rutland and Melton | Alan Duncan | Remain | 39.8% | East Midlands | 46.1% | 53.9% | [21] | ||
| Slough | Fiona Mactaggart | Remain | 15.2% | South East England | 46.1% | 53.9% | |||
| Banff and Buchan | Eilidh Whiteford | Remain | 31.4% | Scotland | 46.0% | 54.0% | [21] | ||
| Broadland | Keith Simpson | Remain | 31.7% | East of England | 46.0% | 54.0% | [21] | ||
| Eastleigh | Mims Davies | Leave | 16.5% | South East England | 46.0% | 54.0% | [21] | ||
| Totnes | Sarah Wollaston | Remain | 38.8% | South West England | 46.0% | 54.0% | [21] | ||
| Wyre and Preston North | Ben Wallace | Remain | 28.4% | North West England | 46.0% | 54.0% | [21] | ||
| East Surrey | Sam Gyimah | Remain | 40.4% | South East England | 45.9% | 54.1% | [21] | ||
| South Suffolk | James Cartlidge | Remain | 33.8% | East of England | 45.9% | 54.1% | [21] | ||
| Neath | Christina Rees | Remain | 25.7% | Wales | 45.8% | 54.2% | [21] | ||
| St Ives | Derek Thomas | Leave | 5.1% | South West England | 45.8% | 54.2% | [37] | ||
| Erith and Thamesmead | Teresa Pearce | Remain | 22.4% | Greater London | 45.7% | 54.3% | [21] | ||
| Central Suffolk and North Ipswich | Dan Poulter | Remain | 37.2% | East of England | 45.6% | 54.4% | [21] | ||
| Plymouth Sutton and Devonport | Oliver Colvile | Remain | 1.1% | South West England | 45.6% | 54.4% | [40] | ||
| Bury South | Ivan Lewis | Remain | 10.4% | North West England | 45.5% | 54.5% | [21] | ||
| North West Hampshire | Kit Malthouse | Leave | 43.4% | South East England | 45.5% | 54.5% | [21] | ||
| Richmond (Yorks) | Rishi Sunak | Leave | 36.2% | Yorkshire and the Humber | 45.4% | 54.6% | [21] | ||
| Wolverhampton South West | Rob Marris | Remain | 2.0% | West Midlands | 45.6% | 54.6% | [41] | ||
| Delyn | David Hanson | Remain | 7.8% | Wales | 45.3% | 54.7% | [21] | ||
| Bootle | Peter Dowd | Remain | 63.6% | North West England | 45.2% | 54.8% | [21] | ||
| Leeds West | Rachel Reeves | Remain | 27.9% | Yorkshire and the Humber | 45.1% | 54.9% | [23] | ||
| North West Durham | Pat Glass | Remain | 23.5% | North East England | 45.1% | 54.9% | [23] | ||
| West Lancashire | Rosie Cooper | Remain | 16.8% | North West England | 45.1% | 54.9% | [21] | ||
| Southend West | David Amess | Leave | 31.5% | East of England | 45.0% | 55.0% | [23] | ||
| Caerphilly | Wayne David | Remain | 25.0% | Wales | 44.9% | 55.1% | [21] | ||
| Hemel Hempstead | Mike Penning | Leave | 29.1% | East of England | 44.9% | 55.1% | [21] | ||
| Bradford East | Imran Hussain | Remain | 17.1% | Yorkshire and the Humber | 44.8% | 55.2% | [23] | ||
| East Antrim | Sammy Wilson | Leave | 17.3% | Northern Ireland | 44.8% | 55.2% | |||
| South West Devon | Gary Streeter | Remain | 39.9% | South West England | 44.8% | 55.2% | [21] | ||
| Carmarthen West and South Pembrokeshire | Simon Hart | Remain | 15.0% | Wales | 44.7% | 55.3% | [21] | ||
| Penrith and The Border | Rory Stewart | Remain | 45.3% | North West England | 44.7% | 55.3% | [21] | ||
| Fareham | Suella Fernandes | Leave | 40.7% | South East England | 44.6% | 55.4% | [21] | ||
| Bromsgrove | Sajid Javid | Remain | 31.6% | West Midlands | 44.6% | 55.4% | |||
| Haltemprice and Howden | David Davis | Leave | 33.2% | Yorkshire and the Humber | 44.6% | 55.4% | [21] | ||
| Llanelli | Nia Griffith | Remain | 18.4% | Wales | 44.6% | 55.4% | [21] | ||
| Luton South | Gavin Shuker | Remain | 13.5% | East of England | 44.6% | 55.4% | [21] | ||
| Berwick-upon-Tweed | Anne-Marie Trevelyan | Leave | 12.2% | North East England | 44.5% | 55.5% | [21] | ||
| Bolton West | Chris Green | Leave | 1.6% | North West England | 44.5% | 55.5% | [21] | ||
| Strangford | Jim Shannon | Leave | 30.0% | Northern Ireland | 44.5% | 55.5% | |||
| Newark | Robert Jenrick | Remain | 35.3% | East Midlands | 44.3% | 55.7% | [21] | ||
| Preseli Pembrokeshire | Stephen Crabb | Remain | 12.3% | Wales | 44.3% | 55.7% | [21] | ||
| New Forest West | Desmond Swayne | Leave | 43.5% | South East England | 44.2% | 55.8% | [21] | ||
| Maidstone and The Weald | Helen Grant | Remain | 21.4% | South East England | 44.2% | 55.8% | [21] | ||
| Suffolk Coastal | Therese Coffey | Remain | 33.9% | East of England | 44.2% | 55.8% | [21] | ||
| Feltham and Heston | Seema Malhotra | Remain | 23.2% | Greater London | 44.1% | 55.9% | [35] | ||
| Montgomeryshire | Glyn Davies | Leave | 15.8% | Wales | 44.1% | 55.9% | [21] | ||
| Vale of Clwyd | James Davies | Leave | 0.7% | Wales | 44.1% | 55.9% | [21] | ||
| Gateshead | Ian Mearns | Remain | 39.0% | North East England | 44.0% | 56.0% | [23] | ||
| Gedling | Vernon Coaker | Remain | 6.2% | East Midlands | 43.9% | 56.1% | [21] | ||
| Newton Abbot | Anne Marie Morris | Leave | 23.4% | South West England | 43.9% | 56.1% | [21] | ||
| St Helens South and Whiston | Marie Rimmer | Remain | 43.9% | North West England | 43.9% | 56.1% | [21] | ||
| Wansbeck | Ian Lavery | Remain | 28.2% | North East England | 43.9% | 56.1% | [21] | ||
| Worthing West | Peter Bottomley | Remain | 33.2% | South East England | 43.9% | 56.1% | [21] | ||
| Hastings and Rye | Amber Rudd | Remain | 9.4% | South East England | 43.8% | 56.2% | [21] | ||
| Blaydon | David Anderson | Remain | 31.7% | North East England | 43.7% | 56.3% | [23] | ||
| Carshalton and Wallington | Tom Brake | Remain | 3.2% | Greater London | 43.7% | 56.3% | [21] | ||
| Elmet and Rothwell | Alec Shelbrooke | Remain | 14.7% | Yorkshire and the Humber | 43.7% | 56.3% | [21] | ||
| Uxbridge and South Ruislip | Boris Johnson | Leave | 23.9% | Greater London | 43.7% | 56.3% | [21] | ||
| North Dorset | Simon Hoare | Remain | 39.6% | South West England | 43.6% | 56.4% | [21] | ||
| Thirsk and Malton | Kevin Hollinrake | Remain | 37.2% | Yorkshire and the Humber | 43.6% | 56.4% | [21] | ||
| Chorley | Lindsay Hoyle | Remain | 8.8% | North West England | 43.5% | 56.5% | [21] | ||
| Fylde | Mark Menzies | Remain | 30.4% | North West England | 43.5% | 56.5% | [21] | ||
| Ipswich | Ben Gummer | Remain | 7.7% | East of England | 43.5% | 56.5% | [21] | ||
| Weston-super-Mare | John Penrose | Remain | 29.7% | South West England | 43.4% | 56.6% | [21] | ||
| Barrow and Furness | John Woodcock | Remain | 1.8% | North West England | 43.3% | 56.7% | [21] | ||
| Kingswood | Chris Skidmore | Remain | 18.7% | South West England | 43.2% | 56.8% | [21] | ||
| Preston | Mark Hendrick | Remain | 36.1% | North West England | 43.2% | 56.8% | [21] | ||
| South Ribble | Seema Kennedy | Remain | 11.4% | North West England | 43.2% | 56.8% | [21] | ||
| Cynon Valley | Ann Clwyd | Remain | 30.9% | Wales | 43.1% | 56.9% | [21] | ||
| North West Cambridgeshire | Shailesh Vara | Remain | 32.4% | East of England | 43.1% | 56.9% | [21] | ||
| Poole | Robert Syms | Leave | 33.3% | South West England | 43.1% | 56.9% | [21] | ||
| North Devon | Peter Heaton-Jones | Remain | 13.3% | South West England | 43.0% | 57.0% | |||
| Torridge and West Devon | Geoffrey Cox | Leave | 32.5% | South West England | 43.0% | 57.0% | [21] | ||
| Newcastle upon Tyne North | Catherine McKinnell | Remain | 22.6% | North East England | 42.9% | 57.1% | [23] | ||
| Stevenage | Stephen McPartland | Leave | 10.4% | East of England | 42.9% | 57.1% | [21] | ||
| Dewsbury | Paula Sherriff | Remain | 2.7% | Yorkshire and the Humber | 42.8% | 57.2% | [23] | ||
| Stafford | Jeremy Lefroy | Remain | 18.8% | West Midlands | 42.8% | 57.2% | [21] | ||
| Lincoln | Karl McCartney | Leave | 3.1% | East Midlands | 42.7% | 57.3% | [21] | ||
| Norwich North | Chloe Smith | Remain | 10.2% | East of England | 42.7% | 57.3% | [21] | ||
| Wrexham | Ian Lucas | Remain | 5.6% | Wales | 42.7% | 57.3% | [21] | ||
| North Swindon | Justin Tomlinson | Leave | 22.6% | South West England | 42.6% | 57.4% | [21] | ||
| Lichfield | Michael Fabricant | Leave | 35.3% | West Midlands | 42.5% | 57.5% | [21] | ||
| Orpington | Jo Johnson | Remain | 40.7% | Greater London | 42.5% | 57.5% | [38] | ||
| Rochdale | Simon Danczuk | Remain | 27.4% | North West England | 42.5% | 57.5% | [23] | ||
| Bexhill and Battle | Huw Merriman | Remain | 36.4% | South East England | 42.4% | 57.6% | [21] | ||
| Eastbourne | Caroline Ansell | Leave | 1.4% | South East England | 42.4% | 57.6% | [21] | ||
| Sheffield Heeley | Louise Haigh | Remain | 30.8% | Yorkshire and the Humber | 42.4% | 57.6% | [23] | ||
| South West Wiltshire | Andrew Murrison | Leave | 35.2% | South West England | 42.4% | 57.6% | [21] | ||
| Tiverton and Honiton | Neil Parish | Remain | 37.5% | South West England | 42.4% | 57.6% | [21] | ||
| Selby and Ainsty | Nigel Adams | Leave | 25.7% | Yorkshire and the Humber | 42.4% | 57.6% | [21] | ||
| Alyn and Deeside | Mark Tami | Remain | 8.1% | Wales | 42.3% | 57.7% | [21] | ||
| Bolton North East | David Crausby | Remain | 10.1% | North West England | 42.3% | 57.7% | [21] | ||
| Ellesmere Port and Neston | Justin Madders | Remain | 13.4% | North West England | 42.3% | 57.7% | [21] | ||
| Bournemouth West | Conor Burns | Leave | 29.7% | South West England | 42.2% | 57.8% | [21] | ||
| Halton | Derek Twigg | Remain | 45.1% | North West England | 42.2% | 57.8% | [21] | ||
| Stockton South | James Wharton | Leave | 9.7% | North East England | 42.2% | 57.8% | [21] | ||
| Mid Dorset and North Poole | Michael Tomlinson | Leave | 22.6% | South West England | 42.1% | 57.9% | [21] | ||
| Darlington | Jenny Chapman | Remain | 7.7% | North East England | 42.0% | 58.0% | [23] | ||
| Forest of Dean | Mark Harper | Remain | 22.2% | South West England | 42.0% | 58.0% | [21] | ||
| Meriden | Caroline Spelman | Remain | 35.7% | West Midlands | 42.0% | 58.0% | [23] | ||
| Stone | Bill Cash | Leave | 34.6% | West Midlands | 42.0% | 58.0% | [21] | ||
| Aldershot | Gerald Howarth | Leave | 32.3% | South East England | 41.8% | 58.2% | [42] | ||
| Charnwood | Ed Argar | Remain | 32.4% | East Midlands | 41.8% | 58.2% | [21] | ||
| Faversham and Mid Kent | Helen Whately | Remain | 36.4% | South East England | 41.8% | 58.2% | [21] | ||
| Luton North | Kelvin Hopkins | Leave | 22.3% | East of England | 41.8% | 58.2% | [21] | ||
| North Herefordshire | Bill Wiggin | Leave | 41.6% | West Midlands | 41.8% | 58.2% | [21] | ||
| North Norfolk | Norman Lamb | Remain | 8.2% | East of England | 41.8% | 58.2% | [21] | ||
| South Leicestershire | Alberto Costa | Remain | 31.2% | East Midlands | 41.8% | 58.2% | [21] | ||
| St Helens North | Conor McGinn | Remain | 37.4% | North West England | 41.8% | 58.2% | [21] | ||
| The Wrekin | Mark Pritchard | Remain | 23.6% | West Midlands | 41.8% | 58.2% | [21] | ||
| Rugby | Mark Pawsey | Remain | 21.1% | West Midlands | 41.7% | 58.3% | [21] | ||
| South East Cornwall | Sheryll Murray | Leave | 33.7% | South West England | 41.7% | 58.3% | [37] | ||
| Crawley | Henry Smith | Leave | 13.4% | South East England | 41.6% | 58.4% | |||
| Merthyr Tydfil and Rhymney | Gerald Jones | Remain | 35.2% | Wales | 41.6% | 58.4% | [21] | ||
| Ludlow | Philip Dunne | Remain | 39.4% | West Midlands | 41.5% | 58.5% | [21] | ||
| Rossendale and Darwen | Jake Berry | Remain | 11.5% | North West England | 41.5% | 58.5% | [21] | ||
| Coventry North West | Geoffrey Robinson | Remain | 10.0% | West Midlands | 41.4% | 58.6% | [21] | ||
| Ribble Valley | Nigel Evans | Leave | 26.0% | North West England | 41.4% | 58.6% | [21] | ||
| South West Bedfordshire | Andrew Selous | Remain | 34.7% | East of England | 41.4% | 58.6% | [21] | ||
| Warrington North | Helen Jones | Remain | 19.6% | North West England | 41.4% | 58.6% | [21] | ||
| Beverley and Holderness | Graham Stuart | Remain | 23.2% | Yorkshire and the Humber | 41.3% | 58.7% | [21] | ||
| Daventry | Chris Heaton-Harris | Leave | 40.1% | East Midlands | 41.3% | 58.7% | [21] | ||
| Halifax | Holly Lynch | Remain | 1.0% | Yorkshire and the Humber | 41.2% | 58.8% | [23] | ||
| Islwyn | Chris Evans | Remain | 29.4% | Wales | 45.3% | 58.8% | [21] | ||
| Gloucester | Richard Graham | Remain | 13.8% | South West England | 41.1% | 58.9% | [23] | ||
| Mid Worcestershire | Nigel Huddleston | Remain | 39.3% | West Midlands | 41.1% | 58.9% | [21] | ||
| Morecambe and Lunesdale | David Morris | Remain | 10.6% | North West England | 41.1% | 58.9% | [21] | ||
| Sedgefield | Phil Wilson | Remain | 17.7% | North East England | 41.1% | 58.9% | [23] | ||
| Crewe and Nantwich | Edward Timpson | Remain | 7.3% | North West England | 41.0% | 59.0% | [21] | ||
| Coventry North East | Colleen Fletcher | Remain | 29.1% | West Midlands | 40.8% | 59.2% | [21] | ||
| Yeovil | Marcus Fysh | Leave | 9.3% | South West England | 40.8% | 59.2% | [21] | ||
| Chesterfield | Toby Perkins | Remain | 29.8% | East Midlands | 40.7% | 59.3% | [21] | ||
| North Tyneside | Mary Glindon | Remain | 36.7% | North East England | 40.7% | 59.3% | [23] | ||
| Stalybridge and Hyde | Jonathan Reynolds | Leave | 16.3% | North West England | 40.7% | 59.3% | [23] | ||
| Hayes and Harlington | John McDonnell | Remain | 34.8% | Greater London | 40.6% | 59.4% | [21] | ||
| North Shropshire | Owen Paterson | Leave | 31.6% | West Midlands | 40.6% | 59.4% | [21] | ||
| South Dorset | Richard Drax | Leave | 24.7% | South West England | 40.6% | 59.4% | [21] | ||
| New Forest East | Julian Lewis | Leave | 38.8% | South East England | 40.5% | 59.5% | [21] | ||
| North Cornwall | Scott Mann | Leave | 13.7% | South West England | 40.5% | 59.5% | [37] | ||
| Ashford | Damian Green | Remain | 33.6% | South East England | 40.5% | 59.5% | [21] | ||
| Northampton South | David Mackintosh | Remain | 9.8% | East Midlands | 40.4% | 59.6% | [21] | ||
| Morley and Outwood | Andrea Jenkyns | Leave | 0.9% | Yorkshire and the Humber | 40.3% | 59.7% | [21] | ||
| Ogmore | Chris Elmore | Remain | 36.4% | Wales | 40.3% | 59.7% | [21] | ||
| Blyth Valley | Ronnie Campbell | Leave | 24.0% | North East England | 40.2% | 59.8% | [21] | ||
| Christchurch | Christopher Chope | Leave | 36.7% | South West England | 40.2% | 59.8% | [21] | ||
| Copeland | Jamie Reed | Remain | 6.5% | North West England | 40.2% | 59.8% | [21] | ||
| Worsley and Eccles South | Barbara Keeley | Remain | 14.1% | North West England | 40.2% | 59.8% | [39] | ||
| Aberavon | Stephen Kinnock | Remain | 33.1% | Wales | 40.1% | 59.9% | [21] | ||
| Kingston upon Hull North | Diana Johnson | Remain | 36.5% | Yorkshire and the Humber | 40.1% | 59.9% | [23] | ||
| Oldham East and Saddleworth | Debbie Abrahams | Remain | 13.5% | North West England | 40.1% | 59.9% | [23] | ||
| Southampton Itchen | Royston Smith | Leave | 5.2% | South East England | 40.1% | 59.9% | [21] | ||
| Sunderland Central | Julie Elliott | Remain | 26.8% | North East England | 40.0% | 60.0% | [23] | ||
| Birmingham Yardley | Jess Phillips | Remain | 16.0% | West Midlands | 39.9% | 60.1% | [29] | ||
| Corby | Tom Pursglove | Leave | 4.3% | East Midlands | 39.9% | 60.1% | [21] | ||
| Hereford and South Herefordshire | Jesse Norman | Remain | 35.7% | West Midlands | 39.9% | 60.1% | [21] | ||
| North Durham | Kevan Jones | Remain | 34.0% | North East England | 39.9% | 60.1% | [23] | ||
| Clwyd South | Susan Jones | Remain | 6.9% | Wales | 39.8% | 60.2% | [21] | ||
| Newport East | Jessica Morden | Remain | 13.4% | Wales | 39.8% | 60.2% | [21] | ||
| Barking | Margaret Hodge | Remain | 35.5% | Greater London | 39.7% | 60.3% | [21] | ||
| Batley and Spen | Vacant | n/a | 81.0% | Yorkshire and the Humber | 39.7% | 60.3% | [23] | ||
| South Derbyshire | Heather Wheeler | Leave | 22.6% | East Midlands | 39.7% | 60.3% | [21] | ||
| Spelthorne | Kwasi Kwarteng | Leave | 28.8% | South East England | 39.7% | 60.3% | |||
| Workington | Sue Hayman | Remain | 12.2% | North West England | 39.7% | 60.3% | [21] | ||
| Carlisle | John Stevenson | Remain | 6.5% | North West England | 39.6% | 60.4% | [21] | ||
| Rochford and Southend East | James Duddridge | Leave | 21.7% | East of England | 39.6% | 60.4% | [21] | ||
| Mid Norfolk | George Freeman | Remain | 33.1% | East of England | 39.5% | 60.5% | [21] | ||
| Bishop Auckland | Helen Goodman | Remain | 8.9% | North East England | 39.4% | 60.6% | [23] | ||
| Northampton North | Michael Ellis | Remain | 8.2% | East Midlands | 39.4% | 60.6% | [21] | ||
| Bosworth | David Tredinnick | Remain | 20.5% | East Midlands | 39.3% | 60.7% | [21] | ||
| North West Leicestershire | Andrew Bridgen | Leave | 22.1% | East Midlands | 39.3% | 60.7% | |||
| Brentwood and Ongar | Eric Pickles | Remain | 42.0% | East of England | 39.2% | 60.8% | [21] | ||
| Torfaen | Nick Thomas-Symonds | Remain | 21.5% | Wales | 39.2% | 60.8% | [21] | ||
| Witham | Priti Patel | Leave | 41.5% | East of England | 39.2% | 60.8% | [21] | ||
| Leeds East | Richard Burgon | Remain | 32.8% | Yorkshire and the Humber | 39.1% | 60.9% | [23] | ||
| Denton and Reddish | Andrew Gwynne | Remain | 27.2% | North West England | 39.0% | 61.0% | [23] | ||
| Epping Forest | Eleanor Laing | Unknown | 36.4% | East of England | 39.0% | 61.0% | [21] | ||
| Grantham and Stamford | Nick Boles | Remain | 35.3% | East Midlands | 39.0% | 61.0% | [21] | ||
| Harwich and North Essex | Bernard Jenkin | Leave | 31.3% | East of England | 39.0% | 61.0% | [21] | ||
| Kettering | Philip Hollobone | Leave | 26.7% | East Midlands | 39.0% | 61.0% | |||
| Rhondda | Chris Bryant | Remain | 23.6% | Wales | 38.8% | 61.2% | [21] | ||
| Maldon | John Whittingdale | Leave | 45.9% | East of England | 38.7% | 61.3% | [21] | ||
| Penistone and Stocksbridge | Angela Smith | Remain | 14.3% | Yorkshire and the Humber | 38.7% | 61.3% | [23] | ||
| Scarborough and Whitby | Robert Goodwill | Remain | 13.0% | Yorkshire and the Humber | 38.7% | 61.3% | [21] | ||
| Braintree | James Cleverly | Leave | 35.0% | East of England | 38.6% | 61.4% | [21] | ||
| Redditch | Karen Lumley | Leave | 16.0% | West Midlands | 38.6% | 61.4% | [21] | ||
| Sheffield Brightside and Hillsborough | Gill Furniss | Remain | 42.5% | Yorkshire and the Humber | 38.6% | 61.4% | [23] | ||
| Sleaford and North Hykeham | Caroline Johnson | Leave | 40.0% | East Midlands | 38.5% | 61.5% | [21] | ||
| Derby South | Margaret Beckett | Remain | 21.6% | East Midlands | 38.4% | 61.6% | [21] | ||
| Jarrow | Stephen Hepburn | Remain | 36.0% | North East England | 38.4% | 61.6% | [23] | ||
| Newcastle-under-Lyme | Paul Farrelly | Remain | 1.5% | West Midlands | 38.4% | 61.6% | [43] | ||
| South Thanet | Craig Mackinlay | Leave | 5.7% | South East England | 38.4% | 61.6% | [21] | ||
| Walsall South | Valerie Vaz | Remain | 14.4% | West Midlands | 38.4% | 61.6% | [43] | ||
| Ashton under Lyne | Angela Rayner | Remain | 27.6% | North West England | 38.2% | 61.8% | [23] | ||
| Birmingham Northfield | Richard Burden | Remain | 5.9% | West Midlands | 38.2% | 61.8% | [29] | ||
| Folkestone and Hythe | Damian Collins | Remain | 25.1% | South East England | 38.2% | 61.8% | [21] | ||
| Warley | John Spellar | Remain | 38.9% | West Midlands | 38.2% | 61.8% | [21] | ||
| Gosport | Caroline Dinenage | Remain | 35.9% | South East England | 38.1% | 61.9% | [21] | ||
| Washington and Sunderland West | Sharon Hodgson | Remain | 35.3% | North East England | 38.1% | 61.9% | [23] | ||
| Isle of Wight | Andrew Turner | Leave | 19.5% | South East England | 38.1% | 61.9% | |||
| Blaenau Gwent | Nick Smith | Remain | 40.1% | Wales | 38.0% | 62.0% | |||
| Gainsborough | Edward Leigh | Leave | 31.4% | East Midlands | 38.0% | 62.0% | [21] | ||
| Swansea East | Carolyn Harris | Remain | 35.8% | Wales | 38.0% | 62.0% | [21] | ||
| Bridgwater and West Somerset | Ian Liddell-Grainger | Leave | 26.8% | South West England | 37.9% | 62.1% | [21] | ||
| North East Derbyshire | Natascha Engel | Remain | 3.9% | East Midlands | 37.9% | 62.1% | [21] | ||
| Oldham West and Royton | Jim McMahon | Remain | 34.2% | North West England | 37.9% | 62.1% | [23] | ||
| Peterborough | Stewart Jackson | Leave | 4.1% | East of England | 37.9% | 62.1% | [44] | ||
| South Shields | Emma Lewell-Buck | Remain | 29.3% | North East England | 37.9% | 62.1% | [45] | ||
| North Antrim | Ian Paisley, Jr. | Leave | 27.6% | Northern Ireland | 37.8% | 62.2% | |||
| Havant | Alan Mak | Remain | 31.1% | South East England | 37.6% | 62.4% | [21] | ||
| Heywood and Middleton | Liz McInnes | Remain | 10.9% | North West England | 37.6% | 62.4% | [23] | ||
| St Austell and Newquay | Steve Double | Leave | 16.2% | South West England | 37.6% | 62.4% | [37] | ||
| Wakefield | Mary Creagh | Remain | 6.1% | Yorkshire and the Humber | 37.4% | 62.6% | [23] | ||
| Houghton and Sunderland South | Bridget Phillipson | Remain | 33.6% | North East England | 37.4% | 62.6% | [23] | ||
| Torbay | Kevin Foster | Remain | 6.8% | South West England | 37.4% | 62.6% | [21] | ||
| Camborne and Redruth | George Eustice | Leave | 15.3% | South West England | 37.3% | 62.7% | [37] | ||
| Wigan | Lisa Nandy | Remain | 31.4% | North West England | 37.3% | 62.7% | [21] | ||
| Wellingborough | Peter Bone | Leave | 32.5% | East Midlands | 37.1% | 62.9% | [21] | ||
| Birmingham Erdington | Jack Dromey | Remain | 14.8% | West Midlands | 37.0% | 63.0% | [29] | ||
| Dover | Charlie Elphicke | Remain | 12.5% | South East England | 36.8% | 63.1% | [21] | ||
| Old Bexley and Sidcup | James Brokenshire | Remain | 33.8% | Greater London | 36.8% | 63.1% | [21] | ||
| Wyre Forest | Mark Garnier | Remain | 26.0% | West Midlands | 36.9% | 63.1% | [23] | ||
| Pendle | Andrew Stephenson | Leave | 12.3% | North West England | 36.8% | 63.2% | |||
| West Suffolk | Matthew Hancock | Unknown | 30.4% | East of England | 36.8% | 63.2% | [21] | ||
| Waveney | Peter Aldous | Remain | 4.6% | East of England | 36.8% | 63.2% | [21] | ||
| East Yorkshire | Greg Knight | Leave | 29.9% | Yorkshire and the Humber | 36.7% | 63.3% | [21] | ||
| Erewash | Maggie Throup | Remain | 7.4% | East Midlands | 36.7% | 63.3% | [21] | ||
| Bolton South East | Yasmin Qureshi | Remain | 26.8% | North West England | 36.6% | 63.4% | [21] | ||
| Leigh | Andy Burnham | Remain | 31.2% | North West England | 36.6% | 63.4% | [21] | ||
| Bradford South | Judith Cummins | Remain | 17.2% | Yorkshire and the Humber | 36.5% | 63.5% | [23] | ||
| Gillingham and Rainham | Rehman Chishti | Leave | 22.4% | South East England | 36.5% | 63.5% | [23] | ||
| Portsmouth North | Penny Mordaunt | Leave | 23.2% | South East England | 36.4% | 63.6% | [23] | ||
| Stourbridge | Margot James | Remain | 14.5% | West Midlands | 36.4% | 63.6% | [23] | ||
| Rochester and Strood | Kelly Tolhurst | Remain | 13.6% | South East England | 36.3% | 63.7% | [23] | ||
| Sherwood | Mark Spencer | Remain | 9.2% | East Midlands | 36.3% | 63.7% | [21] | ||
| Nottingham North | Graham Allen | Remain | 33.6% | East Midlands | 36.2% | 63.8% | [34] | ||
| Dartford | Gareth Johnson | Leave | 23.6% | South East England | 36.0% | 64.0% | [21] | ||
| Bognor Regis and Littlehampton | Nick Gibb | Remain | 29.6% | South East England | 35.8% | 64.2% | [21] | ||
| Staffordshire Moorlands | Karen Bradley | Remain | 23.9% | West Midlands | 35.5% | 64.5% | [21] | ||
| Burton | Andrew Griffiths | Remain | 22.8% | West Midlands | 35.4% | 64.6% | [21] | ||
| Chatham and Aylesford | Tracey Crouch | Unknown | 26.6% | South East England | 35.3% | 64.7% | [21] | ||
| Nuneaton | Marcus Jones | Remain | 10.7% | West Midlands | 35.3% | 64.7% | [21] | ||
| North Thanet | Roger Gale | Remain | 23.3% | South East England | 35.1% | 64.9% | [21] | ||
| Bexleyheath and Crayford | David Evennett | Remain | 21.3% | Greater London | 35.0% | 65.0% | [21] | ||
| Makerfield | Yvonne Fovargue | Remain | 29.4% | North West England | 35.0% | 65.0% | [21] | ||
| Middlesbrough South and East Cleveland | Tom Blenkinsop | Remain | 5.0% | North East England | 35.0% | 65.0% | [23] | ||
| Stoke-on-Trent Central | Tristram Hunt | Remain | 12.4% | West Midlands | 35.0% | 65.0% | [43] | ||
| South Staffordshire | Gavin Williamson | Remain | 41.1% | West Midlands | 34.8% | 65.2% | [23] | ||
| Amber Valley | Nigel Mills | Leave | 9.2% | East Midlands | 34.7% | 65.3% | [21] | ||
| Gravesham | Adam Holloway | Leave | 16.7% | South East England | 34.6% | 65.4% | |||
| Hyndburn | Graham Jones | Remain | 10.3% | North West England | 34.3% | 65.7% | [21] | ||
| Sittingbourne and Sheppey | Gordon Henderson | Leave | 24.6% | South East England | 34.3% | 65.7% | [21] | ||
| Broxbourne | Charles Walker | Leave | 36.3% | East of England | 34.2% | 65.8% | [21] | ||
| Middlesbrough | Andy McDonald | Remain | 38.1% | North East England | 34.0% | 66.0% | [23] | ||
| Tamworth | Christopher Pincher | Leave | 24.0% | West Midlands | 34.0% | 66.0% | [21] | ||
| North West Norfolk | Henry Bellingham | Leave | 29.4% | East of England | 33.9% | 66.1% | [21] | ||
| Brigg and Goole | Andrew Percy | Leave | 25.8% | Yorkshire and the Humber | 33.8% | 66.2% | [21] | ||
| South West Norfolk | Elizabeth Truss | Remain | 27.7% | East of England | 33.8% | 66.2% | [21] | ||
| Doncaster Central | Rosie Winterton | Remain | 25.0% | Yorkshire and the Humber | 33.7% | 66.3% | [23] | ||
| Halesowen and Rowley Regis | James Morris | Remain | 7.0% | West Midlands | 33.7% | 66.3% | [21] | ||
| Plymouth Moor View | Johnny Mercer | Remain | 2.4% | South West England | 33.6% | 66.4% | [40] | ||
| Sheffield South East | Clive Betts | Remain | 29.5% | Yorkshire and the Humber | 33.6% | 66.4% | [23] | ||
| Easington | Grahame Morris | Remain | 42.3% | North East England | 33.5% | 66.5% | [23] | ||
| Stockton North | Alex Cunningham | Remain | 21.1% | North East England | 33.5% | 66.5% | [23] | ||
| Burnley | Julie Cooper | Remain | 8.2% | North West England | 33.4% | 66.6% | |||
| Rother Valley | Kevin Barron | Remain | 15.5% | Yorkshire and the Humber | 33.3% | 66.7% | [23] | ||
| Blackpool North and Cleveleys | Paul Maynard | Leave | 8.5% | North West England | 33.2% | 66.8% | [21] | ||
| Basildon and Billericay | John Baron | Leave | 29.0% | East of England | 33.1% | 66.9% | [21] | ||
| Telford | Lucy Allan | Leave | 1.8% | West Midlands | 33.0% | 67.0% | [21] | ||
| Redcar | Anna Turley | Remain | 25.4% | North East England | 32.5% | 67.5% | [23] | ||
| West Bromwich East | Tom Watson | Remain | 25.3% | West Midlands | 32.5% | 67.5% | [21] | ||
| North Warwickshire | Craig Tracey | Leave | 6.3% | West Midlands | 32.3% | 67.7% | [21] | ||
| Wolverhampton North East | Emma Reynolds | Remain | 16.2% | West Midlands | 32.3% | 67.7% | [41] | ||
| Aldridge-Brownhills | Wendy Morton | Remain | 29.7% | West Midlands | 32.2% | 67.8% | [43] | ||
| Blackpool South | Gordon Marsden | Remain | 8.0% | North West England | 32.2% | 67.8% | [21] | ||
| Kingston upon Hull West and Hessle | Alan Johnson | Remain | 29.3% | Yorkshire and the Humber | 32.2% | 67.8% | [23] | ||
| Rayleigh and Wickford | Mark Francois | Leave | 32.4% | East of England | 32.2% | 67.8% | [21] | ||
| Harlow | Robert Halfon | Remain | 18.9% | East of England | 32.0% | 68.0% | [21] | ||
| Hemsworth | Jon Trickett | Remain | 28.5% | Yorkshire and the Humber | 31.9% | 68.1% | [23] | ||
| Wolverhampton South East | Pat McFadden | Remain | 31.0% | West Midlands | 31.8% | 68.2% | [41] | ||
| Barnsley Central | Dan Jarvis | Remain | 34.0% | Yorkshire and the Humber | 31.7% | 68.3% | [23] | ||
| Bassetlaw | John Mann | Leave | 17.9% | East Midlands | 31.7% | 68.3% | [21] | ||
| Rotherham | Sarah Champion | Remain | 22.3% | Yorkshire and the Humber | 31.7% | 68.3% | [23] | ||
| Cleethorpes | Martin Vickers | Leave | 17.5% | Yorkshire and the Humber | 31.6% | 68.4% | [21] | ||
| Don Valley | Caroline Flint | Remain | 20.9% | Yorkshire and the Humber | 31.5% | 68.5% | [23] | ||
| Cannock Chase | Amanda Milling | Remain | 10.5% | West Midlands | 31.1% | 68.9% | [23] | ||
| Wentworth and Dearne | John Healey | Remain | 32.0% | Yorkshire and the Humber | 31.1% | 68.9% | [23] | ||
| Scunthorpe | Nic Dakin | Remain | 8.5% | Yorkshire and the Humber | 31.0% | 69.0% | [23] | ||
| West Bromwich West | Adrian Bailey | Remain | 22.1% | West Midlands | 30.9% | 69.1% | [21] | ||
| Romford | Andrew Rosindell | Leave | 28.2% | Greater London | 30.8% | 69.2% | [23] | ||
| Normanton, Pontefract and Castleford | Yvette Cooper | Remain | 33.6% | Yorkshire and the Humber | 30.7% | 69.3% | [23] | ||
| Hornchurch and Upminster | Angela Watkinson | Remain | 23.7% | Greater London | 30.6% | 69.4% | [23] | ||
| Louth and Horncastle | Victoria Atkins | Remain | 29.8% | East Midlands | 30.6% | 69.4% | [21] | ||
| North East Cambridgeshire | Stephen Barclay | Leave | 32.6% | East of England | 30.6% | 69.4% | [21] | ||
| Hartlepool | Iain Wright | Remain | 7.7% | North East England | 30.4% | 69.6% | |||
| Dagenham and Rainham | Jon Cruddas | Remain | 11.6% | Greater London | 30.1% | 69.9% | [21] | ||
| Clacton | Douglas Carswell | Leave | 7.8% | East of England | 30.0% | 70.0% | [21] | ||
| Bolsover | Dennis Skinner | Leave | 26.8% | East Midlands | 29.8% | 70.2% | [21] | ||
| Thurrock | Jackie Doyle-Price | Remain | 1.1% | East of England | 29.8% | 70.2% | [21] | ||
| Dudley South | Mike Wood | Leave | 11.2% | West Midlands | 29.6% | 70.4% | [23] | ||
| Ashfield | Gloria De Piero | Remain | 18.6% | East Midlands | 29.5% | 70.5% | [21] | ||
| Barnsley East | Michael Dugher | Remain | 31.2% | Yorkshire and the Humber | 29.3% | 70.7% | [23] | ||
| Stoke-on-Trent South | Robert Flello | Remain | 6.5% | West Midlands | 29.2% | 70.8% | [43] | ||
| Mansfield | Alan Meale | Remain | 11.3% | East Midlands | 29.1% | 70.9% | [23] | ||
| South Holland and the Deepings | John Hayes | Leave | 37.7% | East Midlands | 28.9% | 71.1% | [21] | ||
| Dudley North | Ian Austin | Remain | 11.0% | West Midlands | 28.6% | 71.4% | [23] | ||
| Great Grimsby | Melanie Onn | Remain | 13.5% | Yorkshire and the Humber | 28.6% | 71.4% | [23] | ||
| Great Yarmouth | Brandon Lewis | Remain | 13.8% | East of England | 28.5% | 71.5% | |||
| Doncaster North | Ed Miliband | Remain | 29.8% | Yorkshire and the Humber | 28.0% | 72.0% | [23] | ||
| Stoke-on-Trent North | Ruth Smeeth | Remain | 12.5% | West Midlands | 27.9% | 72.1% | [43] | ||
| Kingston upon Hull East | Karl Turner | Remain | 29.4% | Yorkshire and the Humber | 27.4% | 72.6% | [23] | ||
| Castle Point | Rebecca Harris | Leave | 19.7% | East of England | 27.3% | 72.7% | |||
| South Basildon and East Thurrock | Stephen Metcalfe | Leave | 16.9% | East of England | 27.0% | 73.0% | [21] | ||
| Walsall North | David Winnick | Remain | 5.2% | West Midlands | 25.8% | 74.2% | [43] | ||
| Boston and Skegness | Matt Warman | Remain | 10.0% | East Midlands | 25.1% | 74.9% | [21] | ||
Most Leave areas
The following were the ten voting areas that voted most heavily in favour of leave. All but one of them were in the East Midlands and East of England regions with four voting areas out of the top ten including both the top two located in Lincolnshire.
| Ranking | Voting Area | Voter turnout, of eligible |
Votes | Proportion of votes | Region | ||
|---|---|---|---|---|---|---|---|
| Remain | Leave | Remain | Leave | ||||
| 1 | Boston | 77.2% | 7,430 | 22,974 | 24.4% | 75.6% | East Midlands |
| 2 | South Holland | 75.3% | 13,074 | 36,423 | 26.4% | 73.6% | East Midlands |
| 3 | Castle Point | 75.3% | 14,154 | 37,691 | 27.3% | 72.7% | East of England |
| 4 | Thurrock | 72.7% | 22,151 | 57,765 | 27.7% | 72.3% | East of England |
| 5 | Great Yarmouth | 69.0% | 14,284 | 35,844 | 28.5% | 71.5% | East of England |
| 6 | Fenland | 73.7% | 15,055 | 37,571 | 28.6% | 71.4% | East of England |
| 7 | Mansfield | 72.6% | 16,417 | 39,927 | 29.1% | 70.9% | East Midlands |
| 8 | Bolsover | 72.3% | 12,242 | 29,730 | 29.2% | 70.8% | East Midlands |
| 9 | East Lindsey | 74.9% | 23,515 | 56,613 | 29.3% | 70.7% | East Midlands |
| 10 | North East Lincolnshire | 67.9% | 23,797 | 55,185 | 30.1% | 69.9% | Yorkshire and the Humber |
Most Remain areas
The following were the ten voting areas that voted most heavily in favour of remain. Of the ten, seven were in the Greater London region.
| Ranking | Voting Area | Voter turnout, of eligible |
Votes | Proportion of votes | Region | ||
|---|---|---|---|---|---|---|---|
| Remain | Leave | Remain | Leave | ||||
| 1 | Gibraltar | 83.5% | 19,322 | 823 | 95.9% | 4.1% | South West England |
| 2 | Lambeth | 67.3% | 111,584 | 30,340 | 78.6% | 21.4% | Greater London |
| 3 | Hackney | 65.1% | 83,398 | 22,868 | 78.5% | 21.5% | Greater London |
| 4 | Foyle | 57.4% | 32,064 | 8,905 | 78.3% | 21.7% | Northern Ireland |
| 5 | Haringey | 70.5% | 79,991 | 25,855 | 75.6% | 24.4% | Greater London |
| 6 | City of London | 73.5% | 3,312 | 1,087 | 75.3% | 24.7% | Greater London |
| 7 | Islington | 70.3% | 76,420 | 25,180 | 75.2% | 24.8% | Greater London |
| 8 | Wandsworth | 71.9% | 118,463 | 39,421 | 75.0% | 25.0% | Greater London |
| 9 | Camden | 65.4% | 71,295 | 23,838 | 74.9% | 25.1% | Greater London |
| 10 | City of Edinburgh | 72.9% | 187,796 | 64,498 | 74.4% | 25.6% | Scotland |
Most evenly divided areas
The narrowest margin of victory for any of the 382 voting areas in the United Kingdom was in the Scottish council area of Moray which voted by just 122 votes or 0.25% margin in favour of Remain.
In England the narrowest margin of victory for Leave was in Watford which voted by just 252 votes or 0.54% margin in favour of Leave, and in Cherwell which also voted by just 500 votes or 0.61% margin in favour of Leave. The narrowest margin of victory for Remain was in the London Borough of Bromley which voted by just 2,364 votes or a 1.30% margin in favour of Remain.
Narrowest Leave vote
| Voting Area | Voter turnout, of eligible |
Votes | Proportion of votes | Region | Majority | ||
|---|---|---|---|---|---|---|---|
| Remain | Leave | Remain | Leave | ||||
| Watford | 71.6% | 23,167 | 23,419 | 49.7% | 50.3% | East of England | 252 |
Narrowest Remain vote
| Voting Area | Voter turnout, of eligible |
Votes | Proportion of votes | Region | Majority | ||
|---|---|---|---|---|---|---|---|
| Remain | Leave | Remain | Leave | ||||
| Moray | 67.4% | 24,114 | 23,992 | 50.1% | 49.9% | Scotland | 122 |
Turnout by age group
After the referendum, the annual British Social Attitudes survey questioned the public on their participation. Interviewing was mainly carried out between July and October 2016 and respondents were subdivided into three age groups (18-34, 35-64 and >65).[46] The survey revealed that turnout was higher in the older age groups, and was 64%, 80% and 89% respectively. The age disparity had also been a feature of previous elections and referenda. However, compared to the previous referendum in 2011, the young voters' turnout in 2016 had increased sharply by 31%, while turnout by the two older age categories had also increased, but only by 26% and 21%.
Irregularities
In July 2018, Vote Leave was found to have broken electoral law, spending over its limit, by the UK Electoral Commission.[4] Connected to this, the Information Commissioner's Office found that data had been unlawfully harvested from UK voters, and issued a notice of intent to fine Facebook £500,000.[5] Also, the House of Commons Culture, Media and Sport Select Committee, released an interim report on 'Disinformation and ‘fake news’', stating that Russia had engaged in "unconventional warfare" through Twitter and other social media against the United Kingdom, designed to amplify support for a "leave" vote in Brexit. It also found that it could not be satisfied that the largest donor in the Brexit campaign, Arron Banks, used money from UK sources, and may have been financed by the Russian government.[47] This has led to litigation to declare the result is void.[7] Kyle Taylor of the Fair Vote Project, a second campaign group which is calling for a public inquiry and supports a second referendum stated: “The issue is too big to have half the country or more than half the country, wonder ‘was that actually the result? Is this the future the country wants?’ That’s first and foremost, let’s be certain, everybody play by the rules.” Taylor maintains further, “on the basis of fairness, it has to be the same vote posed in the same way”.[48]
See also
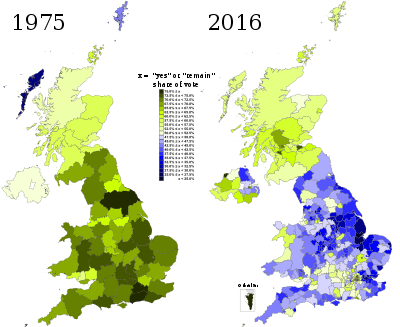
- European Union Referendum Act 2015
- European Communities Act 1972 (UK)
- United Kingdom European Communities membership referendum, 1975
- Results of the United Kingdom European Communities membership referendum, 1975
- Referendum Act 1975
- European Union (Amendment) Act 2008
- European Union Act 2011
- United Kingdom renegotiation of European Union membership, 2015-16
- European Union (Notification of Withdrawal) Act 2017
- European Union (Withdrawal) Act 2018
Notes
- ↑ Vote totals for Belfast are based on the returns from the four parliamentary constituencies in Belfast. These include areas in districts outside the City of Belfast
References
- ↑ "European Union Referendum Bill (HC Bill 2)". Publications.parliament.uk. 28 May 2015. Retrieved 12 June 2015.
- ↑ Rowena Mason; Nicholas Watt; Ian Traynor; Jennifer Rankin (20 February 2016). "EU referendum to take place on 23 June, David Cameron confirms | Politics". The Guardian. Retrieved 2 February 2016.
- 1 2 3 4 5 6 European Referendum Act 2015 Section 11.
- 1 2 Electoral Commission, 'Report of an investigation' (July 2018)
- 1 2 Information Commissioner’s Office, 'Investigation into the use of data analytics in political campaigns: Investigation Update' (10 July 2018)
- ↑ House of Commons Culture, Media and Sport Select Committee, 'Disinformation and ‘fake news’: Interim Report' (July 2018) ch 5, Russian influence in political campaigns.
- 1 2 'Grounds for Judicial Review' in Wilson v Prime Minister (2018). See further, E McGaughey, 'Could Brexit be void? (2018) SSRN, also summarised on 'Verfassungsblog
- ↑ "Political Parties, Elections and Referendums Act 2000, s. 128(2)". Legislation.gov.uk. Retrieved 6 July 2016.
- ↑ EU referendum results Electoral Commission
- ↑ "EU referendum: Brexit win amid Manchester's strong Remain vote – BBC News".
- ↑ "PressReader.com - Connecting People Through News".
- ↑ "Revised estimates of Leave vote share in Westminster constituencies". 18 August 2016.
- ↑ "PressReader.com - Connecting People Through News".
- 1 2 Rosenbaum, Martin (6 February 2017). "Local voting figures shed new light on EU referendum" – via www.bbc.co.uk.
- ↑ "Curtice: New EU voting data suggests economic argument crucial to indyref 2".
- ↑ Ley, Shaun (18 August 2016). "The dilemma facing Scotland's Eurosceptic nationalists" – via www.bbc.co.uk.
- ↑ Brooks, Libby (7 July 2016). "Scottish Brexit voters pose quandary for independence campaign" – via The Guardian.
- ↑ "Revised estimates of leave vote in Westminster constituencies". Retrieved 26 October 2016.
- 1 2 https://moderngov.lambeth.gov.uk/documents/s82579/EUREFResultsforLambeth.pdf?platform=hootsuite
- 1 2 3 4 "South West EU Referendum results - bristol.gov.uk". Retrieved 25 September 2016.
- 1 2 3 4 5 6 7 8 9 10 11 12 13 14 15 16 17 18 19 20 21 22 23 24 25 26 27 28 29 30 31 32 33 34 35 36 37 38 39 40 41 42 43 44 45 46 47 48 49 50 51 52 53 54 55 56 57 58 59 60 61 62 63 64 65 66 67 68 69 70 71 72 73 74 75 76 77 78 79 80 81 82 83 84 85 86 87 88 89 90 91 92 93 94 95 96 97 98 99 100 101 102 103 104 105 106 107 108 109 110 111 112 113 114 115 116 117 118 119 120 121 122 123 124 125 126 127 128 129 130 131 132 133 134 135 136 137 138 139 140 141 142 143 144 145 146 147 148 149 150 151 152 153 154 155 156 157 158 159 160 161 162 163 164 165 166 167 168 169 170 171 172 173 174 175 176 177 178 179 180 181 182 183 184 185 186 187 188 189 190 191 192 193 194 195 196 197 198 199 200 201 202 203 204 205 206 207 208 209 210 211 212 213 214 215 216 217 218 219 220 221 222 223 224 225 226 227 228 229 230 231 232 233 234 235 236 237 238 239 240 241 242 243 244 245 246 247 248 249 250 251 252 253 254 255 256 257 258 259 260 261 262 263 264 265 266 267 268 269 270 271 272 273 274 275 276 277 278 279 280 281 282 283 284 285 286 287 288 289 290 291 292 293 294 295 296 297 298 299 300 301 302 303 304 305 306 307 308 309 310 311 312 313 314 315 316 317 318 319 320 321 322 323 324 325 326 327 328 329 330 331 332 333 334 335 336 337 338 339 340 341 342 343 344 345 346 347 348 349 350 351 352 353 354 355 356 357 358 359 360 361 362 363 364 365 366 367 368 369 370 371 372 373 374 375 376 377 378 379 380 381 382 383 384 385 386 387 388 389 390 391 392 393 394 395 396 397 398 399 400 401 402 403 404 405 406 407 408 409 410 411 412 413 414 415 416 417 418 419 420 421 422 423 424 425 426 427 428 429 430 431 "Ward level results from the EU referendum". Medium. Retrieved 22 February 2017.
- 1 2 3 4 5 6 7 Glasgow Young Scot, 20 Trongate (23 June 2016). "European Referendum 2016 Glasgow Results". Retrieved 25 September 2016.
- 1 2 3 4 5 6 7 8 9 10 11 12 13 14 15 16 17 18 19 20 21 22 23 24 25 26 27 28 29 30 31 32 33 34 35 36 37 38 39 40 41 42 43 44 45 46 47 48 49 50 51 52 53 54 55 56 57 58 59 60 61 62 63 64 65 66 67 68 69 70 71 72 73 74 75 76 77 78 79 80 81 82 83 84 85 86 87 88 89 90 91 92 93 "Local voting figures shed new light on EU referendum". BBC. Retrieved 20 February 2017.
- 1 2 3 4 5 Goudie, Katie. "European Union Referendum Results".
- ↑ https://www.cambridge.gov.uk/sites/default/files/cambridge_turnout_totals_-_june_2016.pdf
- ↑ "LONDON BOROUGH OF CAMDEN Count Total sheet". camden.gov.uk/. Retrieved 2 October 2016.
- 1 2 3 Rivers, David (1 July 2016). "Three wards from 23 voted for BREXIT in Ealing - here's where". Retrieved 25 September 2016.
- 1 2 lmaughan. "EU Referendum 2016 - Waltham Forest Council".
- 1 2 3 4 5 6 7 8 9 10 Council, Birmingham City. "EU Referendum Results 2016 by Constituency and Ward - Birmingham City Council". Retrieved 25 September 2016.
- 1 2 Roberts, Alicia. "EU referendum 2016 results". Retrieved 25 September 2016.
- ↑ Council, Norwich City. "EU Referendum - Norwich City Council". Retrieved 25 September 2016.
- 1 2
- 1 2 3 http://www.stockport.gov.uk/2013/2986/59933/1244950/eureferendum-results2016
- 1 2 3 "How did your area of Nottingham vote in the EU referendum?". 29 June 2016. Retrieved 25 September 2016.
- 1 2 "Archived copy" (PDF). Archived from the original (PDF) on 4 January 2017. Retrieved 15 September 2016.
- 1 2 3 4 "Detailed breakdown of how Wirral voted in Referendum: 'The poorer the area, the bigger its Leave vote'". Retrieved 25 September 2016.
- 1 2 3 4 5 6 "How did your part of Cornwall vote in last week's Brexit referendum?". 28 June 2016. Retrieved 25 September 2016.
- 1 2 3 "Stage 2.Form B Summary Final.xlsx". Retrieved 25 September 2016.
- 1 2 "Election results • Salford City Council". Retrieved 25 September 2016.
- 1 2 "How each Plymouth neighbourhood voted in the EU referendum". 24 June 2016. Retrieved 25 September 2016.
- 1 2 3 "EU Referendum: June 2016 Ward Breakdown of Result".
- ↑ "EU Referendum - 23 June 2016".
- 1 2 3 4 5 6 7 WMBC (20 June 2005). "Elections and voting".
- ↑ "Peterborough ward results: How did your neighbourhood vote?". peterboroughtoday.co.uk. Retrieved 12 October 2016.
- ↑ "Ward Breakdown of the EU referendum results 2016 - a Freedom of Information request to South Tyneside Metropolitan Borough Council". 29 June 2016. Retrieved 25 September 2016.
- ↑ "British Social Attitudes 34. Chapter: The Vote to Leave the EU" (PDF). NatCen Social Research. 2017. Retrieved 24 July 2017.
- ↑ House of Commons Culture, Media and Sport Select Committee, 'Disinformation and ‘fake news’: Interim Report' (July 2018) (July 2018) ch 5, Russian influence in political campaigns.
- ↑ “We need to take back control”: Brexit whistleblower Shahmir Sanni on why there must be a new EU referendum New Statesman
| General elections |
|
|---|---|
| Local elections |
|
| European elections | |
| Referendums | |