Newport West (UK Parliament constituency)
Coordinates: 51°34′59″N 3°02′35″W / 51.583°N 3.043°W
| Newport West | |
|---|---|
|
County constituency for the House of Commons | |
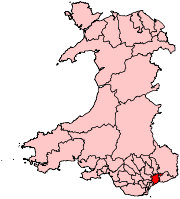 Boundary of Newport West in Wales. | |
| Electorate | 63,056 (December 2010)[1] |
| Current constituency | |
| Created | 1983 |
| Member of parliament | Paul Flynn (Labour) |
| Number of members | One |
| Created from | Newport and Monmouth[2] |
| Overlaps | |
| Welsh Assembly | South Wales East |
| European Parliament constituency | Wales |
Newport West (Welsh: Gorllewin Casnewydd) is a parliamentary constituency represented in the House of Commons of the Parliament of the United Kingdom. It elects one Member of Parliament (MP) using the first-past-the-post voting system. The current MP is Paul Flynn of the Labour Party, first elected at the 1987 general election.
Boundaries
The constituency comprises the electoral divisions of Allt-yr-yn, Bettws, Caerleon, Gaer, Graig, Malpas, Marshfield, Pillgwenlly, Rogerstone, Shaftesbury, Stow Hill and Tredegar Park in the city of Newport. The western and northern boundaries are formed by the city boundary, the eastern boundary by the River Usk, and the southern boundary by the Bristol Channel.
History
Newport West was created when the former Newport constituency was split into two seats in 1983.
Members of Parliament
| Election | Member[3] | Party | |
|---|---|---|---|
| 1983 | Mark Robinson | Conservative | |
| 1987 | Paul Flynn | Labour | |
Elections
Elections in the 2010s
| Party | Candidate | Votes | % | ± | |
|---|---|---|---|---|---|
| Labour | Paul Flynn[4] | 22,723 | 52.3 | +11.1 | |
| Conservative | Angela Jones-Evans[5][4] | 17,065 | 39.3 | +6.8 | |
| UKIP | Stan Edwards | 1,100 | 2.5 | -12.7 | |
| Plaid Cymru | Morgan Bowler-Brown [4] | 1,077 | 2.5 | -1.5 | |
| Liberal Democrat | Sarah Lockyer | 976 | 2.2 | -1.7 | |
| Green | Pippa Bartolotti[6] | 497 | 1.1 | -2.0 | |
| Majority | 5,658 | 13.0 | +4.3 | ||
| Turnout | 43,438 | 67.5 | +2.6 | ||
| Registered electors | 64,399 | ||||
| Labour hold | Swing | +2.2 | |||
| Party | Candidate | Votes | % | ± | |
|---|---|---|---|---|---|
| Labour | Paul Flynn[8] | 16,633 | 41.2 | -0.1 | |
| Conservative | Nick Webb | 13,123 | 32.5 | +0.2 | |
| UKIP | Gordon Norrie | 6,134 | 15.2 | +12.3 | |
| Plaid Cymru | Simon Coopey[9] | 1,604 | 4.0 | +1.2 | |
| Liberal Democrat | Ed Townsend | 1,581 | 3.9 | -12.7 | |
| Green | Pippa Bartolotti | 1,272 | 3.2 | +2.1 | |
| Majority | 3,510 | 8.7 | -0.2 | ||
| Turnout | 40,347 | 64.9 | +0.1 | ||
| Registered electors | 62,137 | ||||
| Labour hold | Swing | -0.1 | |||
| Party | Candidate | Votes | % | ± | |
|---|---|---|---|---|---|
| Labour | Paul Flynn | 16,389 | 41.3 | -3.6 | |
| Conservative | Matthew Williams | 12,845 | 32.3 | +2.8 | |
| Liberal Democrat | Veronica German | 6,587 | 16.6 | -1.3 | |
| BNP | Timothy Windsor | 1,183 | 3.0 | N/A | |
| UKIP | Hugh Hughes | 1,144 | 2.9 | +0.5 | |
| Plaid Cymru | Jeff Rees | 1,122 | 2.8 | -0.8 | |
| Green | Pippa Bartolotti | 450 | 1.1 | -0.4 | |
| Majority | 3,544 | 8.9 | -6.4 | ||
| Turnout | 39,720 | 64.8 | +5.5 | ||
| Registered electors | 62,111 | ||||
| Labour hold | Swing | -3.2 | |||
Elections in the 2000s
| Party | Candidate | Votes | % | ± | |
|---|---|---|---|---|---|
| Labour | Paul Flynn | 16,021 | 44.8 | -7.9 | |
| Conservative | William Morgan | 10,563 | 29.6 | +3.4 | |
| Liberal Democrat | Nigel Flanagan | 6,398 | 17.9 | +6.2 | |
| Plaid Cymru | Anthony Salkeld | 1,278 | 3.6 | -3.6 | |
| UKIP | Hugh Hughes | 848 | 2.4 | +1.0 | |
| Green | Peter Varley | 540 | 1.5 | N/A | |
| Independent | Saeid Arjomand | 84 | 0.2 | +0.2 | |
| Majority | 5,458 | 15.3 | -11.2 | ||
| Turnout | 35,732 | 59.3 | +0.2 | ||
| Registered electors | 60,303 | ||||
| Labour hold | Swing | -5.6 | |||
| Party | Candidate | Votes | % | ± | |
|---|---|---|---|---|---|
| Labour | Paul Flynn | 18,489 | 52.7 | -7.8 | |
| Conservative | William Morgan | 9,185 | 26.2 | +1.8 | |
| Liberal Democrat | Veronica Watkins | 4,095 | 11.7 | +2.0 | |
| Plaid Cymru | Anthony Salkeld | 2,510 | 7.2 | +5.5 | |
| UKIP | Hugh Hughes | 506 | 1.4 | +0.6 | |
| BNP | Terrance Cavill | 278 | 0.8 | N/A | |
| Majority | 9,304 | 26.5 | -9.6 | ||
| Turnout | 35,063 | 59.1 | -15.5 | ||
| Registered electors | 59,345 | ||||
| Labour hold | Swing | -4.8 | |||
Elections in the 1990s
| Party | Candidate | Votes | % | ± | |
|---|---|---|---|---|---|
| Labour | Paul Flynn | 24,331 | 60.5 | +7.4 | |
| Conservative | Peter Clarke | 9,794 | 24.4 | -11.6 | |
| Liberal Democrat | Stanley Wilson | 3,907 | 9.7 | +0.2 | |
| Referendum | Andrew Thompsett | 1,199 | 3.0 | N/A | |
| Plaid Cymru | Huw Jackson | 648 | 1.6 | +0.2 | |
| UKIP | Hugh Hughes | 323 | 0.6 | N/A | |
| Majority | 14,357 | 36.1 | +18.4 | ||
| Turnout | 40,202 | 74.6 | -8.2 | ||
| Registered electors | 53,914 | ||||
| Labour hold | Swing | +9.5 | |||
| Party | Candidate | Votes | % | ± | |
|---|---|---|---|---|---|
| Labour | Paul Flynn | 24,139 | 53.1 | +7.0 | |
| Conservative | Andrew Taylor | 16,360 | 36.0 | -4.1 | |
| Liberal Democrat | John Toye | 3,907 | 9.5 | -3.5 | |
| Plaid Cymru (Green) | Peter Keelan | 653 | 1.4 | +0.6 | |
| Majority | 7,770 | 17.1 | +11.0 | ||
| Turnout | 45,059 | 82.8 | +1.0 | ||
| Registered electors | 54,871 | ||||
| Labour hold | Swing | +5.6 | |||
Elections in the 1980s
| Party | Candidate | Votes | % | ± | |
|---|---|---|---|---|---|
| Labour | Paul Flynn | 20,887 | 46.1 | +9.5 | |
| Conservative | Mark Noel Foster Robinson | 18,179 | 40.1 | +2.1 | |
| Liberal | Winston Roddick | 5,903 | 13.0 | -11.2 | |
| Plaid Cymru | Digby Bevan | 377 | 0.8 | -0.4 | |
| Majority | 2,708 | 6.0 | N/A | ||
| Turnout | 45,346 | 81.8 | +4.3 | ||
| Registered electors | 55,455 | ||||
| Labour gain from Conservative | Swing | +3.7 | |||
| Party | Candidate | Votes | % | ± | |
|---|---|---|---|---|---|
| Conservative | Mark Noel Foster Robinson | 15,948 | 38.0 | N/A | |
| Labour | Bryan Davies | 15,367 | 36.6 | N/A | |
| Liberal | Whitney Jones | 10,163 | 24.2 | N/A | |
| Plaid Cymru | Denis Watkins | 477 | 1.2 | N/A | |
| Majority | 581 | 1.4 | N/A | ||
| Turnout | 41,955 | 77.5 | N/A | ||
| Registered electors | 54,125 | ||||
| Conservative win (new seat) | |||||
See also
Notes and references
- ↑ "Beyond 20/20 WDS - Table view". 2011 Electorate Figures. StatsWales. 1 December 2010. Retrieved 13 March 2011.
- ↑ "'Newport West', June 1983 up to May 1997". ElectionWeb Project. Cognitive Computing Limited. Archived from the original on 14 March 2016. Retrieved 13 March 2016.
- ↑ Leigh Rayment's Historical List of MPs – Constituencies beginning with "N" (part 1)
- 1 2 3 "Election candidate 'imposition' upsets Bridgend Tories". 2 May 2017. Retrieved 4 May 2017 – via www.bbc.co.uk.
- ↑ "Norfolk North and Penistone & Stocksbridge choose their candidates. Latest selection news. - Conservative Home". conservativehome.com. Retrieved 4 May 2017.
- ↑ Wales Green Party
- ↑ "Election Data 2015". Electoral Calculus. Archived from the original on 17 October 2015. Retrieved 17 October 2015.
- ↑ Shipton, Martin (23 July 2014). "Ann Clwyd: Veteran MP may stand for Parliament again after all". walesonline.co.uk. Retrieved 4 May 2017.
- ↑ "Westminster_Candidates.pdf" (PDF). Retrieved 31 January 2015.
- ↑ "Election Data 2010". Electoral Calculus. Archived from the original on 26 July 2013. Retrieved 17 October 2015.
- ↑ "Election Data 2005". Electoral Calculus. Archived from the original on 15 October 2011. Retrieved 18 October 2015.
- ↑ "Election Data 2001". Electoral Calculus. Archived from the original on 15 October 2011. Retrieved 18 October 2015.
- ↑ "Election Data 1997". Electoral Calculus. Archived from the original on 15 October 2011. Retrieved 18 October 2015.
- ↑ "Election Data 1992". Electoral Calculus. Archived from the original on 15 October 2011. Retrieved 18 October 2015.
- ↑ "Politics Resources". Election 1992. Politics Resources. 9 April 1992. Retrieved 2010-12-06.
- ↑ "Election Data 1987". Electoral Calculus. Archived from the original on 15 October 2011. Retrieved 18 October 2015.
- ↑ "Election Data 1983". Electoral Calculus. Archived from the original on 15 October 2011. Retrieved 18 October 2015.
External links
- Politics Resources (Election results from 1922 onwards)
- Electoral Calculus (Election results from 1955 onwards)
- 2017 Election House Of Commons Library 2017 Election report
- A Vision Of Britain Through Time (Constituency elector numbers)