Banbury (UK Parliament constituency)
| Banbury | |
|---|---|
|
County constituency for the House of Commons | |
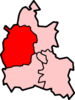
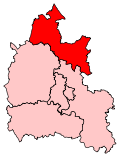 Boundary of Banbury in Oxfordshire. | |
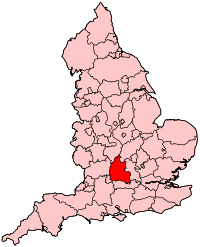 Location of Oxfordshire within England. | |
| County | Oxfordshire |
| Population | 117,928 (2011 census)[1] |
| Electorate | 84,063 (December 2010)[2] |
| Major settlements | Banbury and Bicester |
| Current constituency | |
| Created | 1553 |
| Member of parliament | Victoria Prentis (Conservative) |
| Number of members | One |
| Overlaps | |
| European Parliament constituency | South East England |
Banbury is a constituency in Oxfordshire[n 1] created in 1553 and represented in the House of Commons of the UK Parliament since 2015 by Victoria Prentis of the Conservative Party.[n 2] The constituency is occasionally, but erroneously, referred to as the North Oxfordshire constituency.
In terms of electorate Banbury was the 16th largest constituency in the United Kingdom at the time of the 2015 general election.[3]
History
The constituency was created January 26, 1554 through the efforts of Henry Stafford and Thomas Denton.[4] Until 1885 it was a parliamentary borough, consisting of the town of Banbury; since then it has been a county constituency, consisting of a northern part of Oxfordshire. It was the constituency represented by Lord North, the Prime Minister during the American War of Independence.
- Political history
Banbury has a post-World War I history of Conservative representation and local support for the party. Its MPs since 1922 have all served long terms in office and each since 1922 has been knighted. Following a close election in 1923, the largest vote since 1922 has at each election been for a Conservative. In 2010 Tony Baldry (Con) almost doubled his majority. The 2015 result made the seat the 125th safest of the Conservative Party's 331 seats by percentage of majority.[5]
- Other parties
Four of the six parties' candidates achieved more than the deposit-retaining threshold of 5% of the vote in 2015. In 2001 Labour Party candidate Lesley Silbey won the largest opposing-party share of the vote since 1974 — 35% of the vote. Prior to 1974, the highest percentage of votes for the second-placed candidate was in 1945 — 48% of the vote.
Constituency profile
The constituency has relatively high economic dependence on agriculture, as well as modern industry (particularly motor sport), research and development, public services and, to a lesser extent, defence. It contains two large market towns, Banbury and Bicester, where the majority of the electorate live. It is a partly rural seat, with the north west of the constituency on the edge of the Cotswolds. The Banbury constituency has experienced significant urban growth in Banbury and Bicester, where the majority of the electorate live. The area has experienced significant urban growth and is popular with commuters who favour its fast transport links to Birmingham, Oxford and London by rail, or the M40. More than one in 10 of the population is employed in higher managerial, administrative and professional work, according to ONS 2011 Census figures for England and Wales. In 2015 the seat was home to 4.3% of EU residents and unemployment was 2.9%.[6] There are some Labour voting wards in Banbury itself, but the remainder of the constituency including Bicester and the smaller rural towns and villages are safely Conservative. However the 2017 election saw a particularly strong swing for Labour like many towns in southern England.
Boundaries
1885–1918: The Municipal Borough of Banbury, and the Sessional Divisions of Banbury and Bloxham, Chadlington, and Wootton North.
1918–1950: The Municipal Boroughs of Banbury, Chipping Norton, and Woodstock, the Urban District of Witney, and the Rural Districts of Banbury, Chipping Norton, Witney, and Woodstock.
1950–1974: The Municipal Boroughs of Banbury, Chipping Norton, and Woodstock, the Urban District of Witney, the Rural Districts of Banbury, Chipping Norton, and Witney, and in the Rural District of Ploughley the civil parishes of Begbroke, Gosford and Water Eaton, Hampton Gay and Poyle, Kidlington, Shipton on Cherwell, Thrupp, and Yarnton.
1974–1983: The Municipal Boroughs of Banbury, Chipping Norton, and Woodstock, the Urban District of Bicester, the Rural Districts of Banbury and Chipping Norton, and in the Rural District of Ploughley the civil parishes of Ardley, Bucknell, Caversfield, Chesterton, Cottisford, Finmere, Fringford, Fritwell, Godington, Hardwick with Tusmore, Hethe, Kirtlington, Launton, Lower Heyford, Middleton Stoney, Mixbury, Newton Purcell with Shelswell, Somerton, Souldern, Stoke Lyne, Stratton Audley, and Upper Heyford.
1983–1997: The District of Cherwell wards of Adderbury, Ambrosden, Ardley, Bicester East, Bicester South, Bicester West, Bloxham, Bodicote, Calthorpe, Chesterton, Cropredy, Deddington, Easington, Fringford, Grimsbury, Hardwick, Heyford, Hook Norton, Hornton, Kirtlington, Launton, Neithrop, Otmoor, Ruscote, Sibford, Steeple Aston, and Wroxton, and the District of West Oxfordshire wards of Bartons and Tackley, and Wootton.
1997–2010: The District of Cherwell wards of Adderbury, Ambrosden, Ardley, Bicester East, Bicester South, Bicester West, Bloxham, Bodicote, Calthorpe, Chesterton, Cropredy, Deddington, Easington, Fringford, Grimsbury, Hardwick, Heyford, Hook Norton, Hornton, Kirtlington, Launton, Neithrop, Otmoor, Ruscote, Sibford, Steeple Aston, and Wroxton.
2010–present: The District of Cherwell wards of Adderbury, Ambrosden and Chesterton, Banbury Calthorpe, Banbury Easington, Banbury Grimsbury and Castle, Banbury Hardwick, Banbury Neithrop, Banbury Ruscote, Bicester East, Bicester North, Bicester South, Bicester Town, Bicester West, Bloxham and Bodicote, Caversfield, Cropredy, Deddington, Fringford, Hook Norton, Launton, Sibford, The Astons and Heyfords, and Wroxton.
The constituency covers the north-east of Oxfordshire, around Banbury and largely corresponds to the Cherwell local government district, with the principal exception of the large village of Kidlington on the outskirts of Oxford which lies in the Oxford West and Abingdon constituency, and some smaller villages to the north-east of Oxford that lie in the Henley constituency.
Members of Parliament
Banbury borough (until 1885)
MPs 1554–1640
Constituency created 1554. (Even before the Reform Act of 1832, Banbury only returned one member to Parliament )
| Parliament | Member | ||
|---|---|---|---|
| Parliament of 1554 (Apr) | Thomas Denton | ||
| Parliament of 1554 (Nov) | Edward Stafford, 3rd Baron Stafford | ||
| Parliament of 1555 | Not known | ||
| Parliament of 1558 | John Denton | ||
| Parliament of 1559 | Thomas Lee | ||
| Parliament of 1563 | Francis Walsingham (sat for Lyme Regis, replaced by Owen Brereton) | ||
| Parliament of 1571 | Anthony Cope | ||
| Parliament of 1572 | |||
| Parliament of 1584 | Richard Fiennes | ||
| Parliament of 1586 | Anthony Cope | ||
| Parliament of 1588 | |||
| Parliament of 1593 | |||
| Parliament of 1597 | |||
| Parliament of 1601 | |||
| Parliament of 1604–1611 | (Sir) William Cope[7] | ||
| Addled Parliament (1614) | |||
| Parliament of 1621–1622 | |||
| Happy Parliament (1624–1625) | Sir Erasmus Dryden | ||
| Useless Parliament (1625) | Sir William Cope (Election declared void, replaced by James Fiennes) | ||
| Parliament of 1626 | Calcot Chambre | ||
| Parliament of 1628–1629 | John Crew | ||
| No Parliament summoned 1629–1640 | |||
MPs 1640–1885
Banbury division of Oxfordshire/Banbury County Constituency (since 1885)
Elections
Elections in the 2010s
| Party | Candidate | Votes | % | ± | |
|---|---|---|---|---|---|
| Conservative | Victoria Prentis | 33,388 | 54.2 | +1.2 | |
| Labour | Sean Woodcock | 20,989 | 34.1 | +12.8 | |
| Liberal Democrat | John Howson | 3,452 | 5.6 | -0.3 | |
| UKIP | Dickie Bird | 1,581 | 2.6 | -11.3 | |
| Green | Ian Middleton | 1,225 | 2.0 | -2.6 | |
| Independent | Roseanne Edwards | 927 | 1.5 | N/A | |
| Majority | 12,399 | 20.1 | -11.6 | ||
| Turnout | 61,652 | 73.5 | +7.9 | ||
| Conservative hold | Swing | -5.8 | |||
| Party | Candidate | Votes | % | ± | |
|---|---|---|---|---|---|
| Conservative | Victoria Prentis[18] | 30,749 | 53.0 | +0.2 | |
| Labour | Sean Woodcock | 12,354 | 21.3 | +2.1 | |
| UKIP | Dickie Bird[19] | 8,050 | 13.9 | +8.9 | |
| Liberal Democrat | John Howson | 3,440 | 5.9 | -14.5 | |
| Green | Ian Middleton[20] | 2,686 | 4.6 | +2.9 | |
| National Health Action | Roseanne Edwards | 729 | 1.3 | N/A | |
| Majority | 18,395 | 31.7 | -0.7 | ||
| Turnout | 58,008 | 65.6[21] | +0.9 | ||
| Conservative hold | Swing | ||||
| Party | Candidate | Votes | % | ± | |
|---|---|---|---|---|---|
| Conservative | Tony Baldry | 29,703 | 52.8 | +5.9 | |
| Liberal Democrat | David Rundle | 11,476 | 20.4 | +2.9 | |
| Labour | Leslie Sibley | 10,773 | 19.2 | -8.9 | |
| UKIP | David Fairweather | 2,806 | 5.0 | +2.8 | |
| Green | Alastair White | 959 | 1.7 | -1.1 | |
| Independent | Roseanne Edwards | 524 | 0.9 | N/A | |
| Majority | 18,227 | 32.4 | 21.8 | ||
| Turnout | 56,241 | 64.7 | +0.2 | ||
| Conservative hold | Swing | +1.5 | |||
Elections in the 2000s
| Party | Candidate | Votes | % | ± | |
|---|---|---|---|---|---|
| Conservative | Tony Baldry | 26,382 | 46.9 | +1.7 | |
| Labour | Leslie Sibley | 15,585 | 27.7 | −7.3 | |
| Liberal Democrat | Zoe Patrick | 10,076 | 17.9 | +2.0 | |
| Green | Alyson Duckmanton | 1,590 | 2.8 | +0.3 | |
| UKIP | Diana Heimann | 1,241 | 2.2 | +0.9 | |
| National Front | James Starkey | 918 | 1.6 | N/A | |
| Your Party | Chris Rowe | 417 | 0.7 | N/A | |
| Majority | 10,797 | 19.2 | |||
| Turnout | 56,209 | 64.5 | +3.4 | ||
| Conservative hold | Swing | +4.5 | |||
| Party | Candidate | Votes | % | ± | |
|---|---|---|---|---|---|
| Conservative | Tony Baldry | 23,271 | 45.2 | +2.3 | |
| Labour | Leslie Sibley | 18,052 | 35.0 | +0.2 | |
| Liberal Democrat | Anthony Worgan | 8,216 | 15.9 | −0.8 | |
| Green | Bevis Cotton | 1,281 | 2.5 | +1.6 | |
| UKIP | Stephen Harris | 695 | 1.3 | +0.7 | |
| Majority | 5,219 | 10.2 | |||
| Turnout | 51,515 | 61.1 | −14.1 | ||
| Conservative hold | Swing | ||||
Elections in the 1990s
| Party | Candidate | Votes | % | ± | |
|---|---|---|---|---|---|
| Conservative | Tony Baldry | 25,076 | 42.9 | -12.1 | |
| Labour | Hazel Y. Peperell | 20,339 | 34.8 | +8.3 | |
| Liberal Democrat | Catherine Bearder | 9,761 | 16.7 | -1.4 | |
| Referendum | James W. Ager | 2,245 | 3.84 | New | |
| Green | Bevis Cotton | 530 | 0.91 | New | |
| UKIP | L. King | 364 | 0.62 | New | |
| Natural Law | Ian Pearson | 131 | 0.22 | -0.2 | |
| Majority | 4,737 | 8.1 | |||
| Turnout | 58,446 | 75.1 | |||
| Conservative hold | Swing | ||||
| Party | Candidate | Votes | % | ± | |
|---|---|---|---|---|---|
| Conservative | Tony Baldry | 32,215 | 55.0 | −1.2 | |
| Labour | Angela Billingham | 15,495 | 26.5 | +6.1 | |
| Liberal Democrat | Geoffrey J. Fisher | 10,602 | 18.1 | −5.3 | |
| Natural Law | Robin Ticciati | 250 | 0.4 | N/A | |
| Majority | 16,720 | 28.6 | −4.2 | ||
| Turnout | 58,562 | 81.5 | +5.4 | ||
| Conservative hold | Swing | −3.6 | |||
Elections in the 1980s
| Party | Candidate | Votes | % | ± | |
|---|---|---|---|---|---|
| Conservative | Tony Baldry | 29,716 | 56.18 | +2.8 | |
| Social Democratic | David Rowland | 12,386 | 23.42 | -3.5 | |
| Labour | James Honeybone | 10,789 | 20.40 | +1.4 | |
| Majority | 17,330 | 32.77 | |||
| Turnout | 76.15 | ||||
| Conservative hold | Swing | ||||
| Party | Candidate | Votes | % | ± | |
|---|---|---|---|---|---|
| Conservative | Tony Baldry | 26,225 | 53.36 | ||
| Social Democratic | Keith Fitchett | 13,200 | 26.86 | ||
| Labour | Brian Hodgson | 9,343 | 19.01 | ||
| Monster Raving Loony | David Brough[23] | 383 | 0.78 | N/A | |
| Majority | 13,025 | 26.50 | |||
| Turnout | 75.24 | ||||
| Conservative hold | Swing | ||||
Elections in the 1970s
| Party | Candidate | Votes | % | ± | |
|---|---|---|---|---|---|
| Conservative | Neil Marten | 31,137 | 54.70 | ||
| Labour | Brian Hodgson | 16,623 | 29.20 | ||
| Liberal | M White | 8,658 | 15.21 | ||
| National Front | I Cherry | 504 | 0.89 | ||
| Majority | 14,514 | 25.50 | |||
| Turnout | 78.29 | ||||
| Conservative hold | Swing | ||||
| Party | Candidate | Votes | % | ± | |
|---|---|---|---|---|---|
| Conservative | Neil Marten | 24,210 | 47.35 | ||
| Labour | Anthony C Booth | 18,019 | 35.24 | ||
| Liberal | D Charlton | 8,352 | 16.34 | ||
| Independent English Nationalist | J Barbour | 547 | 1.07 | ||
| Majority | 6,191 | 12.11 | |||
| Turnout | 75.71 | ||||
| Conservative hold | Swing | ||||
| Party | Candidate | Votes | % | ± | |
|---|---|---|---|---|---|
| Conservative | Neil Marten | 25,167 | 45.43 | ||
| Labour | Anthony C Booth | 18,289 | 33.01 | ||
| Liberal | Geoffrey J Fisher | 11,947 | 21.56 | ||
| Majority | 6,878 | 12.41 | |||
| Turnout | 82.77 | ||||
| Conservative hold | Swing | ||||
| Party | Candidate | Votes | % | ± | |
|---|---|---|---|---|---|
| Conservative | Neil Marten | 36,712 | 53.41 | ||
| Labour | Anthony C Booth | 25,166 | 36.61 | ||
| Liberal | Geoffrey J Fisher | 6,859 | 9.98 | ||
| Majority | 11,546 | 16.80 | |||
| Turnout | 77.36 | ||||
| Conservative hold | Swing | ||||
Elections in the 1960s
| Party | Candidate | Votes | % | ± | |
|---|---|---|---|---|---|
| Conservative | Neil Marten | 28,932 | 47.53 | ||
| Labour | David Young | 24,529 | 40.30 | ||
| Liberal | Penelope Jessel | 7,407 | 12.17 | ||
| Majority | 4,403 | 7.23 | |||
| Turnout | 81.95 | ||||
| Conservative hold | Swing | ||||
| Party | Candidate | Votes | % | ± | |
|---|---|---|---|---|---|
| Conservative | Neil Marten | 27,281 | 47.18 | ||
| Labour | Gerald Fowler | 22,159 | 38.32 | ||
| Liberal | Francis John Ware | 7,851 | 13.58 | ||
| Farmers' Candidate | James Hayward | 534 | 0.92 | ||
| Majority | 5,122 | 8.86 | |||
| Turnout | 82.40 | ||||
| Conservative hold | Swing | ||||
Elections in the 1950s
| Party | Candidate | Votes | % | ± | |
|---|---|---|---|---|---|
| Conservative | Neil Marten | 26,413 | 50.61 | ||
| Labour | David J Buckle | 19,699 | 37.75 | ||
| Liberal | Kenneth Colman | 6,074 | 11.64 | ||
| Majority | 6,714 | 12.87 | |||
| Turnout | 81.02 | ||||
| Conservative hold | Swing | ||||
| Party | Candidate | Votes | % | ± | |
|---|---|---|---|---|---|
| Conservative | Douglas Dodds-Parker | 25,598 | 54.38 | ||
| Labour | Norman Francis Stogdon | 21,473 | 45.62 | ||
| Majority | 4,125 | 8.76 | |||
| Turnout | 77.14 | ||||
| Conservative hold | Swing | ||||
| Party | Candidate | Votes | % | ± | |
|---|---|---|---|---|---|
| Conservative | Douglas Dodds-Parker | 23,246 | 46.84 | ||
| Labour | William J. Bird | 19,672 | 39.64 | ||
| Liberal | Lawrence Robson | 6,706 | 13.51 | ||
| Majority | 3,574 | 7.20 | |||
| Turnout | 82.85 | ||||
| Conservative hold | Swing | ||||
| Party | Candidate | Votes | % | ± | |
|---|---|---|---|---|---|
| Conservative | Douglas Dodds-Parker | 21,365 | 43.46 | ||
| Labour Co-op | Cyril Rawlett Fenton | 19,408 | 39.48 | ||
| Liberal | Lawrence Robson | 8,392 | 17.07 | ||
| Majority | 1,957 | 3.98 | |||
| Turnout | 83.60 | ||||
| Conservative hold | Swing | ||||
Election in the 1940s
| Party | Candidate | Votes | % | ± | |
|---|---|---|---|---|---|
| Conservative | Douglas Dodds-Parker | 23,777 | 52.00 | ||
| Labour | Richard Brian Roach | 21,951 | 48.00 | ||
| Majority | 1,826 | 3.99 | |||
| Turnout | 70.55 | ||||
| Conservative hold | Swing | ||||
Elections in the 1930s
| Party | Candidate | Votes | % | ± | |
|---|---|---|---|---|---|
| Conservative | James Edmondson | 21,904 | 65.66 | n/a | |
| Labour | W E Wade | 11,456 | 34.34 | n/a | |
| Majority | 10,448 | 31.32 | n/a | ||
| Turnout | 65.82 | n/a | |||
| Conservative hold | Swing | n/a | |||
| Party | Candidate | Votes | % | ± | |
|---|---|---|---|---|---|
| Conservative | James Edmondson | unopposed | n/a | n/a | |
| Conservative hold | Swing | n/a | |||
Election in the 1920s
| Party | Candidate | Votes | % | ± | |
|---|---|---|---|---|---|
| Conservative | James Edmondson | 16,444 | 45.5 | -7.2 | |
| Liberal | Ronald Wilberforce Allen | 13,800 | 38.2 | +7.4 | |
| Labour | Lawrence A Wingfield | 5,894 | 16.3 | -0.2 | |
| Majority | 2,644 | 7.3 | -14.6 | ||
| Turnout | 78.7 | -0.6 | |||
| Conservative hold | Swing | -7.3 | |||
| Party | Candidate | Votes | % | ± | |
|---|---|---|---|---|---|
| Conservative | James Edmondson | 15,053 | 52.7 | ||
| Liberal | Harry Verney | 8,825 | 30.8 | ||
| Labour | Arthur Ernest Monks | 4,733 | 16.5 | ||
| Majority | 6,228 | 21.9 | |||
| Turnout | 79.3 | ||||
| Conservative hold | Swing | ||||

| Party | Candidate | Votes | % | ± | |
|---|---|---|---|---|---|
| Conservative | James Edmondson | 12,490 | 45.8 | -0.7 | |
| Liberal | C. B. Fry | 12,271 | 45.0 | +15.6 | |
| Labour | Ernest Bennett | 2,500 | 9.2 | -14.9 | |
| Majority | 0.8 | -16.3 | |||
| Turnout | 76.0 | -0.4 | |||
| Conservative hold | Swing | -8.2 | |||
| Party | Candidate | Votes | % | ± | |
|---|---|---|---|---|---|
| Conservative | James Edmondson | 12,491 | 46.5 | ||
| Liberal | James Harold Early | 7,885 | 29.4 | ||
| Labour | Ernest Bennett | 6,463 | 24.1 | ||
| Majority | 4,606 | 17.1 | |||
| Turnout | 26,839 | ||||
| Conservative gain from Liberal | Swing | ||||
| Party | Candidate | Votes | % | ± | |
|---|---|---|---|---|---|
| C | Liberal | Rhys Rhys-Williams | Unopposed | ||
| Liberal hold | |||||
| C indicates candidate endorsed by the coalition government. | |||||
Election in the 1910s
| Party | Candidate | Votes | % | ± | |
|---|---|---|---|---|---|
| C | Liberal | Rhys Rhys-Williams | Unopposed | ||
| Liberal hold | |||||
| C indicates candidate endorsed by the coalition government. | |||||
| Party | Candidate | Votes | % | ± | |
|---|---|---|---|---|---|
| Liberal | Rhys Rhys-Williams | Unopposed | |||
| Liberal hold | |||||
General Election 1914/15: Another General Election was required to take place before the end of 1915. The political parties had been making preparations for an election to take place and by the July 1914, the following candidates had been selected;
- Liberal: Eustace Fiennes
- Conservative:
| Party | Candidate | Votes | % | ± | |
|---|---|---|---|---|---|
| Liberal | Eustace Fiennes | 3,629 | 50.6 | +2.7 | |
| Conservative | Robert Bingham Brassey | 3,538 | 49.4 | −2.7 | |
| Majority | 91 | 1.2 | N/A | ||
| Turnout | 7,167 | 89.4 | −2.2 | ||
| Registered electors | 8,021 | ||||
| Liberal gain from Conservative | Swing | +2.7 | |||

| Party | Candidate | Votes | % | ± | |
|---|---|---|---|---|---|
| Conservative | Robert Bingham Brassey | 3,831 | 52.1 | +10.9 | |
| Liberal | Eustace Fiennes | 3,516 | 47.9 | −10.9 | |
| Majority | 315 | 4.2 | N/A | ||
| Turnout | 7,347 | 91.6 | +4.0 | ||
| Registered electors | 8,021 | ||||
| Conservative gain from Liberal | Swing | +10.9 | |||
Elections in the 1900s
| Party | Candidate | Votes | % | ± | |
|---|---|---|---|---|---|
| Liberal | Eustace Fiennes | 3,992 | 58.8 | +15.1 | |
| Conservative | George Villiers | 2,796 | 41.2 | −15.1 | |
| Majority | 1,196 | 17.6 | N/A | ||
| Turnout | 6,788 | 87.6 | +5.4 | ||
| Registered electors | 7,748 | ||||
| Liberal gain from Conservative | Swing | +15.1 | |||
| Party | Candidate | Votes | % | ± | |
|---|---|---|---|---|---|
| Conservative | Albert Brassey | 3,632 | 56.3 | −0.6 | |
| Liberal | Eustace Fiennes | 2,821 | 43.7 | +0.6 | |
| Majority | 811 | 12.6 | −1.2 | ||
| Turnout | 6,453 | 82.2 | −5.4 | ||
| Registered electors | 7,853 | ||||
| Conservative hold | Swing | −0.6 | |||
Elections in the 1890s
| Party | Candidate | Votes | % | ± | |
|---|---|---|---|---|---|
| Conservative | Albert Brassey | 4,057 | 56.9 | +8.2 | |
| Liberal | C.W. Thornton | 3,074 | 43.1 | −8.2 | |
| Majority | 983 | 13.8 | N/A | ||
| Turnout | 7,131 | 87.6 | +1.3 | ||
| Registered electors | 8,145 | ||||
| Conservative gain from Liberal | Swing | +8.2 | |||
| Party | Candidate | Votes | % | ± | |
|---|---|---|---|---|---|
| Liberal | Bernhard Samuelson | 3,640 | 51.3 | −2.3 | |
| Conservative | Llewellyn Malcolm Wynne[27] | 3,453 | 48.7 | +2.3 | |
| Majority | 187 | 2.6 | −4.6 | ||
| Turnout | 7,093 | 86.3 | +5.4 | ||
| Registered electors | 8,223 | ||||
| Liberal hold | Swing | −2.3 | |||
Elections in the 1880s
| Party | Candidate | Votes | % | ± | |
|---|---|---|---|---|---|
| Liberal | Bernhard Samuelson | 3,677 | 53.6 | −6.5 | |
| Conservative | Llewellyn Malcolm Wynne | 3,184 | 46.4 | +6.5 | |
| Majority | 493 | 7.2 | −13.0 | ||
| Turnout | 6,861 | 80.9 | −6.1 | ||
| Registered electors | 8,478 | ||||
| Liberal hold | Swing | −6.5 | |||
| Party | Candidate | Votes | % | ± | |
|---|---|---|---|---|---|
| Liberal | Bernhard Samuelson | 4,436 | 60.1 | −3.5 | |
| Conservative | Llewellyn Malcolm Wynne | 2,944 | 39.9 | +3.5 | |
| Majority | 1,492 | 20.2 | −7.0 | ||
| Turnout | 7,380 | 87.0 | +3.4 | ||
| Registered electors | 8,478 | ||||
| Liberal hold | Swing | −3.5 | |||
| Party | Candidate | Votes | % | ± | |
|---|---|---|---|---|---|
| Liberal | Bernhard Samuelson | 1,018 | 63.6 | +10.7 | |
| Conservative | Thomas Gibson Bowles[28] | 583 | 36.4 | −10.7 | |
| Majority | 435 | 27.2 | +21.4 | ||
| Turnout | 1,601 | 86.6 | +11.3 | ||
| Registered electors | 1,848 | ||||
| Liberal hold | Swing | +10.7 | |||
Elections in the 1870s
| Party | Candidate | Votes | % | ± | |
|---|---|---|---|---|---|
| Liberal | Bernhard Samuelson | 760 | 52.9 | −13.1 | |
| Conservative | Josiah Wilkinson[29] | 676 | 47.1 | +13.1 | |
| Majority | 84 | 5.8 | −26.3 | ||
| Turnout | 1,436 | 75.3 | −1.4 | ||
| Registered electors | 1,906 | ||||
| Liberal hold | Swing | −13.1 | |||
Elections in the 1860s
| Party | Candidate | Votes | % | ± | |
|---|---|---|---|---|---|
| Liberal | Bernhard Samuelson | 772 | 66.0 | +27.2 | |
| Conservative | George Stratton[30] | 397 | 34.0 | +2.9 | |
| Majority | 375 | 32.1 | +24.4 | ||
| Turnout | 1,169 | 76.7 | −9.8 | ||
| Registered electors | 1,524 | ||||
| Liberal hold | Swing | +12.2 | |||
| Party | Candidate | Votes | % | ± | |
|---|---|---|---|---|---|
| Liberal | Bernhard Samuelson | 206 | 38.8 | −7.1 | |
| Conservative | Charles Bell[31] | 165 | 31.1 | N/A | |
| Independent Liberal | Charles Eurwicke Douglas | 160 | 30.1 | −24.0 | |
| Majority | 41 | 7.7 | N/A | ||
| Turnout | 531 | 86.5 | +21.9 | ||
| Registered electors | 614 | ||||
| Liberal gain from Independent Liberal | Swing | +8.5 | |||
Elections in the 1850s
| Party | Candidate | Votes | % | ± | |
|---|---|---|---|---|---|
| Independent Liberal | Charles Eurwicke Douglas | 235 | 54.1 | N/A | |
| Liberal | Bernhard Samuelson | 199 | 45.9 | −32.9 | |
| Majority | 36 | 8.3 | N/A | ||
| Turnout | 434 | 64.6 | +13.7 | ||
| Registered electors | 672 | ||||
| Independent Liberal gain from Liberal | Swing | N/A | |||
| Party | Candidate | Votes | % | ± | |
|---|---|---|---|---|---|
| Whig | Bernhard Samuelson | 177 | 37.6 | −41.2 | |
| Conservative | John Hardy | 176 | 37.4 | N/A | |
| Independent Liberal | Edward Miall | 118 | 25.1 | N/A | |
| Majority | 1 | 0.2 | −57.5 | ||
| Turnout | 471 | 70.1 | +19.2 | ||
| Registered electors | 672 | ||||
| Whig hold | Swing | N/A | |||
- Caused by Tancred's resignation.
| Party | Candidate | Votes | % | ± | |
|---|---|---|---|---|---|
| Whig | Henry William Tancred | 216 | 78.8 | N/A | |
| Radical | Edward Yates[32] | 58 | 21.2 | N/A | |
| Majority | 158 | 57.7 | N/A | ||
| Turnout | 274 | 50.9 | N/A | ||
| Registered electors | 538 | ||||
| Whig hold | Swing | N/A | |||
| Party | Candidate | Votes | % | ± | |
|---|---|---|---|---|---|
| Whig | Henry William Tancred | Unopposed | |||
| Registered electors | 491 | ||||
| Whig hold | |||||
Neighbouring constituencies
Constituencies bordering Banbury | |
|---|---|
Banbury is bordered to the north-east by Northamptonshire South, to the east by Buckingham, to the south by Witney and Henley constituencies, to the east by Stratford-upon-Avon and to the north-east by Kenilworth and Southam.
See also
Notes and references
- Notes
- ↑ A county constituency (for the purposes of election expenses and type of returning officer)
- ↑ As with all constituencies, the constituency elects one Member of Parliament (MP) by the first past the post system of election at least every five years.
- References
- ↑ "Usual Resident Population, 2011". Neighbourhood Statistics. Office for National Statistics. Retrieved 27 January 2015.
- ↑ "Electorate Figures – Boundary Commission for England". 2011 Electorate Figures. Boundary Commission for England. 4 March 2011. Archived from the original on November 6, 2010. Retrieved 13 March 2011.
- ↑ http://www.electoralcommission.org.uk/our-work/our-research/electoral-data Excel Data – UK Parliament General Election, 2015
- ↑ Bindoff, p. 30.
- ↑ List of Conservative MPs elected in 2015 by % majority UK Political.info. Retrieved 2017-01-29
- ↑ Banbury constituency profile 2015 (BBC News). Retrieved 12 May 2017.
- ↑ Succeeded as baronet, July 1615
- 1 2 Leigh Rayment's Historical List of MPs – Constituencies beginning with "B" (part 1)
- ↑ Created a baronet, June 1663
- ↑ Expelled from the House of Commons
- ↑ Knollys claimed and used the title Viscount Wallingford, but his claim was disallowed by the House of Lords
- 1 2 Tancred, Henry William (1969). Trinder, Barrie Stuart, ed. A Victorian M.P. and his constituents: the correspondence of H. W. Tancred, 1841-1859 (Illustrated ed.). Banbury Historical Society. p. 105.
- 1 2 3 4 Potts, A (1969). "The educational work of Sir Bernhard Samuelson (1820-1905) with special reference to technical education" (PDF). Durham E-Theses Online. Durham University. Retrieved 7 April 2018.
- ↑ Created a baronet, June 1916
- ↑ "Election Data 2015". Electoral Calculus. Archived from the original on 17 October 2015. Retrieved 17 October 2015.
- ↑ http://www.cherwell.gov.uk/index.cfm?articleid=10679
- ↑ https://www.bbc.co.uk/news/politics/constituencies/E14000539
- ↑ https://www.webcitation.org/6TzPEbZuH?url=http://northoxfordshireconservatives.com/
- ↑ "Oxfordshire PPC Candidates: first in south east". UKIP South East. 12 September 2014. Retrieved 16 January 2015.
- ↑ http://www.greenoxfordshire.com/imid99
- ↑ total electorate 88420 from Cherwell District Council elections office 28 May 2015 and accepted by House of Commons Library 18 June 2015
- ↑ "Politics Resources". Election 1992. Politics Resources. 9 April 1992. Retrieved 6 Dec 2010.
- ↑ "Sir Tony’s first victory", Banbury Guardian, 30 March 2015. Retrieved 12 May 2015
- ↑ The Times' Guide to the House of Commons. 1950.
- ↑ British Parliamentary Election Results 1918–49, FWS Craig
- 1 2 3 4 5 6 7 8 9 10 11 12 13 14 15 16 17 British parliamentary election results, 1885–1918 (Craig)
- ↑ "Complimentary Banquet to L. M. Wynne, Esq". Oxford Journal. 24 Sep 1892. p. 8. Retrieved 21 November 2017.
- ↑ "Representation of Banbury". Derby Daily Telegraph. 19 Feb 1880. p. 3. Retrieved 23 November 2017.
- ↑ "Banbury". Northampton Mercury. 28 March 1874. p. 8. Retrieved 27 December 2017 – via British Newspaper Archive. (Subscription required (help)).
- ↑ "Banbury". Yorkshire Post and Leeds Intelligencer. 16 November 1868. pp. 3–4. Retrieved 28 January 2018 – via British Newspaper Archive. (Subscription required (help)).
- ↑ "Banbury". The Oxford Times. 22 July 1865. p. 7. Retrieved 28 January 2018 – via British Newspaper Archive. (Subscription required (help)).
- ↑ "The General Election". North Devon Gazette. 24 March 1857. p. 4. Retrieved 7 April 2018 – via British Newspaper Archive. (Subscription required (help)).
Sources
- Iain Dale, ed. (2003). The Times House of Commons 1929, 1931, 1935. Politico's (reprint). ISBN 1-84275-033-X.
- The Times House of Commons 1945. The Times. 1945.
- The Times House of Commons 1950. The Times. 1950.
- The Times House of Commons 1955. The Times. 1955.
- Robert Beatson, A Chronological Register of Both Houses of Parliament (London: Longman, Hurst, Res & Orme, 1807)
- Stanley T. Bindoff et al. (1982). The House of Commons: 1509 – 1558 ; 1, Appendices, constituencies, members A – C, Volume 4. Boydell & Brewer. ISBN 0-436-04282-7. pp. 30–31.
- D Brunton & D H Pennington, Members of the Long Parliament (London: George Allen & Unwin, 1954)
- F W S Craig, British Parliamentary Election Results 1832–1885 (2nd edition, Aldershot: Parliamentary Research Services, 1989)
- The Constitutional Year Book for 1913 (London: National Union of Conservative and Unionist Associations, 1913)
Coordinates: 51°58′N 1°18′W / 51.96°N 1.30°W
| Parliament of the United Kingdom | ||
|---|---|---|
| Vacant since 1766 Title last held by Bath |
Constituency represented by the Prime Minister 1770–1782 |
Vacant until 1783 Title next held by Appleby |