Aylesbury (UK Parliament constituency)
Coordinates: 51°48′58″N 0°49′01″W / 51.816°N 0.817°W
| Aylesbury | |
|---|---|
|
County constituency for the House of Commons | |
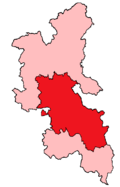
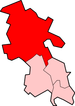
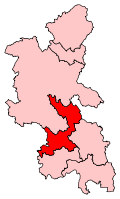 Boundary of Aylesbury in Buckinghamshire. | |
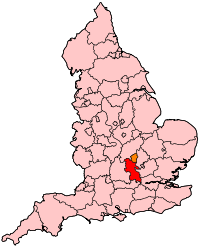 Location of Buckinghamshire within England. | |
| County | Buckinghamshire |
| Population | 108,027 (2011 census)[1] |
| Electorate | 79,664 (April 2015)[2] |
| Current constituency | |
| Created | 1885 |
| Member of parliament | David Lidington (Conservative) |
| Number of members | One |
| 1553–1885 | |
| Number of members | Two |
| Type of constituency | Borough constituency |
| Overlaps | |
| European Parliament constituency | South East England |
Aylesbury is a constituency created in 1553 — created as a single-member seat in 1885 — represented in the House of Commons of the United Kingdom since 1992 by David Lidington, of the Conservative Party.[n 1]
Boundaries
1885-1918: The Sessional Divisions of Aylesbury, Chesham, and Linslade, and parts of the second Sessional Division of Desborough and the Sessional Division of Winslow.
1918-1950: The Borough of Aylesbury, the Urban Districts of Beaconsfield and Chesham, the Rural District of Amersham, part of the Rural District of Aylesbury, in the Rural District of Long Crendon the parish of Towersey, and in the Rural District of Wycombe the parishes of Bledlow, Bradenham, Ellesborough, Great and Little Hampden, Great and Little Kimble, Horsenden, Hughenden, Ilmer, Monks Risborough, Princes Risborough, Radnage, Saunderton, and Wendover.
1950–1974: The Borough of Aylesbury, the Urban District of Chesham, the Rural District of Aylesbury, and in the Rural District of Amersham the parishes of Ashley Green, Chartridge, Cholesbury-cum-St Leonards, Great Missenden, Latimer, Lee, and Little Missenden.
1974–1983: The Borough of Aylesbury, the Rural District of Aylesbury, and in the Rural District of Wycombe the parishes of Bledlow-cum-Saunderton, Bradenham, Ellesborough, Great and Little Hampden, Great and Little Kimble, Ibstone, Lacey Green, Longwick-cum-Ilmer, Princes Risborough, Radnage, and Stokenchurch.
1983–1997: The District of Aylesbury Vale wards of Aston Clinton, Aylesbury Central, Bedgrove, Elmhurst, Gatehouse, Grange, Mandeville, Meadowcroft, Oakfield, Southcourt, Wendover, and Weston Turville, the District of Chiltern wards of Ballinger and South Heath, Great Missenden, and Prestwood and Heath End, and the District of Wycombe wards of Bledlow-cum-Saunderton, Icknield, Lacey Green and Hampden, Naphill-cum-Bradenham, Princes Risborough, and Stokenchurch.
1997–2010: The District of Aylesbury Vale wards of Aylesbury Central, Bedgrove, Elmhurst, Gatehouse, Grange, Mandeville, Meadowcroft, Oakfield, Southcourt, Wendover, and Weston Turville, the District of Chiltern wards of Ballinger and South Heath, Great Missenden, and Prestwood and Heath End, and the District of Wycombe wards of Bledlow-cum-Saunderton, Icknield, Lacey Green and Hampden, Naphill-cum-Bradenham, Princes Risborough, and Stokenchurch.
2010–present: The District of Aylesbury Vale wards of Aston Clinton, Aylesbury Central, Bedgrove, Coldharbour, Elmhurst and Watermead, Gatehouse, Mandeville and Elm Farm, Oakfield, Quarrendon, Southcourt, Walton Court and Hawkslade, and Wendover, and the District of Wycombe wards of Bledlow and Bradenham, Greater Hughenden, Lacey Green, Speen and the Hampdens, Stokenchurch, and Radnage.
The constituency is based on the large town of Aylesbury and its suburbs as well as a small swathe of villages broken up by woods and cultivated land in the centre of the Chilterns which cover most of Buckinghamshire and parts of three other counties.
History
- Early form
The seat was a much narrower, generally urban borough with a two-member status at Westminster from its grant of a limited franchise in 1553 until the passing of the Redistribution of Seats Act 1885 when it transformed into a large county division which has seen on national boundary reviews a gradual reduction in physical size as its population has grown.
- Political history
The Conservative Party has held the seat since 1924, and held it at the 2015 general election with a 50.7% share of the vote. The result made the seat the 133rd safest of the Conservative Party's 331 seats by percentage of majority.[3] The closest result since 1929 was in 1966 when the Labour Party candidate fell 7.4% short of a majority.
- Frontbenchers
David Lidington, the current incumbent, was the Secretary of State for Justice in Theresa May's cabinet since succeeding Elizabeth Truss in the 2017 cabinet reshuffle, before becoming the effective First Secretary of State in the place of Damian Green in 2018's new year's reshuffle. During the premiership of David Cameron he served as Minister for Europe, campaigning unsuccessfully (in the constituency as well as the whole country) to remain in the EU. From 2007 to 2010 he had been his party's Shadow Secretary of State for Northern Ireland.
- MPs who have received honours
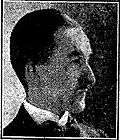
Sir Stanley Reed edited The Times of India from 1907 until 1924 and received correspondence from the major figures of India such as Mahatma Gandhi. In all he lived in India for fifty years. He was respected in the United Kingdom as an expert on Indian current affairs. He devised the sobriquet for Jaipur, 'the Pink City of India'.
Constituency profile
Aylesbury expanded significantly after World War II, in a diverse way with a similar proportion of this recent development being social housing estates as private estates.
Workless claimants who were registered jobseekers were in November 2012 lower than the regional average of 2.4% and national average of 3.8%, at 2.2% of the population based on a statistical compilation by The Guardian.[4]
Whereas the average house price is higher than the national average, in the Aylesbury Vale authority (which largely overlaps) this in the first quarter of 2013 was £262,769, the lowest of the four authorities in Buckinghamshire and this compares to the highest county average of £549,046 in South Bucks District.[5]
Members of Parliament
MPs 1553–1659
- Constituency created (1553)
| Year | First member | Second member |
|---|---|---|
| 1554 (Apr) | Thomas Smith | Humphrey Moseley |
| 1554 (Nov) | William Rice | John Walwyn |
| 1555 | Anthony Restwold | |
| 1558 | Names lost | |
| 1559 | Arthur Porter | Thomas Crawley |
| 1563 | Thomas Sackville | Thomas Coleshill |
| 1571 | Thomas Lichfield | Edmund Dockwra |
| 1572 | George Burden | |
| 1584 | Thomas Tasburgh | John Smith |
| 1586 | Thomas Scott | |
| 1589 | Thomas Pigott | Henry Fleetwood |
| 1593 | Sir Thomas West | John Lyly |
| 1597 | Thomas Tasburgh | Thomas Smythe |
| 1601 | John Lyly | Richard More |
| 1604 | Sir William Borlase | Sir William Smith |
| 1614 | Sir John Dormer | Samuel Backhouse |
| 1621 | Henry Borlase | |
| 1624 | Sir John Pakington, Bt | Sir Thomas Crewe |
| 1625 | Sir Robert Carr | |
| May 1625 | Sir John Hare | |
| 1626 | Clement Coke | Arthur Goodwin |
| 1628 | Sir Edmund Verney | |
| April 1640 | Sir John Pakington, Bt | Ralph Verney |
| 1640 | Thomas Fountaine | |
| November 1640 | Sir John Pakington, Bt | |
| 1645 | Thomas Scot | Simon Mayne |
- Returned one member to the First and Second Protectorate Parliaments
| Year | Member |
|---|---|
| 1654 | Henry Philips |
| 1656 | Thomas Scot |
- Returned two members to the Third Protectorate Parliament and thereafter
MPs 1659–1885
MPs since 1885
Under the Redistribution of Seats Act 1885, the parliamentary borough of Aylesbury was abolished. The name was transferred to a new, larger, county division of Buckinghamshire, which elected one Member of Parliament (MP).
Elections
Elections in the 2010s
| Party | Candidate | Votes | % | ± | |
|---|---|---|---|---|---|
| Conservative | David Lidington | 32,313 | 55.0 | ||
| Labour | Mark Bateman | 17,617 | 30.0 | ||
| Liberal Democrat | Steven Lambert | 5,660 | 9.6 | ||
| UKIP | Vijay Singh Srao | 1,296 | 2.2 | ||
| Green | Coral Simpson | 1,237 | 2.1 | ||
| Independent | Kyle Michael | 620 | 1.1 | ||
| Majority | 14,696 | 25.0 | |||
| Turnout | 58,743 | 71.4 | |||
| Conservative hold | Swing | -5.25 | |||
| Party | Candidate | Votes | % | ± | |
|---|---|---|---|---|---|
| Conservative | David Lidington | 28,083 | 50.7 | -1.5 | |
| UKIP | Chris Adams | 10,925 | 19.7 | +12.9 | |
| Labour | William Cass | 8,391 | 15.1 | +2.5 | |
| Liberal Democrat | Steven Lambert | 5,885 | 10.6 | -17.8 | |
| Green | David Lyons | 2,135 | 3.9 | +3.9 | |
| Majority | 17,158 | 31.0 | +7.3 | ||
| Turnout | 55,419 | 69.0 | +0.8 | ||
| Conservative hold | Swing | -7.2 | |||
| Party | Candidate | Votes | % | ± | |
|---|---|---|---|---|---|
| Conservative | David Lidington | 27,736 | 52.2 | +3.1 | |
| Liberal Democrat | Steven Lambert | 15,118 | 28.4 | +0.8 | |
| Labour | Kathryn White | 6,695 | 12.6 | -5.9 | |
| UKIP | Chris Adams | 3,613 | 6.8 | +2.0 | |
| Majority | 12,618 | 23.7 | +2.2 | ||
| Turnout | 53,162 | 68.2 | +5.8 | ||
| Conservative hold | Swing | +2.1 | |||
Elections in the 2000s
| Party | Candidate | Votes | % | ± | |
|---|---|---|---|---|---|
| Conservative | David Lidington | 25,252 | 49.1 | +1.8 | |
| Liberal Democrat | Peter Jones | 14,187 | 27.6 | +0.7 | |
| Labour | Mohammed Khaliel | 9,540 | 18.5 | -4.7 | |
| UKIP | Chris Adams | 2,479 | 4.8 | +2.3 | |
| Majority | 11,066 | 21.5 | +1.1 | ||
| Turnout | 51,458 | 62.4 | +1.0 | ||
| Conservative hold | Swing | +0.6 | |||
| Party | Candidate | Votes | % | ± | |
|---|---|---|---|---|---|
| Conservative | David Lidington | 23,230 | 47.3 | +3.1 | |
| Liberal Democrat | Peter M. Jones | 13,221 | 26.9 | -2.6 | |
| Labour | Keith M. White | 11,388 | 23.2 | +1.0 | |
| UKIP | Justin D. Harper | 1,248 | 2.5 | N/A | |
| Majority | 10,009 | 20.4 | +5.8 | ||
| Turnout | 49,087 | 61.4 | -11.4 | ||
| Conservative hold | Swing | ||||
Elections in the 1990s
| Party | Candidate | Votes | % | ± | |
|---|---|---|---|---|---|
| Conservative | David Lidington | 25,426 | 44.2 | -13.2 | |
| Liberal Democrat | Sharon Bowles | 17,007 | 29.5 | +1.8 | |
| Labour | Robert Langridge | 12,759 | 22.2 | +8.8 | |
| Referendum | Marc John | 2,196 | 3.8 | N/A | |
| Natural Law | Lawrence R. Sheaff | 166 | 0.3 | +0.1 | |
| Majority | 8,419 | 14.6 | -15.1 | ||
| Turnout | 57,554 | 72.8 | -6.6 | ||
| Conservative hold | Swing | ||||
| Party | Candidate | Votes | % | ± | |
|---|---|---|---|---|---|
| Conservative | David Lidington | 36,500 | 57.4 | -0.1 | |
| Liberal Democrat | Sharon Bowles | 17,640 | 27.7 | -0.9 | |
| Labour | Roger Priest | 8,517 | 13.4 | -0.5 | |
| Green | Nigel A. Foster | 702 | 1.1 | +1.1 | |
| Natural Law | Bruno H.M. D'Arcy | 239 | 0.4 | +0.4 | |
| Majority | 18,860 | 29.7 | +0.8 | ||
| Turnout | 63,598 | 80.4 | +5.9 | ||
| Conservative hold | Swing | +0.4 | |||
Elections in the 1980s
| Party | Candidate | Votes | % | ± | |
|---|---|---|---|---|---|
| Conservative | Timothy Raison | 32,970 | 57.5 | ||
| Social Democratic | Michael Soole | 16,412 | 28.6 | ||
| Labour | Julie Larner | 7,936 | 13.9 | ||
| Majority | 16,558 | 28.89 | |||
| Turnout | 74.52 | ||||
| Conservative hold | Swing | ||||
| Party | Candidate | Votes | % | ± | |
|---|---|---|---|---|---|
| Conservative | Timothy Raison | 30,230 | 58.06 | ||
| Social Democratic | Michael Soole | 15,310 | 29.40 | ||
| Labour | M.P. Moran | 6,364 | 12.22 | ||
| Independent | T. Chapman | 166 | 0.3 | ||
| Majority | 14,920 | 28.65 | |||
| Turnout | 71.53 | ||||
| Conservative hold | Swing | ||||
Elections in the 1970s
| Party | Candidate | Votes | % | ± | |
|---|---|---|---|---|---|
| Conservative | Timothy Raison | 33,953 | 58.25 | ||
| Labour | JG Power | 14,091 | 24.17 | ||
| Liberal | MJ Cook | 10,248 | 17.58 | ||
| Majority | 19,862 | 34.07 | |||
| Turnout | 77.99 | ||||
| Conservative hold | Swing | ||||
| Party | Candidate | Votes | % | ± | |
|---|---|---|---|---|---|
| Conservative | Timothy Raison | 23,565 | 46.78 | ||
| Labour | Reginald Groves | 14,592 | 28.97 | ||
| Liberal | MJ Cook | 12,219 | 24.36 | ||
| Majority | 8,973 | 17.81 | |||
| Turnout | 74.38 | ||||
| Conservative hold | Swing | ||||
| Party | Candidate | Votes | % | ± | |
|---|---|---|---|---|---|
| Conservative | Timothy Raison | 25,764 | 47.0 | ||
| Liberal | MJ Cook | 14,581 | 26.6 | ||
| Labour | Reginald Groves | 14,463 | 26.4 | ||
| Majority | 11,183 | 20.4 | |||
| Turnout | 91.2 | ||||
| Conservative hold | Swing | ||||
| Party | Candidate | Votes | % | ± | |
|---|---|---|---|---|---|
| Conservative | Timothy Raison | 31,084 | 53.25 | ||
| Labour | James E Mitchell | 20,441 | 35.02 | ||
| Liberal | Philip S Kinsey | 6,849 | 11.73 | ||
| Majority | 10,643 | 18.23 | |||
| Turnout | 58,374 | 75.46 | |||
| Conservative hold | Swing | ||||
Elections in the 1960s
| Party | Candidate | Votes | % | ± | |
|---|---|---|---|---|---|
| Conservative | Spencer Summers | 23,673 | 44.91 | ||
| Labour | Peter Allison | 19,766 | 37.50 | ||
| Liberal | Timothy Joyce | 9,272 | 17.59 | ||
| Majority | 3,907 | 7.41 | |||
| Turnout | 52,711 | 79.90 | |||
| Conservative hold | Swing | ||||
| Party | Candidate | Votes | % | ± | |
|---|---|---|---|---|---|
| Conservative | Spencer Summers | 23,856 | 47.12 | ||
| Labour | Gordon Western | 16,467 | 32.53 | ||
| Liberal | Timothy Joyce | 10,301 | 20.35 | ||
| Majority | 7,389 | 14.60 | |||
| Turnout | 50,624 | 80.02 | |||
| Conservative hold | Swing | ||||
Elections in the 1950s
| Party | Candidate | Votes | % | ± | |
|---|---|---|---|---|---|
| Conservative | Spencer Summers | 22,504 | 51.20 | ||
| Labour | Hugh Gray | 14,549 | 30.83 | ||
| Liberal | Howard Levett Fry | 7,897 | 17.97 | ||
| Majority | 8,955 | 20.38 | |||
| Turnout | 43,950 | 81.25 | |||
| Conservative hold | Swing | ||||
| Party | Candidate | Votes | % | ± | |
|---|---|---|---|---|---|
| Conservative | Spencer Summers | 20,330 | 49.87 | ||
| Labour | Tony Harman | 14,569 | 35.74 | ||
| Liberal | Howard Levett Fry | 5,869 | 14.40 | ||
| Majority | 5,761 | 14.13 | |||
| Turnout | 40,768 | 81.80 | |||
| Conservative hold | Swing | ||||
| Party | Candidate | Votes | % | ± | |
|---|---|---|---|---|---|
| Conservative | Spencer Summers | 22,455 | 56.05 | ||
| Labour | Tony Harman | 17,605 | 43.95 | ||
| Majority | 4,850 | 12.11 | |||
| Turnout | 83.14 | ||||
| Conservative hold | Swing | ||||
| Party | Candidate | Votes | % | ± | |
|---|---|---|---|---|---|
| Conservative | Spencer Summers | 17,623 | 44.69 | ||
| Labour | Tony Harman | 14,262 | 36.17 | ||
| Liberal | Guthrie Moir | 7,547 | 19.14 | ||
| Majority | 3,361 | 8.52 | |||
| Turnout | 83.43 | ||||
| Conservative hold | Swing | ||||
Elections in the 1940s
| Party | Candidate | Votes | % | ± | |
|---|---|---|---|---|---|
| Conservative | Stanley Reed | 24,537 | 47.85 | ||
| Labour | Reginald Groves | 16,445 | 32.07 | ||
| Liberal | Guy Naylor | 10,302 | 20.09 | ||
| Majority | 8,092 | 15.78 | |||
| Turnout | 69.55 | ||||
| Conservative hold | Swing | ||||
General Election 1939/40:
Another General Election was required to take place before the end of 1940. The political parties had been making preparations for an election to take place from 1939 and by the end of this year, the following candidates had been selected; *Conservative: Stanley Reed
- Liberal: Atholl Robertson
- Labour: Reginald Groves
Elections in the 1930s
| Party | Candidate | Votes | % | ± | |
|---|---|---|---|---|---|
| Conservative | Stanley Reed | 21,695 | 54.1 | ||
| Liberal | Thomas Atholl Robertson | 10,751 | 26.8 | ||
| Labour | Reginald Groves | 7,666 | 19.1 | ||
| Majority | 10,994 | 27.3 | |||
| Turnout | 63.1 | ||||
| Conservative hold | Swing | ||||

| Party | Candidate | Votes | % | ± | |
|---|---|---|---|---|---|
| Conservative | Michael Beaumont | 24,728 | 57.42 | ||
| Liberal | Margaret Wintringham | 13,622 | 31.63 | ||
| Labour | Eric W. Shearer | 4,716 | 10.95 | ||
| Majority | 11,106 | 25.79 | |||
| Turnout | 70.24 | ||||
| Conservative hold | Swing | ||||
| Party | Candidate | Votes | % | ± | |
|---|---|---|---|---|---|
| Conservative | Michael Beaumont | 29,368 | 68.34 | ||
| Liberal | Cyril Berkeley Dallow | 8,927 | 20.77 | ||
| Labour | Dorothy Woodman | 4,677 | 10.88 | ||
| Majority | 20,441 | 47.57 | |||
| Turnout | 75.61 | ||||
| Conservative hold | Swing | ||||
Elections in the 1920s
| Party | Candidate | Votes | % | ± | |
|---|---|---|---|---|---|
| Unionist | Michael Beaumont | 20,478 | 48.1 | -7.9 | |
| Liberal | Thomas Keens | 17,594 | 41.3 | +5.5 | |
| Labour | F G Temple | 4,509 | 10.6 | +2.4 | |
| Majority | 2,884 | 6.8 | -13.4 | ||
| Turnout | 78.7 | -3.3 | |||
| Unionist hold | Swing | -6.7 | |||
| Party | Candidate | Votes | % | ± | |
|---|---|---|---|---|---|
| Unionist | Alan Hughes Burgoyne | 18,132 | 56.0 | +8.4 | |
| Liberal | Thomas Keens | 11,574 | 35.8 | -12.1 | |
| Labour | Frederick Charles Watkins | 2,655 | 8.2 | +3.7 | |
| Majority | 6,558 | 20.2 | n/a | ||
| Turnout | 82.0 | +7.3 | |||
| Unionist gain from Liberal | Swing | +10.2 | |||
| Party | Candidate | Votes | % | ± | |
|---|---|---|---|---|---|
| Liberal | Thomas Keens | 13,575 | 47.9 | +1.0 | |
| Unionist | Alan Hughes Burgoyne | 13,504 | 47.6 | -3.5 | |
| Labour | Frederick Charles Watkins | 1,275 | 4.5 | n/a | |
| Majority | 71 | 0.3 | n/a | ||
| Turnout | 74.7 | +3.3 | |||
| Liberal gain from Unionist | Swing | +1.3 | |||
| Party | Candidate | Votes | % | ± | |
|---|---|---|---|---|---|
| Unionist | Lionel Nathan de Rothschild | 13,406 | 51.1 | n/a | |
| Liberal | Thomas Keens | 12,835 | 48.9 | n/a | |
| Majority | 571 | 2.2 | n/a | ||
| Turnout | 71.4 | n/a | |||
| Unionist hold | Swing | n/a | |||
Elections in the 1910s
| Party | Candidate | Votes | % | ± | |
|---|---|---|---|---|---|
| C | Unionist | Lionel Nathan de Rothschild | Unopposed | ||
| Unionist hold | |||||
| C indicates candidate endorsed by the coalition government. | |||||
| Party | Candidate | Votes | % | ± | |
|---|---|---|---|---|---|
| Liberal Unionist | Lionel Nathan de Rothschild | Unopposed | |||
| Liberal Unionist hold | |||||
| Party | Candidate | Votes | % | ± | |
|---|---|---|---|---|---|
| Liberal Unionist | Lionel Nathan de Rothschild | 6,037 | 56.9 | +0.9 | |
| Liberal | A.R.W. Atkins | 4,574 | 43.1 | −0.9 | |
| Majority | 1,463 | 13.8 | +1.8 | ||
| Turnout | 10,611 | 86.8 | −0.1 | ||
| Registered electors | 12,218 | ||||
| Liberal Unionist hold | Swing | +0.9 | |||
Elections in the 1900s
| Party | Candidate | Votes | % | ± | |
|---|---|---|---|---|---|
| Liberal Unionist | Walter Rothschild | 5,675 | 56.0 | N/A | |
| Liberal | Silas Hocking | 4,463 | 44.0 | N/A | |
| Majority | 1,212 | 12.0 | N/A | ||
| Turnout | 10,138 | 86.9 | N/A | ||
| Registered electors | 11,661 | ||||
| Liberal Unionist hold | Swing | N/A | |||
| Party | Candidate | Votes | % | ± | |
|---|---|---|---|---|---|
| Liberal Unionist | Walter Rothschild | Unopposed | |||
| Liberal Unionist hold | |||||
Elections in the 1890s
| Party | Candidate | Votes | % | ± | |
|---|---|---|---|---|---|
| Liberal Unionist | Walter Rothschild | Unopposed | |||
| Liberal Unionist hold | |||||
| Party | Candidate | Votes | % | ± | |
|---|---|---|---|---|---|
| Liberal Unionist | Ferdinand de Rothschild | Unopposed | |||
| Liberal Unionist hold | |||||
| Party | Candidate | Votes | % | ± | |
|---|---|---|---|---|---|
| Liberal Unionist | Ferdinand de Rothschild | 5,515 | 64.8 | −9.0 | |
| Liberal | T.H. Dolbey | 2,992 | 35.2 | +9.0 | |
| Majority | 2,523 | 29.6 | −18.0 | ||
| Turnout | 8,507 | 77.8 | +17.0 | ||
| Registered electors | 10,928 | ||||
| Liberal Unionist hold | Swing | −9.0 | |||
Elections in the 1880s
| Party | Candidate | Votes | % | ± | |
|---|---|---|---|---|---|
| Liberal Unionist | Ferdinand de Rothschild | 4,723 | 73.8 | +42.5 | |
| Liberal | Charles Durant Hodgson[20] | 1,680 | 26.2 | −39.0 | |
| Majority | 3,043 | 47.6 | N/A | ||
| Turnout | 6,403 | 60.8 | −18.9 | ||
| Registered electors | 10,535 | ||||
| Liberal Unionist gain from Liberal | Swing | +40.8 | |||
org.jpg)
| Party | Candidate | Votes | % | ± | |
|---|---|---|---|---|---|
| Liberal | Ferdinand de Rothschild | 5,476 | 65.2 | −7.5 | |
| Conservative | Frederick Charsley | 2,624 | 31.3 | +4.0 | |
| Independent Liberal | Charles James Clarke | 296 | 3.5 | N/A | |
| Majority | 2,852 | 33.9 | +26.5 | ||
| Turnout | 8,396 | 79.7 | +14.1 (est) | ||
| Registered electors | 10,535 | ||||
| Liberal hold | Swing | −5.8 | |||
| Party | Candidate | Votes | % | ± | |
|---|---|---|---|---|---|
| Liberal | Ferdinand de Rothschild | 2,353 | 62.4 | −10.3 | |
| Conservative | William Graham[24] | 1,416 | 37.6 | +10.3 | |
| Majority | 937 | 24.9 | +17.5 | ||
| Turnout | 3,769 | 84.3 | +18.7 (est) | ||
| Registered electors | 4,473 | ||||
| Liberal hold | Swing | −10.3 | |||
- Caused by Rothschild's elevation to the peerage, becoming Lord Rothschild.
| Party | Candidate | Votes | % | ± | |
|---|---|---|---|---|---|
| Liberal | Nathan Rothschild | 2,111 | 38.1 | −0.8 | |
| Liberal | George W. E. Russell | 1,919 | 34.6 | +9.3 | |
| Conservative | Samuel George Smith | 1,511 | 27.3 | −8.6 | |
| Majority | 408 | 7.4 | +4.4 | ||
| Turnout | 2,771 (est) | 65.6 (est) | +9.9 | ||
| Registered electors | 4,228 | ||||
| Liberal hold | Swing | +3.5 | |||
| Liberal gain from Conservative | Swing | +6.8 | |||
Elections in the 1870s
| Party | Candidate | Votes | % | ± | |
|---|---|---|---|---|---|
| Liberal | Nathan Rothschild | 1,761 | 38.9 | −3.5 | |
| Conservative | Samuel George Smith | 1,624 | 35.9 | +0.8 | |
| Lib-Lab | George Howell | 1,144 | 25.3 | +2.8 | |
| Turnout | 2,265 (est) | 55.7 (est) | −2.4 | ||
| Registered electors | 4,064 | ||||
| Majority | 137 | 3.0 | −4.3 | ||
| Liberal hold | Swing | −2.5 | |||
| Majority | 480 | 10.6 | −2.0 | ||
| Conservative hold | Swing | −0.3 | |||
Elections in the 1860s
| Party | Candidate | Votes | % | ± | |
|---|---|---|---|---|---|
| Liberal | Nathan Rothschild | 1,772 | 42.4 | N/A | |
| Conservative | Samuel George Smith | 1,468 | 35.1 | N/A | |
| Lib-Lab | George Howell | 942 | 22.5 | N/A | |
| Turnout | 2,091 (est) | 58.1 (est) | N/A | ||
| Registered electors | 3,602 | ||||
| Majority | 304 | 7.3 | N/A | ||
| Liberal hold | Swing | N/A | |||
| Majority | 526 | 12.6 | N/A | ||
| Conservative hold | Swing | N/A | |||
| Party | Candidate | Votes | % | ± | |
|---|---|---|---|---|---|
| Liberal | Nathan Rothschild | Unopposed | |||
| Conservative | Samuel George Smith | Unopposed | |||
| Registered electors | 1,225 | ||||
| Liberal gain from Conservative | |||||
| Conservative hold | |||||
Elections in the 1850s
| Party | Candidate | Votes | % | ± | |
|---|---|---|---|---|---|
| Conservative | Thomas Bernard | 552 | 34.0 | +15.6 | |
| Conservative | Samuel George Smith | 535 | 33.0 | +14.6 | |
| Liberal | Thomas Frederick Charles Vernon Wentworth[25] | 534 | 33.0 | −30.2 | |
| Majority | 1 | 0.0 | −3.0 | ||
| Turnout | 1,079 (est) | 82.7 (est) | +24.0 | ||
| Registered electors | 1,304 | ||||
| Conservative hold | Swing | +15.4 | |||
| Conservative gain from Liberal | Swing | +14.9 | |||
- On the original count, both Smith and Wentworth received 535 votes, meaning there were three MPs elected. However, after scrutiny, Wentworth lost one vote and was declared unduly elected on 2 August 1859.[26]
| Party | Candidate | Votes | % | ± | |
|---|---|---|---|---|---|
| Conservative | Thomas Bernard | 546 | 36.7 | −8.1 | |
| Whig | Richard Bethell | 501 | 33.7 | +7.0 | |
| Radical | Austen Henry Layard | 439 | 29.5 | +1.1 | |
| Turnout | 743 (est) | 58.7 (est) | −10.6 | ||
| Registered electors | 1,266 | ||||
| Majority | 45 | 3.0 | N/A | ||
| Conservative gain from Radical | Swing | −2.6 | |||
| Majority | 62 | 4.2 | +0.2 | ||
| Whig hold | Swing | +5.5 | |||
| Party | Candidate | Votes | % | ± | |
|---|---|---|---|---|---|
| Whig | Richard Bethell | Unopposed | |||
| Whig hold | |||||
- Caused by Bethell's appointment as Attorney General for England and Wales
| Party | Candidate | Votes | % | ± | |
|---|---|---|---|---|---|
| Whig | Richard Bethell | Unopposed | |||
| Whig hold | |||||
- Caused by Bethell's appointment as Solicitor General for England and Wales
| Party | Candidate | Votes | % | ± | |
|---|---|---|---|---|---|
| Radical | Austen Henry Layard | 558 | 28.4 | ||
| Whig | Richard Bethell | 525 | 26.7 | ||
| Conservative | Augustus Frederick Bayford | 447 | 22.7 | ||
| Conservative | John Temple West[27] | 435 | 22.1 | ||
| Turnout | 983 (est) | 69.3 (est) | |||
| Registered electors | 1,417 | ||||
| Majority | 33 | 1.7 | |||
| Radical gain from Conservative | Swing | ||||
| Majority | 78 | 4.0 | |||
| Whig hold | Swing | ||||
| Party | Candidate | Votes | % | ± | |
|---|---|---|---|---|---|
| Whig | Richard Bethell | 544 | 51.2 | ||
| Conservative | William Ferrand[28] | 518 | 48.8 | ||
| Majority | 26 | 2.4 | |||
| Turnout | 1,062 | 70.2 | |||
| Registered electors | 1,512 | ||||
| Whig hold | Swing | ||||
- Caused by the 1850 by-election being declared void on petition due to treating and bribery.[29]
| Party | Candidate | Votes | % | ± | |
|---|---|---|---|---|---|
| Whig | Frederick Calvert | 499 | 77.2 | ||
| Whig | John Houghton[30] | 147 | 22.8 | ||
| Majority | 352 | 54.5 | |||
| Turnout | 646 | 42.7 | |||
| Registered electors | 1,512 | ||||
| Whig hold | Swing | ||||
- Caused by Nugent-Grenville's death. Houghton retired before polling.[31]
See also
Notes and references
- Notes
- ↑ This is currently still a county constituency, so-called for the purposes of election expenses and type of returning officer. Elections are held at least every five years.
- References
- ↑ "Usual Resident Population, 2011". Neighbourhood Statistics. Office for National Statistics. Retrieved 26 January 2015.
- ↑ "Electorate Figures – Boundary Commission for England". 2015 Electorate Figures. Boundary Commission for England. 29 April 2015. Retrieved 11 May 2015.
- ↑ List of Conservative MPs elected in 2015 by % majority UK Political.info. Retrieved 2017-01-29
- ↑ Unemployment claimants by constituency The Guardian
- ↑ BBC News – latest house price averages Retrieved 2013-07-17
- 1 2 3 Leigh Rayment's Historical List of MPs – Constituencies beginning with "A" (part 3)
- ↑ The Norfolk Chronicle. 21 December 1850. p. 2 https://www.britishnewspaperarchive.co.uk/viewer/bl/0000244/18501221/009/0002. Retrieved 7 April 2018 – via British Newspaper Archive. (Subscription required (help)). Missing or empty
|title=(help) - ↑ "The Aylesbury Election". Bucks Herald. 28 December 1850. p. 4. Retrieved 7 April 2018 – via British Newspaper Archive. (Subscription required (help)).
- ↑ Hawkins, Angus (2008). "War and Peace: 1855-1858". The Forgotten Prime Minister: The 14th Earl of Derby. Oxford: Oxford University Press. p. 156. ISBN 9780199204403. Retrieved 7 April 2018.
- ↑ Marx, Karl. "The Paper Tax.—The Emperor's Letter". p. Aug 7, 1860. Retrieved 7 April 2018.
- ↑ Bonakdarian, Ansour (2006). Britain and the Iranian Constitutional Revolution of 1906-1911: Foreign Policy, Imperialism, and Dissent (First ed.). Syracuse: Syracuse University Press. p. 8. ISBN 0815630425. Retrieved 7 April 2018.
- ↑ Long, Renata Eley (2015). "Family and Foreign Office". In the Shadow of the Alabama: The British Foreign Office and the American Civil War. Annapolis: Naval Institute Press. p. 5. ISBN 9781612518374. Retrieved 7 April 2018.
- ↑ "Election Data 2015". Electoral Calculus. Archived from the original on 17 October 2015. Retrieved 17 October 2015.
- ↑ "News – AVDC".
- ↑ "Election Data 2010". Electoral Calculus. Archived from the original on 26 July 2013. Retrieved 17 October 2015.
- ↑ "BBC NEWS – Election 2010 – Aylesbury". BBC News.
- ↑ "Archived copy". Archived from the original on 15 May 2010. Retrieved 2010-05-29.
- ↑ "Politics Resources". Election 1992. Politics Resources. 9 April 1992. Retrieved 6 Dec 2010.
- 1 2 3 4 5 6 7 8 9 Craig, FWS, ed. (1974). British Parliamentary Election Results: 1885-1918. London: Macmillan Press. ISBN 9781349022984.
- ↑ "The General Election". Reading Mercury. 17 Jul 1886. p. 4. Retrieved 23 November 2017.
- ↑ The Liberal Year Book, 1907
- ↑ Debrett's House of Commons & Judicial Bench, 1886
- 1 2 3 4 5 6 7 8 9 10 11 12 Craig, F. W. S., ed. (1977). British Parliamentary Election Results 1832-1885 (e-book)
|format=requires|url=(help) (1st ed.). London: Macmillan Press. ISBN 978-1-349-02349-3. - ↑ "Forthcoming Aylesbury". The Globe. 27 Jun 1885. p. 5. Retrieved 23 November 2017.
- ↑ "The Aylesbury Election". Bucks Herald. 16 April 1859. p. 5. Retrieved 7 April 2018 – via British Newspaper Archive. (Subscription required (help)).
- ↑ Leigh Rayment's Historical List of MPs – Constituencies beginning with "A" (part 3)
- ↑ "Election Intelligence". London Evening Standard. 19 April 1852. p. 3. Retrieved 7 April 2018 – via British Newspaper Archive. (Subscription required (help)).
- ↑ "Mr. Ferrand at Aylesbury". Bucks Herald. 5 April 1851. p. 4. Retrieved 7 April 2018 – via British Newspaper Archive. (Subscription required (help)).
- ↑ "Latest News". Leamington Spa Courier. 5 April 1851. p. 3. Retrieved 7 April 2018 – via British Newspaper Archive. (Subscription required (help)).
- ↑ "Aylesbury Election". London Daily News. 28 December 1850. p. 3. Retrieved 7 April 2018 – via British Newspaper Archive. (Subscription required (help)).
- ↑ "Aylesbury Election". Northampton Mercury. 14 December 1850. p. 3. Retrieved 7 April 2018 – via British Newspaper Archive. (Subscription required (help)).
Sources
- Iain Dale, ed. (2003). The Times House of Commons 1929, 1931, 1935. Politico's (reprint). ISBN 1-84275-033-X.
- The Times House of Commons 1945. The Times. 1945.
- The Times House of Commons 1950. The Times. 1950.
- The Times House of Commons 1955. The Times. 1955.
- British Parliamentary Election Results 1885–1918, compiled and edited by F.W.S. Craig (Macmillan Press 1974)
- British Parliamentary Election Results 1918–1949, compiled and edited by F.W.S. Craig (Macmillan Press, revised edition 1977)
| Towns (component areas and hamlets) | 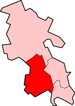 | |
|---|---|---|
| Other civil parishes (component villages and hamlets) |
| |
| Former districts and boroughs | ||
| Former constituencies | ||