Chichester (UK Parliament constituency)
Coordinates: 50°50′11″N 0°46′45″W / 50.83652°N 0.77918°W
| Chichester | |
|---|---|
|
County constituency for the House of Commons | |
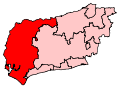 Boundary of Chichester in West Sussex for the 2007 general election. | |
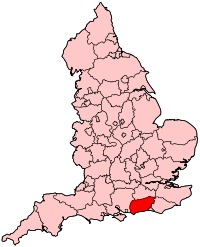 Location of West Sussex within England. | |
| County | West Sussex |
| Population | 104,374 (2011 census)[1] |
| Electorate | 84,991 (December 2010)[2] |
| Major settlements | Chichester, Midhurst, Selsey and West Wittering |
| Current constituency | |
| Created | 1295 |
| Member of parliament | Gillian Keegan (Conservative) |
| Number of members |
1295–1868: Two 1868–: One |
| Overlaps | |
| European Parliament constituency | South East England |
Chichester is a constituency[n 1] in West Sussex, represented in the House of Commons of the UK Parliament since 2017 by Gillian Keegan of the Conservative Party.[n 2]
History
Chichester centres on the small medieval cathedral city by the South Downs National Park and is one of the oldest constituencies in the UK having been created when commoners were first called to the Model Parliament in 1295 as one of the original Parliamentary boroughs returning two members. The seat has sent one member since 1868, by the Reform Act 1867.
In its various forms, Chichester has been a Conservative stronghold since 1924.
Boundaries
1885-1918: The Municipal Borough of Chichester, the Sessional Divisions of Arundel and Chichester, and part of the Sessional Division of Steyning.
1918-1950: The Municipal Boroughs of Arundel and Chichester, the Urban Districts of Bognor and Littlehampton, and the Rural Districts of East Preston, Midhurst, Petworth, Westbourne, and Westhampnett.
1950-1974: The Municipal Borough of Chichester, the Urban District of Bognor Regis, and the Rural District of Chichester.
1974-1983: The Municipal Borough of Chichester, the Rural Districts of Midhurst and Petworth, and part of the Rural District of Chichester.
1983-1997: The District of Chichester. The constituency boundaries remained unchanged.
1997-2010: All the wards of the District of Chichester except the Bury, Plaistow and Wisborough Green wards.
2010-present: The District of Chichester wards of Bosham, Boxgrove, Chichester East, Chichester North, Chichester South, Chichester West, Donnington, Easebourne, East Wittering, Fernhurst, Fishbourne, Funtington, Harting, Lavant, Midhurst, North Mundham, Plaistow, Rogate, Selsey North, Selsey South, Sidlesham, Southbourne, Stedham, Tangmere, West Wittering, and Westbourne.
The constituency is based in the western portion of West Sussex, centred on the city of Chichester and covers the majority of the Chichester district. Other towns in the constituency include Midhurst and Selsey.
Prior to the 1974 redistribution, Chichester was a much more compact constituency, taking in the eastern towns of Arundel and Bognor Regis at various times, but the greater growth in population of other seats nationally, including in Sussex settlements of Crawley, Horsham and Brighton meant that the constituency was expanded to the north to give it equal population.
Constituency profile
This large, predominantly rural constituency runs from the West Sussex border with Surrey, through the South Downs, to the seaside resorts of Selsey and The Witterings. The small cathedral city of Chichester and Georgian market town of Midhurst are the main population centres. There is a cluster of settlements near the Hampshire border with Havant, in the west. There are a few pockets of deprivation on the outskirts of Chichester, with a decent Labour vote in the Chichester West ward, and also in Midhurst. The seat has been Conservative since 1924 and their candidate's present 55.3% of the vote is close to the average polled since 1983. The closest election since 1983 has been the 1997 general election, where a Liberal Democrat gained 29% of the vote. The best performances by a Labour candidates were in 2001 and 2017, with 21.4% and 22.4% of the vote, respectively. In terms of the fourth party since 2001, the three general elections to 2010 saw an increase in support for the UK Independence Party to their highest level to date, 6.8%.
Members of Parliament
MPs 1295–1660
- Constituency created 1295
MPs 1660–1868
MPs since 1868
Elections
Elections in the 2010s
| Party | Candidate | Votes | % | ± | |
|---|---|---|---|---|---|
| Conservative | Gillian Keegan | 36,032 | 60.1 | +2.5 | |
| Labour | Mark Farwell[17] | 13,411 | 22.4 | +10.2 | |
| Liberal Democrat | Jonathan Brown[18] | 6,749 | 11.3 | +2.7 | |
| Green | Heather Barrie | 1,992 | 3.3 | -3.2 | |
| UKIP | Andrew Moncreiff[19] | 1,650 | 2.8 | -12.2 | |
| Patria | Andrew Emerson | 84 | 0.1 | -0.1 | |
| Majority | 22,621 | 37.7 | -5.0 | ||
| Turnout | 60,047[2] | 70.65 | +2.25 | ||
| Conservative hold | Swing | ||||
| Party | Candidate | Votes | % | ± | |
|---|---|---|---|---|---|
| Conservative | Andrew Tyrie | 32,953 | 57.7 | +2.3 | |
| UKIP | Andrew Moncreiff[19] | 8,540 | 14.9 | +8.1 | |
| Labour | Mark Farwell[21] | 6,933 | 12.1 | +1.7 | |
| Liberal Democrat | Andrew Smith[22] | 4,865 | 8.5 | −18.9 | |
| Green | Jasper Richmond[23] | 3,742 | 6.5 | N/A | |
| Patria | Andrew Emerson | 106 | 0.2 | N/A | |
| Majority | 24,413 | 42.7 | +14.7 | ||
| Turnout | 57,139 | 68.4 | -1.0 | ||
| Conservative hold | Swing | −2.9 | |||
| Party | Candidate | Votes | % | ± | |
|---|---|---|---|---|---|
| Conservative | Andrew Tyrie | 31,427 | 55.3 | +7.4 | |
| Liberal Democrat | Martin Lury | 15,550 | 27.4 | −0.3 | |
| Labour | Simon Holland | 5,937 | 10.5 | −8.1 | |
| UKIP | Andrew Moncreiff | 3,873 | 6.8 | +1.0 | |
| Majority | 15,877 | 28.0 | |||
| Turnout | 56,787 | 69.7 | +4.5 | ||
| Conservative hold | Swing | +3.8 | |||
Elections in the 2000s
| Party | Candidate | Votes | % | ± | |
|---|---|---|---|---|---|
| Conservative | Andrew Tyrie | 25,302 | 48.3 | +1.3 | |
| Liberal Democrat | Alan Hilliar | 14,442 | 27.6 | +3.5 | |
| Labour | Jonathan Austin | 9,632 | 18.4 | −3.0 | |
| UKIP | Douglas Denny | 3,025 | 5.8 | +1.0 | |
| Majority | 10,860 | 20.7 | |||
| Turnout | 52,401 | 66.6 | +2.8 | ||
| Conservative hold | Swing | −1.1 | |||
| Party | Candidate | Votes | % | ± | |
|---|---|---|---|---|---|
| Conservative | Andrew Tyrie | 23,320 | 47.0 | +0.6 | |
| Liberal Democrat | Lynne Ravenscroft | 11,965 | 24.1 | −4.8 | |
| Labour | Celia Barlow | 10,627 | 21.4 | +4.2 | |
| UKIP | Douglas Denny | 2,380 | 4.8 | +3.4 | |
| Green | Gavin Graham | 1,292 | 2.6 | N/A | |
| Majority | 11,355 | 22.9 | |||
| Turnout | 49,584 | 63.8 | -10.8 | ||
| Conservative hold | Swing | ||||
Elections in the 1990s
| Party | Candidate | Votes | % | ± | |
|---|---|---|---|---|---|
| Conservative | Andrew Tyrie | 25,895 | 46.4 | −12.9 | |
| Liberal Democrat | Peter Gardiner | 16,161 | 29.0 | +2.4 | |
| Labour | Charlie Smith | 9,605 | 17.2 | +5.9 | |
| Referendum | Douglas Denny | 3,318 | 5.9 | N/A | |
| UKIP | J.G. Rix | 800 | 1.4 | N/A | |
| Majority | 9,734 | 17.5 | |||
| Turnout | 55,779 | 74.6 | |||
| Conservative hold | Swing | ||||
This constituency underwent boundary changes between the 1992 and 1997 general elections and thus change in share of vote is based on a notional calculation.
| Party | Candidate | Votes | % | ± | |
|---|---|---|---|---|---|
| Conservative | Anthony Nelson | 37,906 | 59.3 | −2.5 | |
| Liberal Democrat | Peter F. Gardiner | 17,019 | 26.6 | −1.7 | |
| Labour | Diane M. Andrewes | 7,192 | 11.3 | +3.4 | |
| Green | Eric Paine | 876 | 1.4 | −0.6 | |
| Liberal | JL Weights | 643 | 1.0 | +1.0 | |
| Natural Law | JL Jackson | 238 | 0.4 | +0.4 | |
| Majority | 20,887 | 32.7 | −0.8 | ||
| Turnout | 63,874 | 77.8 | +3.3 | ||
| Conservative hold | Swing | -0.4 | |||
Elections in the 1980s
| Party | Candidate | Votes | % | ± | |
|---|---|---|---|---|---|
| Conservative | Anthony Nelson | 37,274 | 61.8 | −1.9 | |
| SDP–Liberal Alliance (Liberal) | Peter Weston | 17,097 | 28.3 | +0.7 | |
| Labour | David Morrison | 4,751 | 7.9 | +0.7 | |
| Green | Ian Bagnall | 1,196 | 2.0 | +0.5 | |
| Majority | 20,177 | 33.5 | |||
| Turnout | 60,318 | 74.4 | +2.3 | ||
| Conservative hold | Swing | ||||
| Party | Candidate | Votes | % | ± | |
|---|---|---|---|---|---|
| Conservative | Anthony Nelson | 35,482 | 63.7 | ||
| SDP–Liberal Alliance (Social Democratic) | H. Gibson | 15,365 | 27.6 | ||
| Labour | R.H. Rhodes | 3,995 | 7.2 | ||
| Ecology | Jonathan Sherlock | 838 | 1.5 | ||
| Majority | 20,117 | 36.1 | |||
| Turnout | 55,680 | 72.1 | |||
| Conservative hold | Swing | ||||
Elections in the 1970s
| Party | Candidate | Votes | % | ± | |
|---|---|---|---|---|---|
| Conservative | Anthony Nelson | 34,696 | 62.29 | ||
| Liberal | J Rix | 10,920 | 19.60 | ||
| Labour | GN Cooke | 8,569 | 15.38 | ||
| United Country | E Iremonger | 863 | 1.55 | ||
| Ecology | N Bagnall | 656 | 1.18 | ||
| Majority | 23,776 | 42.68 | |||
| Turnout | 75.56 | ||||
| Conservative hold | Swing | ||||
| Party | Candidate | Votes | % | ± | |
|---|---|---|---|---|---|
| Conservative | Anthony Nelson | 26,942 | 52.51 | ||
| Liberal | GA Jeffs | 15,601 | 30.41 | ||
| Labour | NJM Smith | 8,767 | 17.09 | ||
| Majority | 11,341 | 22.10 | |||
| Turnout | 73.54 | ||||
| Conservative hold | Swing | ||||
| Party | Candidate | Votes | % | ± | |
|---|---|---|---|---|---|
| Conservative | Christopher Chataway | 29,127 | 53.25 | ||
| Liberal | G Jeffs | 17,714 | 32.39 | ||
| Labour | NJM Smith | 7,854 | 14.36 | ||
| Majority | 11,413 | 20.87 | |||
| Turnout | 79.12 | ||||
| Conservative hold | Swing | ||||
| Party | Candidate | Votes | % | ± | |
|---|---|---|---|---|---|
| Conservative | Christopher Chataway | 38,120 | 62.60 | ||
| Labour | Neville Sandelson | 12,574 | 20.65 | ||
| Liberal | Denys Gilbert Kinsella | 10,205 | 16.76 | ||
| Majority | 25,546 | 41.95 | |||
| Turnout | 60,899 | 69.91 | |||
| Conservative hold | Swing | +5.0 | |||
Elections in the 1960s
| Party | Candidate | Votes | % | ± | |
|---|---|---|---|---|---|
| Conservative | Christopher Chataway | 31,966 | 74.16 | +17.00 | |
| Liberal | Denys Gilbert Kinsella | 5,879 | 13.64 | -4.07 | |
| Labour | John White | 5,257 | 12.20 | -12.93 | |
| Majority | 26,087 | 60.52 | |||
| Turnout | 43,102 | ||||
| Conservative hold | Swing | ||||
| Party | Candidate | Votes | % | ± | |
|---|---|---|---|---|---|
| Conservative | Walter Loveys | 31,358 | 57.16 | ||
| Labour | David J Burnett | 13,784 | 25.13 | ||
| Liberal | Patrick J Collins | 9,714 | 17.71 | ||
| Majority | 17,574 | 32.04 | |||
| Turnout | 54,856 | 73.19 | |||
| Conservative hold | Swing | +3.15 | |||
| Party | Candidate | Votes | % | ± | |
|---|---|---|---|---|---|
| Conservative | Walter Loveys_ | 30,225 | 57.80 | ||
| Liberal | Denys Gilbert Kinsella | 11,912 | 22.78 | ||
| Labour | Adrian J Cohen | 10,155 | 19.42 | ||
| Majority | 18,313 | 35.02 | |||
| Turnout | 52,292 | 74.03 | |||
| Conservative hold | Swing | ||||
Elections in the 1950s
| Party | Candidate | Votes | % | ± | |
|---|---|---|---|---|---|
| Conservative | Walter Loveys | 30,755 | 65.14 | ||
| Labour | John S Spooner | 9,546 | 20.22 | ||
| Liberal | Jackson Newman | 6,913 | 14.64 | ||
| Majority | 21,209 | 44.92 | |||
| Turnout | 47,214 | 73.82 | |||
| Conservative hold | Swing | ||||
| Party | Candidate | Votes | % | ± | |
|---|---|---|---|---|---|
| Conservative | Walter Loveys | 23,158 | 70.90 | +0.11 | |
| Labour | William Edgar Simpkins | 9,504 | 29.10 | -0.11 | |
| Majority | 13,654 | 41.80 | +0.23 | ||
| Turnout | 32,662 | ||||
| Conservative hold | Swing | ||||
| Party | Candidate | Votes | % | ± | |
|---|---|---|---|---|---|
| Conservative | Lancelot Joynson-Hicks | 30,857 | 70.79 | ||
| Labour | Mervyn Jones | 12,735 | 29.21 | ||
| Majority | 18,122 | 41.57 | |||
| Turnout | 43,592 | 71.80 | |||
| Conservative hold | Swing | ||||
| Party | Candidate | Votes | % | ± | |
|---|---|---|---|---|---|
| Conservative | Lancelot Joynson-Hicks | 32,166 | 69.72 | ||
| Labour | David George Packham | 13,971 | 30.28 | ||
| Majority | 18,195 | 39.44 | |||
| Turnout | 77.32 | ||||
| Conservative hold | Swing | ||||
| Party | Candidate | Votes | % | ± | |
|---|---|---|---|---|---|
| Conservative | Lancelot Joynson-Hicks | 29,106 | 62.42 | ||
| Labour | David George Packham | 12,614 | 27.05 | ||
| Liberal | Ronald Vincent Gibson | 4,911 | 10.53 | ||
| Majority | 16,492 | 35.37 | |||
| Turnout | 80.47 | ||||
| Conservative hold | Swing | ||||
Elections in the 1940s
| Party | Candidate | Votes | % | ± | |
|---|---|---|---|---|---|
| Conservative | Lancelot Joynson-Hicks | 30,989 | 54.6 | ||
| Labour | Rosalie Francesca Chamberlayne | 13,670 | 24.1 | ||
| Liberal | Gerald Kidd | 11,345 | 20.0 | ||
| National Independent | MH Woodard | 625 | 1.1 | ||
| Democratic | Paul Tracy Carter | 118 | 0.2 | ||
| Majority | 17,319 | 30.5 | |||
| Turnout | 68.24 | ||||
| Conservative hold | Swing | ||||
| Party | Candidate | Votes | % | ± | |
|---|---|---|---|---|---|
| Conservative | Lancelot Joynson-Hicks | 15,634 | 58.1 | ||
| Independent Progressive | Gerald Kidd | 10,564 | |||
| Independent | A. A. W. Tribe | 706 | |||
| Majority | 5,070 | ||||
| Turnout | 29.2 | ||||
| Conservative hold | Swing | ||||
General Election 1939/40:
Another general election was required to take place before the end of 1940. The political parties had been making preparations for an election to take place from 1939 and by the end of this year, the following candidates had been selected;
- Conservative: John Courtauld
- Labour: E A Weston
- British Union: Charles Edward Hudson
Elections in the 1930s
| Party | Candidate | Votes | % | ± | |
|---|---|---|---|---|---|
| Conservative | John Courtauld | 37,882 | 78.32 | ||
| Labour | Claude William Higgins | 10,484 | 21.7 | ||
| Majority | 27,398 | 56.65 | |||
| Turnout | 59.5 | ||||
| Conservative hold | Swing | ||||
| Party | Candidate | Votes | % | ± | |
|---|---|---|---|---|---|
| Conservative | John Courtauld | 43,756 | 87.79 | ||
| Labour | Claude William Higgins | 6,085 | 12.21 | ||
| Majority | 37,671 | 75.58 | |||
| Turnout | 68.51 | ||||
| Conservative hold | Swing | ||||
Elections in the 1920s
| Party | Candidate | Votes | % | ± | |
|---|---|---|---|---|---|
| Unionist | John Courtauld | 26,278 | 60.2 | +0.9 | |
| Liberal | John Freeman Dunn | 17,398 | 39.8 | +4.2 | |
| Majority | 8,880 | 20.4 | −3.3 | ||
| Turnout | 43,676 | 64.9 | −7.5 | ||
| Registered electors | 67,276 | ||||
| Unionist hold | Swing | −1.7 | |||
| Party | Candidate | Votes | % | ± | |
|---|---|---|---|---|---|
| Unionist | John Courtauld | 20,710 | 59.3 | +11.4 | |
| Liberal | Charles Rudkin | 12,416 | 35.6 | −16.5 | |
| Labour | Richard Henry Kennard Hope | 1,765 | 5.1 | N/A | |
| Majority | 8,294 | 23.8 | N/A | ||
| Turnout | 34,891 | 72.4 | +12.2 | ||
| Registered electors | 48,170 | ||||
| Unionist gain from Liberal | Swing | +14.0 | |||
| Party | Candidate | Votes | % | ± | |
|---|---|---|---|---|---|
| Liberal | Charles Rudkin | 14,513 | 52.1 | N/A | |
| Unionist | William Bird | 13,348 | 47.9 | −26.4 | |
| Majority | 1,165 | 4.2 | N/A | ||
| Turnout | 27,861 | 60.2 | +2.3 | ||
| Registered electors | 46,257 | ||||
| Liberal gain from Unionist | Swing | N/A | |||
| Party | Candidate | Votes | % | ± | |
|---|---|---|---|---|---|
| Unionist | William Bird | 19,494 | 74.3 | +5.9 | |
| Labour | Richard Henry Kennard Hope | 6,752 | 25.7 | −5.9 | |
| Majority | 12,742 | 48.6 | +11.8 | ||
| Turnout | 26,246 | 57.9 | +7.6 | ||
| Registered electors | 45,364 | ||||
| Unionist hold | Swing | +5.9 | |||
| Party | Candidate | Votes | % | ± | |
|---|---|---|---|---|---|
| Coalition Unionist | William Bird | Unopposed | |||
| Unionist hold | |||||
Elections in the 1910s
| Party | Candidate | Votes | % | ± | |
|---|---|---|---|---|---|
| C | Unionist | Edmund Talbot | 14,491 | 68.4 | |
| Labour | Frederick Ernest Green | 6,705 | 31.6 | ||
| Majority | 7,786 | 36.8 | |||
| Turnout | 21,196 | 50.3 | |||
| Registered electors | 42,131 | ||||
| Unionist hold | Swing | ||||
| C indicates candidate endorsed by the coalition government. | |||||
General Election 1914/15:
Another General Election was required to take place before the end of 1915. The political parties had been making preparations for an election to take place and by July 1914, the following candidates had been selected;
- Unionist: Edmund Talbot
- Liberal:
| Party | Candidate | Votes | % | ± | |
|---|---|---|---|---|---|
| Conservative | Edmund Talbot | 5,900 | 66.4 | 0.0 | |
| Liberal | Richard Reiss | 2,985 | 33.6 | 0.0 | |
| Majority | 2,915 | 32.8 | 0.0 | ||
| Turnout | 73.1 | -8.6 | |||
| Conservative hold | Swing | 0.0 | |||
| Party | Candidate | Votes | % | ± | |
|---|---|---|---|---|---|
| Conservative | Edmund Talbot | 6,589 | 66.4 | +10.0 | |
| Liberal | Richard Reiss | 3,338 | 33.6 | -10.0 | |
| Majority | 3,251 | 32.8 | +20.0 | ||
| Turnout | 81.7 | -0.4 | |||
| Conservative hold | Swing | +10.0 | |||
Elections in the 1900s
| Party | Candidate | Votes | % | ± | |
|---|---|---|---|---|---|
| Conservative | Edmund Talbot | 5,197 | 56.4 | N/A | |
| Liberal | John Ernest Allen | 4,023 | 43.6 | N/A | |
| Majority | 1,174 | 12.8 | N/A | ||
| Turnout | 9,220 | 82.1 | N/A | ||
| Registered electors | 11,225 | ||||
| Conservative hold | Swing | N/A | |||
| Party | Candidate | Votes | % | ± | |
|---|---|---|---|---|---|
| Conservative | Edmund Talbot | 4,174 | 52.6 | N/A | |
| Liberal | John Ernest Allen | 3,762 | 47.4 | N/A | |
| Majority | 412 | 5.2 | N/A | ||
| Turnout | 7,936 | 73.6 | N/A | ||
| Registered electors | 10,784 | ||||
| Conservative hold | Swing | N/A | |||
| Party | Candidate | Votes | % | ± | |
|---|---|---|---|---|---|
| Conservative | Edmund Talbot | Unopposed | |||
| Conservative hold | |||||
Elections in the 1890s
| Party | Candidate | Votes | % | ± | |
|---|---|---|---|---|---|
| Conservative | Edmund Talbot | Unopposed | |||
| Conservative hold | |||||
| Party | Candidate | Votes | % | ± | |
|---|---|---|---|---|---|
| Conservative | Edmund Talbot | Unopposed | |||
| Conservative hold | |||||
| Party | Candidate | Votes | % | ± | |
|---|---|---|---|---|---|
| Conservative | Walter Gordon-Lennox | 4,236 | 64.2 | N/A | |
| Liberal | Herbert J. Reid | 2,361 | 35.8 | N/A | |
| Majority | 1,875 | 28.4 | N/A | ||
| Turnout | 6,597 | 72.1 | N/A | ||
| Registered electors | 9,146 | ||||
| Conservative hold | Swing | N/A | |||
| Party | Candidate | Votes | % | ± | |
|---|---|---|---|---|---|
| Conservative | Walter Gordon-Lennox | Unopposed | |||
| Conservative hold | |||||
Elections in the 1880s
| Party | Candidate | Votes | % | ± | |
|---|---|---|---|---|---|
| Conservative | Walter Gordon-Lennox | Unopposed | |||
| Conservative hold | |||||
- Caused by Gordon-Lennox's resignation.
| Party | Candidate | Votes | % | ± | |
|---|---|---|---|---|---|
| Conservative | Charles Gordon-Lennox | Unopposed | |||
| Conservative hold | |||||
| Party | Candidate | Votes | % | ± | |
|---|---|---|---|---|---|
| Conservative | Charles Gordon-Lennox | 4,760 | 65.8 | +9.5 | |
| Liberal | Frederick Waymouth Gibbs | 2,470 | 34.2 | −9.5 | |
| Majority | 2,290 | 31.6 | +19.0 | ||
| Turnout | 7,230 | 85.0 | +1.4 | ||
| Registered electors | 8,502 | ||||
| Conservative hold | Swing | +9.5 | |||
| Party | Candidate | Votes | % | ± | |
|---|---|---|---|---|---|
| Conservative | Henry Gordon-Lennox | 602 | 56.3 | N/A | |
| Liberal | Frederick Waymouth Gibbs | 467 | 43.7 | N/A | |
| Majority | 135 | 12.6 | N/A | ||
| Turnout | 1,069 | 83.6 | N/A | ||
| Registered electors | 1,279 | ||||
| Conservative hold | Swing | N/A | |||
Elections in the 1870s
| Party | Candidate | Votes | % | ± | |
|---|---|---|---|---|---|
| Conservative | Henry Gordon-Lennox | Unopposed | |||
| Registered electors | 1,240 | ||||
| Conservative hold | |||||
- Caused by Lennox's appointment as First Commissioner of Works and Public Buildings
| Party | Candidate | Votes | % | ± | |
|---|---|---|---|---|---|
| Conservative | Henry Gordon-Lennox | Unopposed | |||
| Registered electors | 1,240 | ||||
| Conservative hold | |||||
Elections in the 1860s
| Party | Candidate | Votes | % | ± | |
|---|---|---|---|---|---|
| Conservative | Henry Gordon-Lennox | 603 | 58.2 | N/A | |
| Liberal | John Abel Smith | 433 | 41.8 | N/A | |
| Majority | 170 | 16.4 | N/A | ||
| Turnout | 1,036 | 86.7 | N/A | ||
| Registered electors | 1,195 | ||||
| Conservative hold | |||||
Seat reduced to one member
| Party | Candidate | Votes | % | ± | |
|---|---|---|---|---|---|
| Conservative | Henry Gordon-Lennox | Unopposed | |||
| Liberal | John Abel Smith | Unopposed | |||
| Registered electors | 562 | ||||
| Conservative hold | |||||
| Liberal hold | |||||
| Party | Candidate | Votes | % | ± | |
|---|---|---|---|---|---|
| Liberal | John Abel Smith | Unopposed | |||
| Liberal hold | |||||
- Caused by Freeland's resignation.
Elections in the 1850s
| Party | Candidate | Votes | % | ± | |
|---|---|---|---|---|---|
| Liberal | Humphrey William Freeland | 300 | 34.5 | N/A | |
| Conservative | Henry Gordon-Lennox | 288 | 33.1 | N/A | |
| Liberal | John Abel Smith | 282 | 32.4 | N/A | |
| Turnout | 579 (est) | 92.8 (est) | N/A | ||
| Registered electors | 562 | ||||
| Majority | 12 | 1.4 | N/A | ||
| Liberal hold | |||||
| Majority | 6 | 0.7 | N/A | ||
| Conservative hold | |||||
| Party | Candidate | Votes | % | ± | |
|---|---|---|---|---|---|
| Conservative | Henry Gordon-Lennox | Unopposed | |||
| Conservative hold | |||||
- Caused by Gordon-Lennox's appointment as a Lord Commissioner of the Treasury.
| Party | Candidate | Votes | % | ± | |
|---|---|---|---|---|---|
| Conservative | Henry Gordon-Lennox | Unopposed | |||
| Whig | John Abel Smith | Unopposed | |||
| Registered electors | 638 | ||||
| Conservative hold | |||||
| Whig hold | |||||
| Party | Candidate | Votes | % | ± | |
|---|---|---|---|---|---|
| Conservative | Henry Gordon-Lennox | Unopposed | |||
| Whig | John Abel Smith | Unopposed | |||
| Registered electors | 757 | ||||
| Conservative hold | |||||
| Whig hold | |||||
| Party | Candidate | Votes | % | ± | |
|---|---|---|---|---|---|
| Conservative | Henry Gordon-Lennox | Unopposed | |||
| Conservative hold | |||||
- Caused by Gordon-Lennox's appointment as a Lord Commissioner of the Treasury.
See also
Notes and references
- Notes
- ↑ A county constituency (for the purposes of election expenses and type of returning officer)
- ↑ As with all constituencies, the constituency elects one Member of Parliament (MP) by the first past the post system of election at least every five years.
- References
- ↑ "Chichester: Usual Resident Population, 2011". Neighbourhood Statistics. Office for National Statistics. Retrieved 23 February 2015.
- 1 2 "Declaration of Results". Chichester District Council. Retrieved 10 Jun 2017.
- 1 2 3 4 5 6 7 8 9 10 11 12 13 14 15 16 17 18 19 20 21 22 23 "History of Parliament". History of Parliament Trust. Retrieved 2011-11-01.
- ↑ "HORE, William (d.1448), of Chichester, Suss. - History of Parliament Online". www.historyofparliamentonline.org.
- 1 2 3 4 5 6 7 8 9 10 "History of Parliament". History of Parliament Trust. Retrieved 2011-11-01.
- 1 2 3 4 5 6 7 8 9 10 "History of Parliament". History of Parliament Trust. Retrieved 2011-11-01.
- ↑ Dictionary of National Biography, later editions, and Oxford Dictionary of National Biography.
- 1 2 3 Leigh Rayment's Historical List of MPs – Constituencies beginning with "C" (part 4)
- ↑ "John Smith". Legacies of British Slave-ownership. University College London. Retrieved 28 April 2018.
- ↑ Mosse, Richard Bartholomew (1837). The Parliamentary Guide: a concise history of the Members of both Houses, etc. p. 216. Retrieved 28 April 2018.
- ↑ Churton, Edward (1836). The Assembled Commons or Parliamentary Biographer: 1836. p. 161.
- ↑ Coohill, Joseph, ed. (October 2011). "Chapter 7. Irish Religion in British Politics: The Maynooth Difficulties for Liberal Party MPs". Parliamentary History. 30 (s2): 154–169. doi:10.1111/j.1750-0206.2011.00261.x.
- ↑ Proceedings at the Contested Election for the City of Chichester, 1830 ... copy of the poll book, speeches ... squibs and addresses. To which are added, the proceedings at the election of representatives for the County of Sussex, etc. J. Hackman. 1830. p. 38. Retrieved 28 April 2018.
- ↑ Le Pichon, Alain, ed. (2006). "February 1835". China Trade and Empire: Jardine, Matheson & Co. and the Origins of British Rule in Hong Kong 1827–1843. Oxford: Oxford University Press. p. 239. ISBN 978-0-19-726337-2. Retrieved 28 April 2018.
- ↑ "Chichester 1660-". Hansard 1803–2005. UK Parliament. Retrieved 2 February 2015.
- ↑ "Statement of Persons Nominated and Notice of Poll". Retrieved 26 May 2017.
- ↑ "General Election 2017 – Candidate List – (A – M)". Retrieved 8 May 2017.
- ↑ "Snap General Election Candidates". Retrieved 8 May 2017.
- 1 2 "People". UKIP Chichester. Archived from the original on 2015-02-12. Retrieved 12 Jan 2015.
- ↑ "Election Data 2015". Electoral Calculus. Archived from the original on 17 October 2015. Retrieved 17 October 2015.
- ↑ "Archived copy". Archived from the original on 2015-02-19. Retrieved 2015-01-25.
- ↑ "CHICHESTER 2015". electionresults.blogspot.co.uk.
- ↑ "People". Democracy Club. Retrieved 14 Mar 2015.
- ↑ "Politics Resources". Election 1992. Politics Resources. 9 April 1992. Retrieved 6 Dec 2010.
- ↑ Debrett's House of Commons & Judicial Bench, 1922
- 1 2 British Parliamentary Election Results 1885–1918, FWS Craig
- 1 2 Debrett's House of Commons & Judicial Bench, 1916
- 1 2 3 4 5 6 7 The Liberal Year Book, 1907
- 1 2 3 4 5 6 7 Craig, FWS, ed. (1974). British Parliamentary Election Results: 1885-1918. London: Macmillan Press. ISBN 9781349022984.
- ↑ "Chichester By-election". Ballymena Observer. 9 June 1905. Retrieved 8 December 2015 – via British Newspaper Archive. (Subscription required (help)).
- 1 2 3 4 5 6 Audit Bureau of Circulations Ltd– abc.org.uk
- 1 2 Debrett's House of Commons & Judicial Bench, 1901
- ↑ Debrett's House of Commons & Judicial Bench, 1886
- 1 2 3 4 5 6 7 8 9 10 11 Craig, F. W. S., ed. (1977). British Parliamentary Election Results 1832-1885 (e-book)
|format=requires|url=(help) (1st ed.). London: Macmillan Press. ISBN 978-1-349-02349-3.
- Sources
- Election result, 2010 (BBC)
- Election result, 2005 (BBC)
- Election results, 1997 – 2001 (BBC)
- Election results, 1997 – 2001 (Election Demon)
- Election results, 1983 – 1992 (Election Demon)
- Election results, 1992 – 2010 (Guardian) (UKIP result for 2001 is incorrect)
- Iain Dale, ed. (2003). The Times House of Commons 1929, 1931, 1935. Politico's (reprint). ISBN 1-84275-033-X.
- The Times House of Commons 1945. The Times. 1945.
- The Times House of Commons 1950. The Times. 1950.
- The Times House of Commons 1955. The Times. 1955.
External links
- nomis Constituency Profile for Chichester — presenting data from the ONS annual population survey and other official statistics.