Ilford South (UK Parliament constituency)
| Ilford South | |
|---|---|
|
Borough constituency for the House of Commons | |
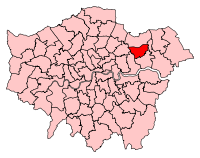 Boundary of Ilford South in Greater London. | |
| County | Greater London |
| Electorate | 86,401 (December 2010)[1] |
| Major settlements | Ilford |
| Current constituency | |
| Created | 1945 |
| Member of parliament | Mike Gapes (Labour Co-operative) |
| Number of members | One |
| Created from | Ilford |
| Overlaps | |
| European Parliament constituency | London |
Ilford South is a constituency[n 1] created in 1945 represented in the House of Commons of the UK Parliament since 1992 by Mike Gapes of the Labour and Co-operative Party.[n 2]
Constituency profile
The area comprising the seat since 1997 is denser than Ilford North and has similar population density to neighbouring seats to the south and west closer to central London. The most common housing kind by a large margin is terraced housing in the boundaries as drawn. The town of Ilford and most outlying areas are well connected by either London Underground stations or tube stations to central London and an arterial road route cuts through the area, partially segregated from adjoining buildings. Before 1900 Ilford was a market town with few commuters a situation which has changed significantly during the following century — much housing was built to rehouse people from the formerly smaller East End of London which covers a wide area to the immediate west; this urbanisation of the area was completed as part of a 20-year housing expansion in the area following the damage caused in the London Blitz.
- Political history
This constituency was created in 1945. The current MP since 1992, Mike Gapes, is the fourth Labour Party MP, each of whose tenures was interspersed or preceded by one of a Conservative MP serving the area. Despite its record of MPs elected, under Gapes' tenure Ilford South has become a very safe seat for the Labour Party; in every election since 1997 it has been won by a majority of over 20% by Labour, and in 2017 they secured over 75% of the vote in the constituency.
The 2015 result made the seat the 38th safest of Labour's 232 seats by percentage of majority.[2] The narrowest result since 1997 (inclusive) was in 2005 at a majority of 21.6%; the 2017 majority is the greatest ever achieved in the seat, at 54.9%.
Boundaries

1945–1950: The Municipal Borough of Ilford wards of Clementswood, Cranbrook, Goodmayes, Loxford, and Park.
1950–1974: The Municipal Borough of Ilford wards of Clementswood, Cranbrook, Goodmayes, Loxford, Mayfield, and Park.
1974–1983: The London Borough of Redbridge wards of Clementswood, Cranbrook, Goodmayes, Ilford, Mayfield, and Park.
1983–1997: As above substituting Ilford and Park with reshaped wards Loxford, Newbury, and Valentines.
1997–present: As above plus Chadwell and Seven Kings wards.
Members of Parliament
Election results
Elections in the 2010s
| Party | Candidate | Votes | % | ± | |
|---|---|---|---|---|---|
| Labour Co-op | Mike Gapes | 43,724 | 75.8 | +11.8 | |
| Conservative | Christopher Chapman | 12,077 | 20.9 | -5.0 | |
| Liberal Democrat | Farid Ahmed | 772 | 1.3 | -0.6 | |
| Green | Rosemary Warrington | 542 | 0.9 | -2.0 | |
| UKIP | Tariq Saeed | 477 | 0.8 | -4.4 | |
| Friends Party | Kane Khan | 65 | 0.1 | N/A | |
| Majority | 31,647 | 54.9 | +16.8 | ||
| Turnout | 57,657 | 69.9 | +13.5 | ||
| Registered electors | 82,487 | ||||
| Labour Co-op hold | Swing | +8.4 | |||
| Party | Candidate | Votes | % | ± | |
|---|---|---|---|---|---|
| Labour Co-op | Mike Gapes[7] | 33,232 | 64.0 | +14.6 | |
| Conservative | Christopher Chapman | 13,455 | 25.9 | −1.5 | |
| UKIP | Amjad Khan[8] | 2,705 | 5.2 | +3.0 | |
| Green | Rosemary Warrington[9] | 1,506 | 2.9 | +0.3 | |
| Liberal Democrat | Ashburn Holder | 1,014 | 2.0 | −15.0 | |
| Majority | 19,777 | 38.1 | +16.0 | ||
| Turnout | 51,912 | 56.4 | −1.6 | ||
| Registered electors | 91,987 | ||||
| Labour Co-op hold | Swing | +8.1 | |||
| Party | Candidate | Votes | % | ± | |
|---|---|---|---|---|---|
| Labour Co-op | Mike Gapes | 25,311 | 49.4 | +0.6 | |
| Conservative | Toby Boutle | 14,014 | 27.4 | +0.1 | |
| Liberal Democrat | Anood Al-Samerai | 8,679 | 17.0 | −3.6 | |
| Green | Wilson Chowdhry | 1,319 | 2.6 | N/A | |
| UKIP | Terry Murray | 1,132 | 2.2 | +0.6 | |
| Save King George Hospital | John Jestico | 746 | 1.5 | N/A | |
| Majority | 11,297 | 22.1 | −0.5 | ||
| Turnout | 51,201 | 58.0 | +4.4 | ||
| Registered electors | 86,220 | ||||
| Labour Co-op hold | Swing | +0.2 | |||
Elections in the 2000s
| Party | Candidate | Votes | % | ± | |
|---|---|---|---|---|---|
| Labour Co-op | Mike Gapes | 20,856 | 48.9 | −10.7 | |
| Conservative | Stephen Metcalfe | 11,628 | 27.2 | +1.5 | |
| Liberal Democrat | Matthew E. Lake | 8,761 | 20.5 | +9.2 | |
| British Public Party | Kashif Rana | 763 | 1.8 | +1.8 | |
| UKIP | Colin H. Taylor | 685 | 1.6 | −1.8 | |
| Majority | 9,228 | 21.6 | -12.3 | ||
| Turnout | 42,693 | 53.6 | −0.7 | ||
| Registered electors | 79,646 | ||||
| Labour Co-op hold | Swing | −6.1 | |||
| Party | Candidate | Votes | % | ± | |
|---|---|---|---|---|---|
| Labour Co-op | Mike Gapes | 24,619 | 59.6 | +1.1 | |
| Conservative | Suresh Kumar | 10,622 | 25.7 | −4.4 | |
| Liberal Democrat | Ralph Scott | 4,647 | 11.3 | +5.0 | |
| UKIP | Harun Khan | 1,407 | 3.4 | N/A | |
| Majority | 13,997 | 33.9 | +5.5 | ||
| Turnout | 41,295 | 54.3 | −15.9 | ||
| Registered electors | 76,025 | ||||
| Labour Co-op hold | Swing | +2.7 | |||
Elections in the 1990s
| Party | Candidate | Votes | % | ± | |
|---|---|---|---|---|---|
| Labour Co-op | Mike Gapes | 29,273 | 58.5 | +13.5 | |
| Conservative | Neil Thorne | 15,073 | 30.1 | −14.3 | |
| Liberal Democrat | Aina Khan | 3,152 | 6.3 | −3.3 | |
| Referendum | David Hodges | 1,073 | 2.1 | N/A | |
| Socialist Labour | Bruce G. Ramsey | 868 | 1.7 | N/A | |
| BNP | Aron Owens | 580 | 1.2 | N/A | |
| Majority | 14,200 | 28.4 | +27.4 | ||
| Turnout | 50,019 | 70.2 | -6.5 | ||
| Registered electors | 71,202 | ||||
| Labour Co-op hold | Swing | +16.6 | |||
| Party | Candidate | Votes | % | ± | |
|---|---|---|---|---|---|
| Labour Co-op | Mike Gapes | 19,418 | 45.4 | +7.9 | |
| Conservative | Neil Thorne | 19,016 | 44.4 | −4.0 | |
| Liberal Democrat | George G. Hogarth | 4,126 | 9.6 | −4.5 | |
| Natural Law | Nandkishore Bramachari | 269 | 0.6 | N/A | |
| Majority | 402 | 1.0 | N/A | ||
| Turnout | 42,829 | 76.7 | +4.9 | ||
| Registered electors | 55,741 | ||||
| Labour Co-op gain from Conservative | Swing | +6.0 | |||
Elections in the 1980s
| Party | Candidate | Votes | % | ± | |
|---|---|---|---|---|---|
| Conservative | Neil Thorne | 20,351 | 48.4 | +2.9 | |
| Labour | Kenneth Jones | 15,779 | 37.5 | +3.1 | |
| Liberal | Ralph Scott | 5,928 | 14.1 | −5.4 | |
| Majority | 4,572 | 10.9 | -0.2 | ||
| Turnout | 42,058 | 71.8 | +1.2 | ||
| Registered electors | 58,572 | ||||
| Conservative hold | Swing | ||||
| Party | Candidate | Votes | % | ± | |
|---|---|---|---|---|---|
| Conservative | Neil Thorne | 18,672 | 45.5 | -1.3 | |
| Labour | J.H. Hogben | 14,106 | 34.4 | -8.3 | |
| Liberal | Ralph Scott | 7,999 | 19.5 | +10.6 | |
| BNP | R.A. Martin | 235 | 0.6 | -0.9 | |
| Majority | 4,566 | 11.1 | +7.0 | ||
| Turnout | 41,012 | 70.6 | -5.3 | ||
| Registered electors | 58,208 | ||||
| Conservative hold | Swing | ||||
Elections in the 1970s
| Party | Candidate | Votes | % | ± | |
|---|---|---|---|---|---|
| Conservative | Neil Thorne | 19,290 | 46.8 | +6.55 | |
| Labour | Arnold Shaw | 17,602 | 42.7 | -2.01 | |
| Liberal | Ralph Scott | 3,664 | 8.9 | -5.72 | |
| National Front | T.C. Fitzgerald | 636 | 1.5 | N/A | |
| Majority | 1,688 | 4.1 | N/A | ||
| Turnout | 39,230 | 75.9 | +6.17 | ||
| Registered electors | 54,295 | ||||
| Conservative gain from Labour | Swing | ||||
| Party | Candidate | Votes | % | ± | |
|---|---|---|---|---|---|
| Labour | Arnold Shaw | 17,538 | 44.71 | +4.64 | |
| Conservative | Neil Thorne | 15,789 | 40.25 | +2.84 | |
| Liberal | E. Yates | 5,734 | 14.62 | -7.90 | |
| More Prosperous Britain | Tom Keen | 169 | 0.43 | N/A | |
| Majority | 1,749 | 4.46 | +1.80 | ||
| Turnout | 39,230 | 69.73 | -7.20 | ||
| Registered electors | 56,257 | ||||
| Labour hold | Swing | ||||
| Party | Candidate | Votes | % | ± | |
|---|---|---|---|---|---|
| Labour | Arnold Shaw | 17,201 | 40.07 | -2.96 | |
| Conservative | Albert Cooper | 16,058 | 37.41 | -8.84 | |
| Liberal | Gareth Wilson | 9,666 | 22.52 | +14.11 | |
| Majority | 1,143 | 2.66 | N/A | ||
| Turnout | 42,925 | 76.93 | +8.8 | ||
| Registered electors | 55,799 | ||||
| Labour gain from Conservative | Swing | ||||
| Party | Candidate | Votes | % | ± | |
|---|---|---|---|---|---|
| Conservative | Albert Cooper | 18,369 | 46.25 | +4.48 | |
| Labour | Arnold Shaw | 17,087 | 43.03 | -4.56 | |
| Liberal | Gerald Leslie Wilson | 3,341 | 8.41 | -2.22 | |
| National Front | Malcolm Eric Leslie Skeggs | 727 | 1.83 | N/A | |
| Independent | Michael Joseph Marks | 190 | 0.48 | N/A | |
| Majority | 1,282 | 3.23 | N/A | ||
| Turnout | 39,714 | 68.13 | -8.80 | ||
| Registered electors | 58,292 | ||||
| Conservative gain from Labour | Swing | ||||
Elections in the 1960s
| Party | Candidate | Votes | % | ± | |
|---|---|---|---|---|---|
| Labour | Arnold Shaw | 20,613 | 47.59 | +9.52 | |
| Conservative | Albert Cooper | 18,093 | 41.77 | -0.36 | |
| Liberal | Irene Watson | 4,606 | 10.63 | -8.99 | |
| Majority | 2,520 | 5.82 | N/A | ||
| Turnout | 43,312 | 76.93 | +1.92 | ||
| Registered electors | 56,302 | ||||
| Labour gain from Conservative | Swing | ||||
| Party | Candidate | Votes | % | ± | |
|---|---|---|---|---|---|
| Conservative | Albert Cooper | 18,352 | 42.13 | -8.37 | |
| Labour | Arnold Shaw | 16,659 | 38.25 | +3.20 | |
| Liberal | Peter McGregor | 8,547 | 19.62 | +5.17 | |
| Majority | 1,693 | 3.89 | -11.57 | ||
| Turnout | 43,558 | 75.01 | -2.90 | ||
| Registered electors | 58,066 | ||||
| Conservative hold | Swing | ||||
Elections in the 1950s
| Party | Candidate | Votes | % | ± | |
|---|---|---|---|---|---|
| Conservative | Albert Cooper | 23,876 | 50.50 | -6.23 | |
| Labour | Gordon Borrie | 16,569 | 35.05 | -8.22 | |
| Liberal | Raymond V Netherclift | 6,832 | 14.45 | N/A | |
| Majority | 7,307 | 15.46 | +1.99 | ||
| Turnout | 47,277 | 77.91 | +2.59 | ||
| Registered electors | 60,678 | ||||
| Conservative hold | Swing | ||||
| Party | Candidate | Votes | % | ± | |
|---|---|---|---|---|---|
| Conservative | Albert Cooper | 27,292 | 56.73 | +1.98 | |
| Labour | James Ranger | 20,814 | 43.27 | -1.98 | |
| Majority | 6,478 | 13.47 | +3.96 | ||
| Turnout | 48,106 | 75.32 | -7.34 | ||
| Registered electors | 63,866 | ||||
| Conservative hold | Swing | ||||
| Party | Candidate | Votes | % | ± | |
|---|---|---|---|---|---|
| Conservative | Albert Cooper | 30,177 | 54.75 | +5.24 | |
| Labour | James Ranger | 24,938 | 45.25 | +3.72 | |
| Majority | 5,239 | 9.51 | +1.53 | ||
| Turnout | 54,115 | 82.66 | -2.71 | ||
| Registered electors | 66,678 | ||||
| Conservative hold | Swing | ||||
| Party | Candidate | Votes | % | ± | |
|---|---|---|---|---|---|
| Conservative | Albert Cooper | 28,087 | 49.51 | +1.51 | |
| Labour | James Ranger | 23,558 | 41.53 | +5.23 | |
| Liberal | Ronald Acott Hall | 4,170 | 7.35 | -8.35 | |
| Communist | Dave Kelly[12] | 913 | 1.61 | N/A | |
| Majority | 4,529 | 7.98 | N/A | ||
| Turnout | 56,728 | 85.37 | +14.27 | ||
| Registered electors | 66,720 | ||||
| Conservative gain from Labour | Swing | ||||
Elections in the 1940s
| Party | Candidate | Votes | % | ± | |
|---|---|---|---|---|---|
| Labour | James Ranger | 19,339 | 48.0 | N/A | |
| Conservative | Edward Boulton | 14,633 | 36.3 | N/A | |
| Liberal | Eric Arthur Holloway | 6,322 | 15.7 | N/A | |
| Majority | 4,706 | 11.7 | N/A | ||
| Turnout | 40,294 | 71.1 | N/A | ||
| Registered electors | 56,669 | ||||
| Labour win (new seat) | |||||
See also
Notes and references
- Notes
- ↑ A borough constituency (for the purposes of election expenses and type of returning officer)
- ↑ As with all constituencies, the constituency elects one Member of Parliament (MP) by the first past the post system of election at least every five years.
- References
- ↑ "Electorate Figures – Boundary Commission for England". 2011 Electorate Figures. Boundary Commission for England. 4 March 2011. Archived from the original on 6 November 2010. Retrieved 13 March 2011.
- ↑ List of Labour MPs elected in 2015 by % majority UK Political.info. Retrieved 2017-01-29
- ↑ Leigh Rayment's Historical List of MPs – Constituencies beginning with "I"
- ↑ "Ilford South parliamentary constituency". BBC News.
- ↑ http://researchbriefings.files.parliament.uk/documents/CBP-7979/CBP-7979.pdf
- ↑ "Election Data 2015". Electoral Calculus. Archived from the original on 17 October 2015. Retrieved 17 October 2015.
- ↑ http://electionresults.blogspot.co.uk/2013/04/ilford-south-2015.html
- ↑ "Archived copy". Archived from the original on 2015-04-15. Retrieved 2015-04-25.
- ↑ https://my.greenparty.org.uk/candidates/106014
- ↑ General Election Results from the Electoral Commission
- ↑ "Archived copy". Archived from the original on 2011-07-16. Retrieved 2010-05-02.
- ↑ Stevenson, Graham. "Dave Kelly". Retrieved 23 April 2017.
External links
- Politics Resources (Election results from 1922 onwards)
- Electoral Calculus (Election results from 1955 onwards)
| Districts | 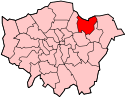 | |
|---|---|---|
| Attractions |
| |
| Constituencies | ||
| Parks and open spaces |
| |
| Tube and rail stations | ||
| History | ||
| Other topics | ||