United Kingdom general election, 1951
|
| |||||||||||||||||||||||||||||||||||||||||||||
| |||||||||||||||||||||||||||||||||||||||||||||
All 625 seats in the House of Commons 313 seats needed for a majority | |||||||||||||||||||||||||||||||||||||||||||||
|---|---|---|---|---|---|---|---|---|---|---|---|---|---|---|---|---|---|---|---|---|---|---|---|---|---|---|---|---|---|---|---|---|---|---|---|---|---|---|---|---|---|---|---|---|---|
| Opinion polls | |||||||||||||||||||||||||||||||||||||||||||||
| Turnout |
82.6%, | ||||||||||||||||||||||||||||||||||||||||||||
| |||||||||||||||||||||||||||||||||||||||||||||
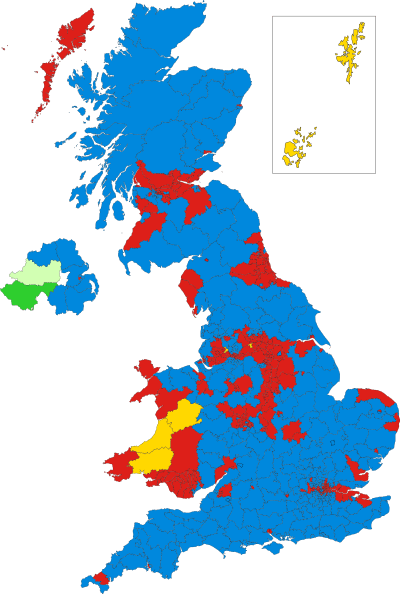 Colours denote the winning party—as shown in § Results | |||||||||||||||||||||||||||||||||||||||||||||
| |||||||||||||||||||||||||||||||||||||||||||||
.jpg)
The 1951 United Kingdom general election was held twenty months after the 1950 general election, which the Labour Party had won with a slim majority of just five seats. The Labour government called the general election for Thursday 25 October 1951 hoping to increase their parliamentary majority. However, despite winning the popular vote, the Labour Party was defeated by the Conservative Party who had won the most seats. This election marked the beginning of the Labour Party's thirteen-year spell in opposition, and the return of Winston Churchill as Prime Minister. Also, this was the final general election to be held with George VI as monarch; as he died the following year on 6 February, and was succeeded by his daughter, Elizabeth II.
Background
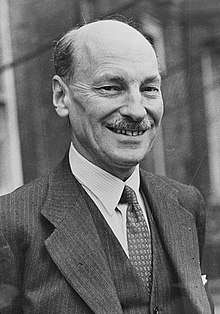
Clement Attlee had decided to call the election after the King's concerns that, over leaving the country to go on his Commonwealth tour in 1952 with a government that had such a slim majority, there was danger of a change of government in his absence.[1] (As it transpired the King became too ill to travel and delegated the tour to his daughter Princess Elizabeth shortly before his death in February 1952.)
The Labour government, which by now had implemented most of its 1945 election manifesto, was now beginning to lose many cabinet ministers such as Ernest Bevin and Stafford Cripps due to old age. The Conservatives however, due to the previous year's election, appeared fresher, with more new MPs.
Campaign
Labour's manifesto stated that the party "proud of its record, sure in its policies—confidently asks the electors to renew its mandate". It identified four key tasks facing the United Kingdom which it would tackle: the need to work for peace, the need to work to "maintain full employment and to increase production", the need to reduce cost of living, and the need to "build a just society". The manifesto argued that only a Labour government could achieve these tasks.[2] It also contrasted the Britain of 1951 with that of the interwar years (when there had largely been Conservative-led governments), saying this period saw "mass-unemployment; mass fear; mass misery".[3]
While Labour began to have some policy divisions during the election campaign, the Conservatives ran an efficient campaign that was well-funded and orchestrated. Their manifesto Britain Strong and Free stressed that safeguarding "our traditional way of life" was integral to the Conservative purpose. Significantly, they did not propose to dismantle the welfare state or the National Health Service which the Labour government had established.[4] The manifesto did however promise to 'stop all further nationalisation' and to repeal the Steel Act introduced by the Labour Government.[5]
As for the Liberals, the poor election results in 1950 only worsened; unable to get the same insurance against losses of deposits that they did the previous year, they were able to field only 109 candidates, and thus posted the worst general election result in the party's history, earning just 2.5% of the vote and winning only six seats. Their popular vote total would never again fall so low, though the total of six seats would be matched in several future elections.[6]
Four candidates were returned unopposed, all in Northern Ireland. This was the last general election in which any candidates were returned unopposed, although there have since been unopposed by-elections.[7]
The subsequent Labour defeat was significant for several reasons: the party polled almost a quarter of a million votes more than the Conservatives and their National Liberal allies combined, won the most votes that Labour has ever won (as of 2017) and won the most votes of any political party in any election in British political history, a record not surpassed until the Conservative Party's victory in 1992.
Despite this, it was the Conservatives who formed the next government with a majority of 17 seats. Under the first past the post electoral system, many Labour votes were "wasted" as part of large majorities for MPs in safe seats rather than into holding onto marginal seats.
Additionally most of Labour's overall popular vote margin can be accounted for as being the votes not polled by the Conservatives's Ulster Unionist allies in the four constituencies (all safe UUP seats) in which they were unopposed—the UUP would poll 166,400 votes in these four constituencies four years later.
This was the fourth of five elections in the twentieth century where a party lost the popular vote, but won the most seats. The others were January 1910, December 1910, 1929 and February 1974; it also happened in the 1874 election.
Results
| 321 | 295 | 6 | 3 |
| Conservative | Labour | Lib | O |
| Candidates | Votes | ||||||||||
|---|---|---|---|---|---|---|---|---|---|---|---|
| Party | Leader | Stood | Elected | Gained | Unseated | Net | % of total | % | No. | Net % | |
| Labour | Clement Attlee | 617 | 295 | 2 | 22 | −20 | 47.20 | 48.78 | 13,948,883 | ||
| Conservative | Winston Churchill | 617 | 321 | 23 | 1 | +22 | 51.36 | 47.97 | 13,717,850 | ||
| Liberal | Clement Davies | 109 | 6 | 1 | 4 | −3 | 0.96 | 2.55 | 730,546 | ||
| Independent Nationalist | N/A | 3 | 2 | 0 | 0 | 0 | 0.32 | 0.32 | 92,787 | ||
| Irish Labour | William Norton | 1 | 1 | 1 | 0 | +1 | 0.16 | 0.12 | 33,174 | ||
| Communist | Harry Pollitt | 10 | 0 | 0 | 0 | 0 | 0.00 | 0.08 | 21,640 | ||
| Independent | N/A | 6 | 0 | 0 | 0 | 0 | 0.00 | 0.07 | 19,791 | ||
| Plaid Cymru | Gwynfor Evans | 4 | 0 | 0 | 0 | 0 | 0.00 | 0.04 | 10,920 | ||
| SNP | Robert McIntyre | 2 | 0 | 0 | 0 | 0 | 0.00 | 0.03 | 7,299 | ||
| Ind. Conservative | N/A | 1 | 0 | 0 | 0 | 0 | 0.00 | 0.02 | 5,904 | ||
| Ind. Labour Party | Fred Barton | 3 | 0 | 0 | 0 | 0 | 0.00 | 0.01 | 4,057 | ||
| British Empire | P. J. Ridout | 1 | 0 | 0 | 0 | 0 | 0.00 | 0.01 | 1,643 | ||
| Anti-Partition | James McSparran | 1 | 0 | 0 | 0 | 0 | 0.00 | 0.01 | 1,340 | ||
| United Socialist | Guy Aldred | 1 | 0 | 0 | 0 | 0 | 0.00 | 0.00 | 411 | ||
The National Liberals were in alliance with the Conservatives, bringing total Conservative strength to 321 seats (51.36%); votes total 13,717,850 (47.97%).
| Government's new majority | 17 |
| Total votes cast | 28,596,594 |
| Turnout | 82.6% |
Votes summary
Seats summary
Transfers of seats
All comparisons are with the 1950 election.[lower-alpha 2]
See also
Notes
- ↑ All parties shown. Conservative result includes the Ulster Unionists.
- ↑ No seats changed hands during the 1950–51 Parliament.
References
- ↑ Judd 2012, p. 238: Judd writes that Attlee confirmed the king's anxiety in his own autobiography.
- ↑ The Times House of Commons 1951, London: The Times Office, 1951, p. 228
- ↑ The Times House of Commons 1951, London: The Times Office, 1951, p. 229
- ↑ Kynaston 2009, p. 32.
- ↑ The Times House of Commons 1951, London: The Times Office, 1951, p. 234
- ↑ 1951: Churchill back in power at last, BBC News, 5 April 2005, retrieved 5 October 2013
- ↑ "General Election Results 1885–1979", election.demon.co.uk, retrieved 5 October 2013
Sources
- Butler, David E. (1952), The British General Election of 1951, the standard study
- Craig, F. W. S. (1989), British Electoral Facts: 1832–1987, Dartmouth: Gower, ISBN 0900178302
- Judd, Dennis (2012), George VI, I.B. Tauris (paperback), ISBN 978-1-78076-071-1
- Kynaston, David (2009), Family Britain 1951–7, London: Bloomsbury, ISBN 9780747583851
External links
Manifestos
- Conservative Party: 1951, 1951 Conservative Party manifesto
- Labour Party Election Manifesto, 1951 Labour Party manifesto
- The Nation's Task, 1951 Liberal Party manifesto
| General elections |
|
|---|---|
| Local elections |
|
| European elections | |
| Referendums | |