Pontypridd (UK Parliament constituency)
Coordinates: 51°36′04″N 3°21′00″W / 51.601°N 3.350°W
| Pontypridd | |
|---|---|
|
County constituency for the House of Commons | |
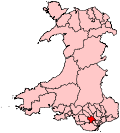 Boundary of Pontypridd in Wales. | |
| Preserved county | Mid Glamorgan |
| Electorate | 61,507 (April 2012)[1] |
| Major settlements | Pontypridd, Llantrisant |
| Current constituency | |
| Created | 1918 |
| Member of parliament | Owen Smith (Labour) |
| Number of members | One |
| Created from | South Glamorganshire and East Glamorganshire |
| Overlaps | |
| Welsh Assembly | South Wales Central |
| European Parliament constituency | Wales |
Pontypridd /pɒntəˈpriːð/ is a county constituency represented in the House of Commons of the Parliament of the United Kingdom. It returns one Member of Parliament (MP), elected by the first past the post system. Pontypridd has been represented by a succession of Labour MPs since 1922. Since the 2010 general election the seat has been represented by Owen Smith of the Labour Party.
Boundaries
Pontypridd constituency can be split into two parts, an eastern part containing the town itself, and a western part focussed on Llantrisant. In Pontypridd itself the wards are: Town, Treforest, Rhondda (consisting of Hopkinstown, Maesycoed, Graigwen, Trehafod, & Pwllgwaun), Graig, Trallwng, Rhydyfelin Central & Ilan, & Hawthorn. The Western half consists of the following wards: Taffs Well, Beddau, Church Village, Tonteg, Llantwit Fardre, Llantrisant, Pontyclun, Talbot Green, Tonyrefail East and Tonyrefail West.[2]
Alternatively, one can think of the constituency as being divided between a 'suburban' district in the south and communities that grew in the industrial revolution to the north; the Southern area, particularly between Church Village and Llantrisant, contains much new residential and light industrial development, and benefits from good transport links due to its proximity to the M4. This section has a growing population and is an important 'dormitory' for Cardiff. The Northern parts, particularly Tonyrefail and the northern end of Pontypridd town consists of large sections of 19th century housing and suffered high unemployment in the 1980s as the old industries closed. However, in recent years, economic recovery has been firm, especially considered with neighbouring constituencies to the north.
The Pontypridd constituency was created in its original form from parts of the old South Glamorganshire & East Glamorganshire constituencies as part of Representation of the People Act 1918 (sometimes referred to as 'The Fourth Reform Act') which granted virtually all men over 21 the right to vote, extended voting rights to women over 30 years of age, & increased the number of the now abolished University constituencies. Part of this Act also effected a 'General Redistribution of Seats' on an 'equitable basis'.[3] It originally included the old Borough & Rural district of Cowbridge (which included Ystradowen, Bonvilston, St Athan, Llantwit Major & Llandow) & the Urban district of Pontypridd plus the Rural District of Llantrisant & Llantwit Fardre.[4] The constituency remained unchanged from this form until the Third Periodic Parliamentary Boundary Review's proposals were implemented in 1983.[5] This removed Cowbridge Borough and the Cowbridge Rural District placing them in the Vale of Glamorgan constituency additionally moving out the communities of Llanharry, Llanharan, and Brynna into the Ogmore constituency.However the communities of Creigiau and Pentyrch were added to the seat at this time, only to be removed again in time for the 2010 General Election.
Prior to 2010 the Pontypridd Constituency also consisted of the Cilfynydd, Glyncoch, Creigiau & Pentyrch Wards. The Fifth Periodic Parliamentary Boundary Review for Wales placed Cilfynydd & Glyncoch wards in the Cynon Valley (UK Parliament constituency) [6] & the Creigiau & Pentyrch wards in the Cardiff West (UK Parliament constituency). These changes were made & in place for the United Kingdom general election, 2010.
Members of Parliament
Like many seats in South Wales, Pontypridd has been retained by the Labour party for over 95 years.
Elections
Elections in the 2010s
| Party | Candidate | Votes | % | ± | |
|---|---|---|---|---|---|
| Labour | Owen Smith | 22,103 | 55.4 | +14.3 | |
| Conservative | Juliette Ash | 10,655 | 26.7 | +9.4 | |
| Plaid Cymru | Fflur Elin | 4,102 | 10.3 | -1.2 | |
| Liberal Democrat | Mike Powell | 1,963 | 4.9 | -8.0 | |
| UKIP | Robin Hunter-Clarke | 1,071 | 2.7 | -10.7 | |
| Majority | 11,448 | 28.7 | +5.0 | ||
| Turnout | 39,894 | 65.9 | +1.6 | ||
| Registered electors | 60,564 | ||||
| Labour hold | Swing | +2.5 | |||
| Party | Candidate | Votes | % | ± | |
|---|---|---|---|---|---|
| Labour | Owen Smith | 15,554 | 41.1 | +2.3 | |
| Conservative | Ann-Marie Mason | 6,569 | 17.3 | +1.1 | |
| UKIP | Andrew Tomkinson | 5,085 | 13.4 | +10.0 | |
| Liberal Democrat | Mike Powell | 4,904 | 12.9 | −18.3 | |
| Plaid Cymru | Osian Lewis | 4,348 | 11.5 | +4.2 | |
| Green | Katy Clay | 992 | 2.6 | +1.6 | |
| Socialist Labour | Damien Biggs | 332 | 0.9 | −0.3 | |
| TUSC | Esther Pearson | 98 | 0.3 | N/A | |
| Majority | 8,985 | 23.7 | +16.1 | ||
| Turnout | 37,882 | 64.3 | +1.3 | ||
| Registered electors | 58,940 | ||||
| Labour hold | Swing | −0.1 | |||
| Party | Candidate | Votes | % | ± | |
|---|---|---|---|---|---|
| Labour | Owen Smith | 14,220 | 38.8 | −15.4 | |
| Liberal Democrat | Mike Powell | 11,435 | 31.2 | +11.2 | |
| Conservative | Lee Gonzalez | 5,932 | 16.2 | +4.6 | |
| Plaid Cymru | Ioan Bellin | 2,673 | 7.3 | −3.7 | |
| UKIP | David Bevan | 1,229 | 3.4 | +0.8 | |
| Socialist Labour | Simon Parsons | 456 | 1.2 | N/A | |
| Christian | Donald Watson | 365 | 1.0 | N/A | |
| Green | John Matthews | 361 | 1.0 | N/A | |
| Majority | 2,785 | 7.6 | −25.7 | ||
| Turnout | 36,671 | 63.0 | −0.2 | ||
| Registered electors | 58,205 | ||||
| Labour hold | Swing | −13.3 | |||
Elections in the 2000s
| Party | Candidate | Votes | % | ± | |
|---|---|---|---|---|---|
| Labour | Kim Howells | 20,919 | 52.8 | −7.1 | |
| Liberal Democrat | Mike Powell | 7,728 | 19.5 | +8.7 | |
| Conservative | Quentin Edwards | 5,321 | 13.4 | +0.1 | |
| Plaid Cymru | Julie Richards | 4,420 | 11.2 | −2.6 | |
| UKIP | David Bevan | 1,013 | 2.6 | +1.0 | |
| Communist | Robert Griffiths | 233 | 0.6 | N/A | |
| Majority | 13,191 | 33.3 | −12.8 | ||
| Turnout | 39,634 | 60.9 | +7.5 | ||
| Registered electors | 64,310 | ||||
| Labour hold | Swing | −7.9 | |||
| Party | Candidate | Votes | % | ± | |
|---|---|---|---|---|---|
| Labour | Kim Howells | 22,963 | 59.9 | −3.9 | |
| Plaid Cymru | Bleddyn Hancock | 5,279 | 13.8 | +7.3 | |
| Conservative | Prudence Dailey | 5,096 | 13.3 | +0.4 | |
| Liberal Democrat | Eric Brooke | 4,152 | 10.8 | −2.6 | |
| UKIP | Susan Warry | 603 | 1.6 | N/A | |
| ProLife Alliance | Joseph Biddulph | 216 | 0.6 | N/A | |
| Majority | 17,684 | 46.1 | −4.4 | ||
| Turnout | 38,309 | 58.0 | -13.4 | ||
| Registered electors | 71,768 | ||||
| Labour hold | Swing | −5.6 | |||
Elections in the 1990s
| Party | Candidate | Votes | % | ± | |
|---|---|---|---|---|---|
| Labour | Kim Howells | 29,290 | 63.9 | +3.1 | |
| Liberal Democrat | Nigel Howells | 6,161 | 13.4 | +4.9 | |
| Conservative | Jonathan M. Cowen | 5,910 | 12.9 | −7.4 | |
| Plaid Cymru | Owain Llewelyn | 2,977 | 6.5 | −2.6 | |
| Referendum | John Wood | 874 | 1.9 | N/A | |
| Socialist Labour | Peter Skelly | 380 | 0.8 | N/A | |
| Communist | Robert Griffiths | 178 | 0.4 | N/A | |
| Natural Law | Anthony G. Moore | 85 | 0.2 | N/A | |
| Majority | 23,129 | 50.4 | +10.0 | ||
| Turnout | 45,855 | 71.4 | -7.8 | ||
| Registered electors | 64,185 | ||||
| Labour hold | Swing | −0.9 | |||
| Party | Candidate | Votes | % | ± | |
|---|---|---|---|---|---|
| Labour | Kim Howells | 29,722 | 60.8 | +4.5 | |
| Conservative | Peter D. Donnelly | 9,925 | 20.3 | +0.8 | |
| Plaid Cymru | Delme Bowen | 4,448 | 9.1 | +3.8 | |
| Liberal Democrat | Steve Belzak | 4,180 | 8.5 | −10.3 | |
| Green | Emma J. Jackson | 615 | 1.3 | N/A | |
| Majority | 19,797 | 40.5 | +3.6 | ||
| Turnout | 48,890 | 79.3 | +2.5 | ||
| Registered electors | 61,685 | ||||
| Labour hold | Swing | +1.8 | |||
Elections in the 1980s
| Party | Candidate | Votes | % | ± | |
|---|---|---|---|---|---|
| Labour | Kim Howells | 20,549 | 53.4 | −2.9 | |
| Plaid Cymru | Syd Morgan | 9,775 | 25.3 | +20.0 | |
| Conservative | Nigel Evans | 5,212 | 13.5 | −6.0 | |
| Social and Liberal Democrats | Tom Ellis | 1,500 | 3.9 | −15.0 | |
| SDP | Terry Thomas | 1,199 | 3.1 | −7.2 | |
| Communist | David Richards | 239 | 0.6 | N/A | |
| Independent | David Black | 57 | 0.1 | N/A | |
| Majority | 10,794 | 28.0 | −8.8 | ||
| Turnout | 38,511 | 62.0 | −19.3 | ||
| Registered electors | 61,193 | ||||
| Labour hold | Swing | −11.5 | |||
| Party | Candidate | Votes | % | ± | |
|---|---|---|---|---|---|
| Labour | Brynmor John | 26,422 | 56.3 | +10.7 | |
| Conservative | Desmond Swayne | 9,145 | 19.5 | −3.4 | |
| Social Democratic | Peter Sain-Ley-Berry | 8,865 | 18.9 | −7.0 | |
| Plaid Cymru | Delme Bowen | 2,498 | 5.3 | +0.7 | |
| Majority | 17,277 | 36.8 | +17.1 | ||
| Turnout | 46,930 | 76.6 | +3.9 | ||
| Registered electors | 61,255 | ||||
| Labour hold | Swing | +7.1 | |||
| Party | Candidate | Votes | % | ± | |
|---|---|---|---|---|---|
| Labour | Brynmor John | 20,188 | 45.6 | −10.4 | |
| Social Democratic | Richard Langridge | 11,444 | 25.9 | N/A | |
| Conservative | Richard Evans | 10,139 | 22.9 | −6.3 | |
| Plaid Cymru | Janet Davies | 2,065 | 4.7 | +0.9 | |
| Green | Alwyn K. Jones | 449 | 1.0 | N/A | |
| Majority | 8,744 | 19.8 | −7.0 | ||
| Turnout | 44,285 | 72.7 | −5.4 | ||
| Registered electors | 60,883 | ||||
| Labour hold | Swing | −5.2 | |||
Elections in the 1970s
| Party | Candidate | Votes | % | ± | |
|---|---|---|---|---|---|
| Labour | Brynmor John | 32,801 | 55.97 | -0.6 | |
| Conservative | Michael Clay | 17,114 | 29.21 | +8.9 | |
| Liberal | Hugh Penri-Williams | 6,228 | 10.63 | -4.9 | |
| Plaid Cymru | Alun Roberts | 2,200 | 3.76 | -3.8 | |
| National Front | R.G. Davies | 263 | 0.45 | N/A | |
| Majority | 15,687 | 26.77 | -9.5 | ||
| Turnout | 58,606 | 78.1 | +4.3 | ||
| Registered electors | 75,050b | ||||
| Labour hold | Swing | -4.7 | |||
| Party | Candidate | Votes | % | ± | |
|---|---|---|---|---|---|
| Labour | Brynmor John | 29,302 | 56.57 | +4.6 | |
| Conservative | Alun Jones | 10,528 | 20.33 | -0.8 | |
| Liberal | Mary Murphy | 8,050 | 15.55 | -2.79 | |
| Plaid Cymru | Richard Kemp | 3,917 | 7.57 | -1.0 | |
| Majority | 18,774 | 36.3 | +5.4 | ||
| Turnout | 51,797 | 73.79 | -3.6 | ||
| Registered electors | 70,200 | ||||
| Labour hold | Swing | +2.7 | |||
| Party | Candidate | Votes | % | ± | |
|---|---|---|---|---|---|
| Labour | Brynmor John | 28,028 | 51.97 | -6.6 | |
| Conservative | Alun Jones | 11,406 | 21.15 | +4.3 | |
| Liberal | Mary Murphy | 9,889 | 18.34 | +4.2 | |
| Plaid Cymru | Richard Kemp | 4,612 | 8.56 | -1.9 | |
| Majority | 16,622 | 30.82 | -10.8 | ||
| Turnout | 53,935 | 77.40 | +3.0 | ||
| Registered electors | 69,685 | ||||
| Labour hold | Swing | -5.4 | |||
| Party | Candidate | Votes | % | ± | |
|---|---|---|---|---|---|
| Labour | Brynmor John | 28,414 | 58.5 | -16.4 | |
| Conservative | Michael Withers | 8,205 | 16.9 | -8.2 | |
| Liberal | Mary Murphy | 6,871 | 14.2 | N/A | |
| Plaid Cymru | Errol Jones | 5,059 | 10.4 | N/A | |
| Majority | 20,209 | 41.6 | -8.2 | ||
| Turnout | 48,549 | 74.39 | -0.3 | ||
| Registered electors | 65,265 | ||||
| Labour hold | Swing | -4.1 | |||
Elections in the 1960s
| Party | Candidate | Votes | % | ± | |
|---|---|---|---|---|---|
| Labour | Arthur Pearson | 30,840 | 74.9 | +3.6 | |
| Conservative | Kenneth Green-Wanstall | 10,325 | 25.09 | -3.6 | |
| Majority | 20,515 | 49.8 | +7.1 | ||
| Turnout | 41,365 | 74.73 | -2.1 | ||
| Registered electors | 55,088 | ||||
| Labour hold | Swing | +3.6 | |||
| Party | Candidate | Votes | % | ± | |
|---|---|---|---|---|---|
| Labour | Arthur Pearson | 29,533 | 71.35 | +3.2 | |
| Conservative | John Warrender | 11,859 | 28.65 | -3.2 | |
| Majority | 17,674 | 42.70 | +6.2 | ||
| Turnout | 41,392 | 76.86 | -4.3 | ||
| Registered electors | 53,859 | ||||
| Labour hold | Swing | +3.2 | |||
Elections in the 1950s
| Party | Candidate | Votes | % | ± | |
|---|---|---|---|---|---|
| Labour | Arthur Pearson | 29,853 | 68.20 | -2.9 | |
| Conservative | Brandon Rhys-Williams | 13,896 | 31.80 | +2.9 | |
| Majority | 15,957 | 36.50 | -5.8 | ||
| Turnout | 43,749 | 81.20 | +6.3 | ||
| Registered electors | 53,903 | ||||
| Labour hold | Swing | -2.9 | |||
| Party | Candidate | Votes | % | ± | |
|---|---|---|---|---|---|
| Labour | Arthur Pearson | 28,881 | 71.14 | -1.1 | |
| Conservative | Thomas Tyrrell | 11,718 | 28.87 | +1.1 | |
| Majority | 17,163 | 42.28 | -2.2 | ||
| Turnout | 40,599 | 74.89 | -8.4 | ||
| Registered electors | 54,214 | ||||
| Labour hold | Swing | -1.1 | |||
| Party | Candidate | Votes | % | ± | |
|---|---|---|---|---|---|
| Labour | Arthur Pearson | 32,586 | 72.26 | +3.3 | |
| Conservative | James Lionel Manning | 12,511 | 27.75 | +7.6 | |
| Majority | 20,075 | 44.52 | -4.3 | ||
| Turnout | 45,097 | 83.32 | -0.9 | ||
| Registered electors | 54,126 | ||||
| Labour hold | Swing | -2.1 | |||
| Party | Candidate | Votes | % | ± | |
|---|---|---|---|---|---|
| Labour | Arthur Pearson | 30,945 | 68.9 | +0.3 | |
| Conservative | Thomas Esmôr Rhys Rhys-Roberts | 9,049 | 20.2 | +2.3 | |
| Liberal | David Irwin Charles Lewis | 4,895 | 10.9 | -2.6 | |
| Majority | 21,896 | 48.78 | -1.9 | ||
| Turnout | 44,889 | 84.3 | +8.3 | ||
| Registered electors | 53,275 | ||||
| Labour hold | Swing | -1.0 | |||
Elections in the 1940s
| Party | Candidate | Votes | % | ± | |
|---|---|---|---|---|---|
| Labour | Arthur Pearson | 27,823 | 68.62 | +8.7 | |
| Conservative | Cennydd Traherne | 7,260 | 17.9 | N/A | |
| Liberal | John Ellis Williams | 5,464 | 13.5 | N/A | |
| Majority | 20,563 | 50.7 | +30.8 | ||
| Turnout | 40,547 | 76.0 | +6.7 | ||
| Registered electors | 53,346 | ||||
| Labour hold | Swing | +15.4 | |||
Elections in the 1930s
| Party | Candidate | Votes | % | ± | |
|---|---|---|---|---|---|
| Labour | Arthur Pearsonc | 22,159 | 59.9 | N/A | |
| Liberal National | Juliet Rhys-Williams | 14,810 | 40.1 | N/A | |
| Majority | 7,349 | 19.9 | N/A | ||
| Turnout | 36,969 | 69.3 | N/A | ||
| Registered electors | 36,846 | ||||
| Labour hold | Swing | N/A | |||
| Party | Candidate | Votes | % | ± | |
|---|---|---|---|---|---|
| Labour | David Lewis Davies | Unopposed | |||
| Registered electors | 48,469 | ||||
| Labour hold | |||||
| Party | Candidate | Votes | % | ± | |
|---|---|---|---|---|---|
| Labour | David Lewis Davies | 21,751 | 58.4 | +5.3 | |
| Liberal | Bernard Acworth | 13,937 | 37.4 | +0.6 | |
| Independent Labour | Thomas Mardy-Jones | 1,110 | 3.0 | N/A | |
| New Party | William Lowell | 466 | 1.3 | N/A | |
| Majority | 7,814 | 21.0 | +4.6 | ||
| Turnout | 37,264 | 78.7 | -3.3 | ||
| Registered electors | 47,346 | ||||
| Labour hold | Swing | +2.3 | |||
| Party | Candidate | Votes | % | ± | |
|---|---|---|---|---|---|
| Labour | David Lewis Davies | 20,687 | 59.89 | +6.72 | |
| Liberal | Geoffrey Crawshay | 8,368 | 24.23 | -12.57 | |
| Conservative | David J Evans | 5,489 | 15.89 | +5.79 | |
| Majority | 12,319 | 35.7 | +19.30 | ||
| Turnout | 34,544 | 73.0 | -9.00 | ||
| Registered electors | 34,733 | ||||
| Labour hold | Swing | +9.7 | |||
Elections in the 1920s
| Party | Candidate | Votes | % | ± | |
|---|---|---|---|---|---|
| Labour | Thomas Mardy-Jones | 20,835 | 53.1 | -2.8 | |
| Liberal | John Victor Evans | 14,421 | 36.8 | N/A | |
| Conservative | May Gordon Williams | 3,967 | 10.1 | -34.0 | |
| Majority | 6,414 | 16.4 | +4.5 | ||
| Turnout | 39,223 | 82.0 | +2.3 | ||
| Registered electors | 47,860 | ||||
| Labour hold | Swing | +2.3 | |||
| Party | Candidate | Votes | % | ± | |
|---|---|---|---|---|---|
| Labour | Thomas Mardy-Jones | 18,301 | 55.93 | +1.0 | |
| Conservative | David J Evans | 14,425 | 44.1 | N/A | |
| Majority | 3,876 | 11.9 | +2.1 | ||
| Turnout | 32,726 | 79.6 | +3.6 | ||
| Registered electors | 41,099 | ||||
| Labour hold | Swing | +1.0 | |||
| Party | Candidate | Votes | % | ± | |
|---|---|---|---|---|---|
| Labour | Thomas Mardy-Jones | 16,837 | 54.9 | +7.7 | |
| Liberal | Jon David Rees | 13,839 | 45.1 | +19.8 | |
| Majority | 2,998 | 9.8 | -9.9 | ||
| Turnout | 30,676 | 76.0 | -0.8 | ||
| Registered electors | 40,379 | ||||
| Labour hold | Swing | -6.0 | |||
| Party | Candidate | Votes | % | ± | |
|---|---|---|---|---|---|
| Labour | Thomas Mardy-Jones | 14,884 | 47.2 | +3.4 | |
| National Liberal | Rhys Rhys-Williams | 8,667 | 27.5 | N/A | |
| Unionist | J. Griffith Jones | 7,994 | 25.4 | N/A | |
| Majority | 6,217 | 19.7 | N/A | ||
| Turnout | 31,545 | 76.8 | +8.5 | ||
| Registered electors | 41,087 | ||||
| Labour hold | Swing | ||||
| Party | Candidate | Votes | % | ± | |
|---|---|---|---|---|---|
| Labour | Thomas Mardy-Jones | 16,630 | 57.0 | +14.2 | |
| C | Liberal | Thomas Arthur Lewis | 12,550 | 43.0 | -13.1 |
| Majority | 4,080 | 13.19 | N/A | ||
| Turnout | 29,180 | 72.82 | +4.52 | ||
| Registered electors | 40,071 | ||||
| Labour gain from Liberal | Swing | ||||
| C indicates candidate endorsed by the coalition government. | |||||
Elections in the 1910s

| Party | Candidate | Votes | % | ± | |
|---|---|---|---|---|---|
| C | Liberal | Thomas Arthur Lewis | 13,327 | 56.1 | N/A |
| Labour | David Lewis Davies | 10,152 | 42.8 | N/A | |
| Conservative | Arthur Seaton | 260 | 1.1 | N/A | |
| Majority | 3,175 | 13.4 | N/A | ||
| Turnout | 23,739 | 68.3 | N/A | ||
| Registered electors | 34,778 | ||||
| Liberal win (new seat) | |||||
| C indicates candidate endorsed by the coalition government. | |||||
See also
- Pontypridd (Assembly constituency)
- List of Parliamentary constituencies in Mid Glamorgan
- List of Parliamentary constituencies in Wales
- The National Library of Wales:Dictionary of Welsh Biography (Thomas Isaac Mardy Jones)
- The National Library for Wales: Dictionary of Welsh Biography (Arthur Pearson)
- The National Library for Wales: Dictionary of Welsh Biography (Brynmor John)
- Ordnance Survey Election Maps Site
- Boundary Commission Map report from 1917 showing original detailed map used for Pontypridd Constituency
- Boundary Commission Ordnance Survey Map original used at 1955 review for the entire UK showing all constituencies highly detailed
Footnotes
- a In 1983 the Third Periodical Boundary Review report made major changes to the constituency, removing the Cowbridge community & placing it the new Vale of Glamorgan seat & also by removing the Llanharry & Llanharan communities to the Ogmore seat. However, the Pentyrch & Creigiau communities were added to the new seat from the old Barry seat, to give a New seat with nearly 15,000 less electors.
- b This was and still is the largest number of electors for the Pontypridd constituency in any of its forms.
- c Arthur Pearson's initial selection following a closely contested process at a selection conference at Pontyclun occurred only after several rounds of voting, and he was finally chosen against the prominent local miners' agent W. H. May on 15 January 1938.
- d Enacted in the Representation of the People Act 1918 & created from the old East Glamorganshire (which included Pontypridd & the Tonteg/Church Village/Llantwit Fardre areas) & South Glamorganshire (which included the Llantrisant, Tonyrefail, Pontyclun, Llanharry & Cowbridge areas) parliamentary constituencies, the Pontypridd constituency from 1918 to the 1983 UK General Election remained unchanged & consisted of the Cowbridge, Llantwit Major, St Athan, Ystradowen, Llandow & Bonvilston communities plus Pontypridd urban district council plus the Llantrisant(which included Llanharry, Llanharan, Brynna) & Llantwit Fardre rural districts.
Notes and references
- ↑ Rhondda Cynon Taff County Borough Council Ward figures for 2012 County Council Elections
- ↑ "Comisiwn Ffiniau i Gymru" (PDF). Boundary Commission for Wales. Retrieved 2016-07-23.
- ↑ The Times House of Commons Guide 1910, 1911, 1919, Poltico's Publishing Page 8 1918 Election section
- ↑ The Times House of Commons Guide 1950, The Times Office, Printing House Square Page 55
- ↑ Third Periodical Report of the Boundary Commission for Wales. February 1983. Cmd.8798.
- ↑ "Fifth Periodical Report of the Boundary Commission for Wales" (PDF). Stationery Office. Retrieved 2014-04-03.
- ↑ Leigh Rayment's Historical List of MPs – Constituencies beginning with "P" (part 2)
- ↑
- ↑ "Election Data 2015". Electoral Calculus. Archived from the original on 17 October 2015. Retrieved 17 October 2015.
- ↑ "Election Data 2010". Electoral Calculus. Archived from the original on 26 July 2013. Retrieved 17 October 2015.
- ↑ Pontypridd BBC News | Election 2010 | Constituency | Pontypridd
- ↑ "Election Data 2005". Electoral Calculus. Archived from the original on 15 October 2011. Retrieved 18 October 2015.
- ↑ "Election Data 2001". Electoral Calculus. Archived from the original on 15 October 2011. Retrieved 18 October 2015.
- ↑ "Election Data 1997". Electoral Calculus. Archived from the original on 15 October 2011. Retrieved 18 October 2015.
- ↑ "Election Data 1992". Electoral Calculus. Archived from the original on 15 October 2011. Retrieved 18 October 2015.
- ↑ "Politics Resources". Election 1992. Politics Resources. 9 April 1992. Retrieved 6 December 2010.
- ↑ "Election Data 1987". Electoral Calculus. Archived from the original on 15 October 2011. Retrieved 18 October 2015.
- ↑ The Times House of Commons Guide June 1987, The Times Newspapers Ltd, Golden Square Page 187
- ↑ "Election Data 1983". Electoral Calculus. Archived from the original on 15 October 2011. Retrieved 18 October 2015.
- ↑ The Times House of Commons Guide June 1983, The Times Newspapers Ltd, St Edmundsbury Press, Bury Page 186
- ↑ Third Periodical Report of the Boundary Commission for Wales. February 1983 Cmd.8798.
- ↑ The Times House of Commons Guide May 1979, The Times Newspapers Ltd, Ogle Street, London Page 188
- ↑ The Times House of Commons Guide October 1974, The Times Newspapers Ltd, Printing House Square Page 218
- ↑ The Times House of Commons Guide February 1974, The Times Newspapers Ltd, Printing House Square Page 207
- ↑ The Times House of Commons Guide 1970, The Times Newspapers Ltd, Printing House Square Page 182
- ↑ The Times House of Commons Guide 1966, The Times Office, Printing House Square Page 170
- ↑ The Times House of Commons Guide 1964, The Times Office, Printing House Square Page 202
- ↑ The Times House of Commons Guide 1959, The Times Office, Printing House Square Page 189
- ↑ The Times House of Commons Guide 1955, The Times Office, Printing House Square Page 206
- ↑ The Times House of Commons Guide 1951, The Times Office, Printing House Square Page 182
- ↑ The Times House of Commons Guide 1950, The Times Office, Printing House Square Page 240
- 1 2 The Times House of Commons Guide 1945, The Times Office, Printing House Square Page 109
- ↑ The Times House of Commons Guide 1929, 1931, 1935, Politico's Publishing Page 135 1935 section
- 1 2 The Times House of Commons Guide 1929, 1931, 1935, Politico's Publishing Page 108 1931 section
- ↑ Craig, F.W.S., ed. (1969). British parliamentary election results 1918-1949. Glasgow: Political Reference Publications. p. 562. ISBN 0-900178-01-9.
- 1 2 The Times House of Commons Guide 1929, 1931, 1935, Politico's Publishing Page 119 1929 section
- 1 2 3 House of Commons Information Office Email Dated 18 December 2008
- ↑ The Times House of Commons Guide 1910, 1911, 1919, Poltico's Publishing Page 68 1918 Section
External links
- Politics Resources (Election results from 1922 onwards)
- Electoral Calculus (Election results from 1955 onwards)
- 2017 Election House Of Commons Library 2017 Election report
- A Vision Of Britain Through Time (Constituency elector numbers)