Swansea West (UK Parliament constituency)
| Swansea West | |
|---|---|
|
Borough constituency for the House of Commons | |
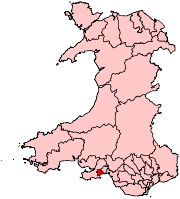 Boundary of Swansea West in Wales. | |
| Preserved county | West Glamorgan |
| Electorate | 62,769 (December 2010)[1] |
| Current constituency | |
| Created | 1918 |
| Member of parliament | Geraint Davies (Labour Co-operative) |
| Number of members | One |
| Created from | Swansea and Gower |
| Overlaps | |
| Welsh Assembly | South Wales West |
| European Parliament constituency | Wales |
Swansea West (Welsh: Gorllewin Abertawe) is a constituency of the House of Commons of the Parliament of the United Kingdom. It elects one Member of Parliament (MP) by the first past the post system of election, and is currently represented by Geriant Davies of the Labour Co-operative party, who was first elected in the constituency in 2010.
The National Assembly for Wales constituency of the same name presently has the same boundaries.
Alan Williams represented the seat for the Labour Party from 1964 until his retirement in 2010; from 2005 until his retirement he was the Father of the House (meaning longest-serving MP currently sitting).
Boundaries
The constituency comprises the electoral wards of Sketty, Castle, Killay South, Killay North, Dunvant, Uplands, Townhill, Cockett and Mayals.
1918-1949: The County Borough of Swansea wards of Alexandra, Bryn Melyn, Castle, Ffynone, St Helen's, and Victoria.
1950-1955: The County Borough of Swansea wards of Brynmelyn, Cockett, Ffynone, Oystermouth and Brynau, St Helen's, Sketty, Victoria, and Waunarlwydd.
1955-1983: The County Borough of Swansea wards of Brynmelin, Fforestfach, Ffynone, Mumbles, St Helen's, Sketty, Townhill, and Victoria.[2]
Members of Parliament
Elections
Elections in the 2010s
| Party | Candidate | Votes | % | ± | |
|---|---|---|---|---|---|
| Labour | Geraint Davies | 22,278 | 59.8 | +17.2 | |
| Conservative | Craig Lawton | 11,680 | 31.3 | +8.8 | |
| Plaid Cymru | Rhydian Fitter | 1,529 | 4.1 | -2.3 | |
| Liberal Democrat | Michael O'Carroll | 1,269 | 3.4 | -5.6 | |
| Green | Mike Whittall | 434 | 1.2 | -3.9 | |
| Socialist (GB) | Brian Johnson | 92 | 0.2 | +0.1 | |
| Majority | 10,598 | 28.5 | +8.5 | ||
| Turnout | 37,345 | 65.5 | +5.7 | ||
| Registered electors | 56,889 | ||||
| Labour hold | Swing | +4.2 | |||
| Party | Candidate | Votes | % | ± | |
|---|---|---|---|---|---|
| Labour Co-op | Geraint Davies 1 | 14,967 | 42.6 | +7.9 | |
| Conservative | Emma Lane | 7,931 | 22.6 | +1.7 | |
| UKIP | Martyn Ford | 4,744 | 13.5 | +11.5 | |
| Liberal Democrat | Chris Holley | 3,178 | 9.0 | -24.2 | |
| Plaid Cymru | Harri Roberts | 2,266 | 6.4 | +2.4 | |
| Green | Ashley Wakeling | 1,784 | 5.1 | +4.0 | |
| TUSC | Ronnie Job[7] | 159 | 0.5 | -0.1 | |
| Independent | Maxwell Rosser | 78 | 0.2 | N/A | |
| Socialist (GB) | Brian Johnson [8] | 49 | 0.1 | N/A | |
| Majority | 7,036 | 20.0 | +18.6 | ||
| Turnout | 35,156 | 59.8 | +1.8 | ||
| Registered electors | 58,776 | ||||
| Labour hold | Swing | +3.1 | |||
1 Geraint Davies is a Labour Co-operative Party member[9] but he was nominated as Welsh Labour .[10]
| Party | Candidate | Votes | % | ± | |
|---|---|---|---|---|---|
| Labour Co-op | Geraint Davies | 12,335 | 34.7 | -7.2 | |
| Liberal Democrat | Peter May | 11,831 | 33.2 | +4.3 | |
| Conservative | René Kinzett[13] | 7,407 | 20.8 | +4.8 | |
| Plaid Cymru | Harri Roberts | 1,437 | 4.0 | -2.5 | |
| BNP | Alan Bateman | 910 | 2.6 | N/A | |
| UKIP | Timothy Jenkins | 716 | 2.0 | +0.2 | |
| Green | Keith Ross | 404 | 1.1 | -1.1 | |
| Independent | Ian McCloy | 374 | 1.1 | N/A | |
| TUSC | Rob Williams | 179 | 0.5 | N/A | |
| Majority | 504 | 1.5 | -11.4 | ||
| Turnout | 35,593 | 58.0 | +1.3 | ||
| Registered electors | 61,334 | ||||
| Labour hold | Swing | -5.7 | |||
Elections in the 2000s
| Party | Candidate | Votes | % | ± | |
|---|---|---|---|---|---|
| Labour | Alan Williams | 13,833 | 41.8 | -6.9 | |
| Liberal Democrat | René Kinzett | 9,564 | 28.9 | +12.3 | |
| Conservative | Mohammed Abdel-Haq | 5,285 | 16.0 | -3.0 | |
| Plaid Cymru | Harri Roberts | 2,150 | 6.5 | -4.1 | |
| Green | Martyn Shrewsbury | 738 | 2.2 | +0.2 | |
| UKIP | Martyn Ford | 609 | 1.8 | -0.2 | |
| Veritas | Yvonne Holley | 401 | 1.2 | N/A | |
| Socialist Alternative | Robert Williams | 288 | 0.9 | N/A | |
| Legalise Cannabis | Steve Pank | 218 | 0.7 | N/A | |
| Majority | 4,269 | 12.9 | -16.8 | ||
| Turnout | 33,086 | 57.1 | +1.3 | ||
| Registered electors | 58,363 | ||||
| Labour hold | Swing | -9.6 | |||
| Party | Candidate | Votes | % | ± | |
|---|---|---|---|---|---|
| Labour | Alan Williams | 15,644 | 48.7 | -7.5 | |
| Conservative | Margaret Harper | 6,094 | 19.0 | -1.5 | |
| Liberal Democrat | Mike Day | 5,313 | 16.6 | +2.0 | |
| Plaid Cymru | Ian Titherington | 3,404 | 10.6 | +4.0 | |
| UKIP | Richard Lewis | 653 | 2.0 | N/A | |
| Green | Martyn Shrewsbury | 626 | 2.0 | N/A | |
| Socialist Alliance | Alec Thraves | 366 | 1.1 | N/A | |
| Majority | 9,550 | 29.7 | -6.0 | ||
| Turnout | 32,100 | 55.8 | -11.8 | ||
| Registered electors | 57,493 | ||||
| Labour hold | Swing | -6.0 | |||
Elections in the 1990s
| Party | Candidate | Votes | % | ± | |
|---|---|---|---|---|---|
| Labour | Alan Williams | 22,748 | 56.2 | +3.2 | |
| Conservative | Andrew Baker | 8,289 | 20.5 | -10.9 | |
| Liberal Democrat | John Newbury | 5,872 | 14.51 | +4.0 | |
| Plaid Cymru | Dai Lloyd | 2,675 | 6.61 | +2.8 | |
| Socialist Labour | David Proctor | 885 | 2.19 | N/A | |
| Majority | 14,459 | 35.7 | +14.1 | ||
| Turnout | 40,469 | 67.6 | -5.7 | ||
| Registered electors | 59,849 | ||||
| Labour hold | Swing | +7.1 | |||
| Party | Candidate | Votes | % | ± | |
|---|---|---|---|---|---|
| Labour | Alan Williams | 23,238 | 53.0 | +4.5 | |
| Conservative | Roy J. Perry | 13,760 | 31.4 | -1.6 | |
| Liberal Democrat | Martyn J. Shrewsbury | 4,620 | 10.5 | N/A | |
| Plaid Cymru | David Lloyd | 1,668 | 3.8 | +1.8 | |
| Green | Graham Oubridge | 564 | 1.3 | +0.3 | |
| Majority | 9,478 | 21.6 | +6.1 | ||
| Turnout | 43,850 | 73.3 | -2.7 | ||
| Registered electors | 59,785 | ||||
| Labour hold | Swing | +3.0 | |||
Elections in the 1980s
| Party | Candidate | Votes | % | ± | |
|---|---|---|---|---|---|
| Labour | Alan Williams | 22,089 | 48.54 | +2.42 | |
| Conservative | Nigel Evans | 15,027 | 33.02 | -3.62 | |
| Liberal | Martyn Ford | 7,019 | 15.42 | N/A | |
| Plaid Cymru | Nigel Williams | 902 | 1.98 | +0.12 | |
| Green | Julie Harman | 469 | 1.03 | +0.41 | |
| Majority | 7,062 | 15.52 | -10.03 | ||
| Turnout | 45,506 | 76.05 | +2.51 | ||
| Registered electors | 59,836 | ||||
| Labour hold | Swing | ||||
| Party | Candidate | Votes | % | ± | |
|---|---|---|---|---|---|
| Labour | Alan Williams | 18,042 | 42.12 | -3.98 | |
| Conservative | Julian Lewis | 15,692 | 36.64 | -8.69 | |
| Social Democratic | P Berry | 8,036 | 18.76 | N/A | |
| Plaid Cymru | Meirion Pennar | 795 | 1.86 | -0.07 | |
| Ecology | Graham Oubridge | 265 | 0.62 | N/A | |
| Majority | 2,350 | 5.49 | =4.73 | ||
| Turnout | 42,830 | 73.54 | -6.08 | ||
| Registered electors | 58,237 | ||||
| Labour hold | Swing | ||||
Elections in the 1970s
| Party | Candidate | Votes | % | ± | |
|---|---|---|---|---|---|
| Labour | Alan Williams | 24,175 | 46.10 | -0.03 | |
| Conservative | D Mercer | 23,774 | 45.33 | +9.08 | |
| Liberal | MJ Ball | 3,484 | 6.64 | -7.35 | |
| Plaid Cymru | Gruffydd R ap Gwent | 1,012 | 1.93 | -1.60 | |
| Majority | 401 | 0.76 | -9.13 | ||
| Turnout | 52,445 | 79.62 | +4.63 | ||
| Registered electors | 65,872 | ||||
| Labour hold | Swing | ||||
| Party | Candidate | Votes | % | ± | |
|---|---|---|---|---|---|
| Labour | Alan Williams | 22,565 | 46.13 | +2.76 | |
| Conservative | AP Thomas | 17,729 | 36.25 | -0.57 | |
| Liberal | BE Keal | 6,842 | 13.99 | -2.18 | |
| Plaid Cymru | Gruffydd R ap Gwent | 1,778 | 3.63 | +0.01 | |
| Majority | 4,836 | 9.89 | +3.35 | ||
| Turnout | 48,914 | 74.99 | -3.81 | ||
| Registered electors | 65,225 | ||||
| Labour hold | Swing | ||||
| Party | Candidate | Votes | % | ± | |
|---|---|---|---|---|---|
| Labour | Alan Williams | 22,124 | 43.37 | -6.84 | |
| Conservative | DRO Lewis | 18,786 | 36.82 | -6.79 | |
| Liberal | BE Keal | 8,248 | 16.17 | N/A | |
| Plaid Cymru | DK Hearne | 1,859 | 3.64 | -2.54 | |
| Majority | 3,338 | 6.54 | -0.06 | ||
| Turnout | 51,017 | 78.80 | +3.06 | ||
| Registered electors | 64,744 | ||||
| Labour hold | Swing | ||||
| Party | Candidate | Votes | % | ± | |
|---|---|---|---|---|---|
| Labour | Alan Williams | 24,622 | 50.21 | -6.18 | |
| Conservative | Hugh Rees | 21,384 | 43.61 | +0.0 | |
| Plaid Cymru | Gruffydd R ap Gwent | 3,033 | 6.18 | N/A | |
| Majority | 3,238 | 6.60 | -6.18 | ||
| Turnout | 49,039 | 75.74 | -4.65 | ||
| Registered electors | 64,745 | ||||
| Labour hold | Swing | ||||
Elections in the 1960s
| Party | Candidate | Votes | % | ± | |
|---|---|---|---|---|---|
| Labour | Alan Williams | 26,703 | 56.39 | +8.51 | |
| Conservative | Hugh Rees | 20,650 | 43.61 | +1.21 | |
| Majority | 6,053 | 12.78 | +7.29 | ||
| Turnout | 47,353 | 80.39 | -0.96 | ||
| Registered electors | 58,907 | ||||
| Labour hold | Swing | ||||
| Party | Candidate | Votes | % | ± | |
|---|---|---|---|---|---|
| Labour | Alan Williams | 23,019 | 47.88 | -1.70 | |
| Conservative | Hugh Rees | 20,382 | 42.40 | -8.02 | |
| Liberal | Owain Glyn Williams | 4,672 | 9.72 | N/A | |
| Majority | 2,637 | 5.49 | N/A | ||
| Turnout | 48,073 | 81.35 | +1.20 | ||
| Registered electors | 59,091 | ||||
| Labour gain from Conservative | Swing | ||||
Elections in the 1950s
| Party | Candidate | Votes | % | ± | |
|---|---|---|---|---|---|
| Conservative | Hugh Rees | 24,043 | 50.42 | +1.57 | |
| Labour | Percy Morris | 23,640 | 49.58 | -1.57 | |
| Majority | 403 | 0.85 | N/A | ||
| Turnout | 47,683 | 82.15 | N/A | ||
| Registered electors | 58,045 | ||||
| Conservative gain from Labour | Swing | ||||
| Party | Candidate | Votes | % | ± | |
|---|---|---|---|---|---|
| Labour | Percy Morris | 22,647 | 51.15 | -1.01 | |
| Conservative | Bernard McGlynn | 21,626 | 48.85 | +1.01 | |
| Majority | 1,021 | 2.31 | -2.01 | ||
| Turnout | 44,273 | 75.14 | -9.47 | ||
| Registered electors | 58,923 | ||||
| Labour hold | Swing | ||||
| Party | Candidate | Votes | % | ± | |
|---|---|---|---|---|---|
| Labour | Percy Morris | 26,061 | 52.16 | -1.59 | |
| Conservative | Henry Kerby | 23,901 | 47.84 | +1.59 | |
| Majority | 2,160 | 4.32 | -3.18 | ||
| Turnout | 49,962 | 84.61 | +0.86 | ||
| Registered electors | 59,051 | ||||
| Labour hold | Swing | ||||
| Party | Candidate | Votes | % | ± | |
|---|---|---|---|---|---|
| Labour | Percy Morris | 26,273 | 53.75 | -4.28 | |
| National Liberal and Conservative | Lewis Jones | 22,608 | 46.25 | +4.28 | |
| Majority | 3,665 | 7.50 | -8.56 | ||
| Turnout | 48,879 | 83.75 | -10.15 | ||
| Registered electors | 58,362 | ||||
| Labour hold | Swing | ||||
Election in the 1940s
| Party | Candidate | Votes | % | ± | |
|---|---|---|---|---|---|
| Labour | Percy Morris | 18,098 | 58.03 | +5.10 | |
| Liberal National | Lewis Jones | 13,089 | 41.97 | -5.10 | |
| Majority | 5,009 | 16.06 | N/A | ||
| Turnout | 31,187 | 73.60 | -6.37 | ||
| Registered electors | 42,373 | ||||
| Labour gain from Liberal National | Swing | ||||
Elections in the 1930s
General Election 1939/40: Another general election was required to take place before the end of 1940. The political parties had been making preparations for an election to take place from 1939 and by the end of this year, the following candidates had been selected;
- Liberal National: Lewis Jones
- Labour: Percy Morris
| Party | Candidate | Votes | % | ± | |
|---|---|---|---|---|---|
| Liberal National | Lewis Jones | 18,784 | 52.93 | -5.62 | |
| Labour | Percy Morris | 16,703 | 47.07 | +5.62 | |
| Majority | 2,081 | 5.86 | +11.24 | ||
| Turnout | 35,487 | 79.97 | -4.46 | ||
| Registered electors | 44,373 | ||||
| Liberal National hold | Swing | ||||
| Party | Candidate | Votes | % | ± | |
|---|---|---|---|---|---|
| Liberal National | Lewis Jones | 20,603 | 58.55 | N/A | |
| Labour | Howel Samuel | 14,587 | 41.45 | +0.85 | |
| Majority | 6,016 | 17.10 | N/A | ||
| Turnout | 35,190 | 84.43 | +2.73 | ||
| Registered electors | 41,680 | ||||
| Liberal National gain from Labour | Swing | ||||
Elections in the 1920s
| Party | Candidate | Votes | % | ± | |
|---|---|---|---|---|---|
| Labour | Howel Samuel | 13,268 | 40.6 | +7.2 | |
| Liberal | Charles Kerr | 12,625 | 38.6 | +2.2 | |
| Unionist | Alfred William Ernest Wynne | 6,794 | 20.8 | -9.4 | |
| Majority | 643 | 2.0 | N/A | ||
| Turnout | 32,687 | 81.7 | N/A | ||
| Registered electors | 40,021 | ||||
| Labour gain from Liberal | Swing | +2.5 | |||
| Party | Candidate | Votes | % | ± | |
|---|---|---|---|---|---|
| Liberal | Walter Runciman | 10,033 | 36.4 | +2.1 | |
| Labour | Howel Samuel | 9,188 | 33.4 | -1.4 | |
| Unionist | William Hewins | 8,324 | 30.2 | -0.7 | |
| Majority | 845 | 3.0 | N/A | ||
| Turnout | 27,545 | 87.0 | +1.7 | ||
| Registered electors | 31,674 | ||||
| Liberal gain from Labour | Swing | +1.75 | |||
| Party | Candidate | Votes | % | ± | |
|---|---|---|---|---|---|
| Labour | Howel Samuel | 9,260 | 34.8 | +2.7 | |
| Liberal | Alfred Mond | 9,145 | 34.3 | -1.2 | |
| Unionist | William Hewins | 8,238 | 30.9 | -1.5 | |
| Majority | 115 | 0.5 | N/A | ||
| Turnout | 26,643 | 85.3 | +1.4 | ||
| Registered electors | 31,237 | ||||
| Labour gain from Liberal | Swing | +1.9 | |||
| Party | Candidate | Votes | % | ± | |
|---|---|---|---|---|---|
| National Liberal | Alfred Mond | 9,278 | 35.5 | -4.5 | |
| Unionist | William Hewins | 8,476 | 32.4 | -2.0 | |
| Labour | Howel Samuel | 8,401 | 32.1 | +6.5 | |
| Majority | 802 | 3.1 | -2.5 | ||
| Turnout | 26,155 | 83.9 | +16.5 | ||
| Registered electors | 31,178 | ||||
| National Liberal hold | Swing | -1.25 | |||
Elections in the 1910s
| Party | Candidate | Votes | % | ± | |
|---|---|---|---|---|---|
| C | Liberal | Alfred Mond | 8,579 | 40.0 | N/A |
| Unionist | David Davies | 7,398 | 34.4 | N/A | |
| Labour | John James Powesland | 5,510 | 25.6 | N/A | |
| Majority | 1,181 | 5.6 | N/A | ||
| Turnout | 21,487 | 67.4 | N/A | ||
| Registered electors | 31,884 | ||||
| Liberal win (new seat) | |||||
| C indicates candidate endorsed by the coalition government. | |||||
See also
Notes and references
- ↑ "Beyond 20/20 WDS - Table view". 2011 Electorate Figures. StatsWales. 1 December 2010. Retrieved 13 March 2011.
- ↑ Craig, F.W.S., ed. (1972). Boundaries of parliamentary constituencies 1985-1972. Chichester, Sussex: Political Reference Publications. ISBN 0-900178-09-4.
- ↑ Leigh Rayment's Historical List of MPs – Constituencies beginning with "S" (part 6)
- ↑ "Swansea West parliamentary constituency - Election 2017 - BBC News". Retrieved 10 June 2017.
- ↑ "Election Data 2015". Electoral Calculus. Archived from the original on 17 October 2015. Retrieved 17 October 2015.
- ↑ "Swansea results". Results - UK Parliamentary general election 2015. City and County of Swansea. Retrieved 21 September 2015.
- ↑ "ronniejob". Retrieved 22 January 2015.
- ↑ http://www.worldsocialism.org/spgb/forum/world-socialist-movement/general-election-news-release
- ↑ "Co-op Party MPs". Members of Parliament. The Co-operative Party. Retrieved 6 September 2015.
- ↑ "Swansea Persons Nominated". Notices (UK parliamentary general election 2015). City and County of Swansea. Retrieved 6 September 2015.
- ↑ "Election Data 2010". Electoral Calculus. Archived from the original on 26 July 2013. Retrieved 17 October 2015.
- ↑ Swansea West BBC Election -Swansea West
- ↑ René Kinzett - Swansea Conservatives René Kinzett - Swansea Conservatives
- ↑ "Election Data 2005". Electoral Calculus. Archived from the original on 15 October 2011. Retrieved 18 October 2015.
- ↑ "Election Data 2001". Electoral Calculus. Archived from the original on 15 October 2011. Retrieved 18 October 2015.
- ↑ "Election Data 1997". Electoral Calculus. Archived from the original on 15 October 2011. Retrieved 18 October 2015.
- ↑ http://www.politicsresources.net/area/uk/constit/535.htm
- ↑ "Election Data 1992". Electoral Calculus. Archived from the original on 15 October 2011. Retrieved 18 October 2015.
- ↑ "Politics Resources". Election 1992. Politics Resources. 9 April 1992. Retrieved 2010-12-06.
- ↑ "Election Data 1987". Electoral Calculus. Archived from the original on 15 October 2011. Retrieved 18 October 2015.
- ↑ "Election Data 1983". Electoral Calculus. Archived from the original on 15 October 2011. Retrieved 18 October 2015.
- ↑ The Times' Guide to the House of Commons. 1950.
- ↑ British Parliamentary Election Results 1918-1949, FWS Craig
- ↑ Etholiadau'r ganrif, Beti Jones (1999)
- ↑ Etholiadau'r ganrif 1885-1997, Beti Jones
- ↑ Etholiadau'r ganrif, Beti Jones (1999)
- ↑ Etholiadau'r ganrif, Beti Jones (1999)
External links
- Politics Resources (Election results from 1922 onwards)
- Electoral Calculus (Election results from 1955 onwards)
- 2017 Election House Of Commons Library 2017 Election report
- A Vision Of Britain Through Time (Constituency elector numbers)
| Parliament of the United Kingdom | ||
|---|---|---|
| Preceded by Linlithgow |
Constituency represented by the Father of the House 2005-2010 |
Succeeded by Louth and Horncastle |