South West Norfolk (UK Parliament constituency)
| South West Norfolk | |
|---|---|
|
County constituency for the House of Commons | |
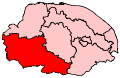 Boundary of South West Norfolk in Norfolk. | |
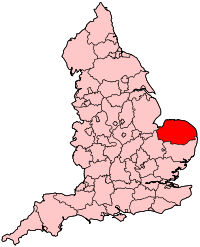 Location of Norfolk within England. | |
| County | Norfolk |
| Electorate | 75,034 (December 2010)[1] |
| Major settlements | Downham Market, Swaffham and Thetford |
| Current constituency | |
| Created | 1885 |
| Member of parliament | Elizabeth Truss (Conservative) |
| Number of members | One |
| Created from | South Norfolk and West Norfolk |
| Overlaps | |
| European Parliament constituency | East of England |
South West Norfolk is a constituency[n 1] represented in the House of Commons of the UK Parliament since 2010 by Elizabeth Truss, a Conservative.[n 2]
Boundaries
1885-1918: The part of the Municipal Borough of Thetford in the county of Norfolk, and the Sessional Divisions of Clackclose, Grimshoe, South Greenhoe, and Wayland.
1918-1950: The Municipal Borough of Thetford, the Urban Districts of Downham Market, East Dereham, and Swaffham, the Rural Districts of Mitford and Launditch, and Swaffham, and parts of the Rural Districts of Downham, Marshland, and Thetford.
1950-1983: The Urban Districts of Downham Market, East Dereham, and Swaffham, and the Rural Districts of Downham, Mitford and Launditch, and Swaffham.
1983-2010: The District of Breckland wards of All Saints, Besthorpe, Buckenham, Conifer, East Guiltcross, Haggard De Toni, Harling, Haverscroft, Heathlands, Mid Forest, Nar Valley, Necton, Peddars Way, Queen's, Swaffham, Templar, Thetford Abbey, Thetford Barnham Cross, Thetford Guildhall, Thetford Saxon, Watton, Wayland, Weeting, West Guiltcross, and Wissey, and the Borough of King's Lynn and West Norfolk wards of Airfield, Denton, Denver, Downham Market, Emneth, Ten Mile, Upwell Outwell and Delph, Watlington, and Wissey.
2010-present: The District of Breckland wards of Conifer, East Guiltcross, Harling and Heathlands, Mid Forest, Nar Valley, Swaffham, Thetford Abbey, Thetford Castle, Thetford Guildhall, Thetford Saxon, Wayland, Weeting, and West Guiltcross, and the Borough of King's Lynn and West Norfolk wards of Airfield, Denton, Downham Old Town, East Downham, Emneth with Outwell, Hilgay with Denver, Mershe Lande, North Downham, St Lawrence, South Downham, Upwell and Delph, Walton, Watlington, Wiggenhall, and Wimbotsham with Fincham Wissey.
The constituency includes Downham Market, Swaffham, Thetford, Outwell, Upwell, and Feltwell.
Fifth Periodic Review of Westminster constituencies
After the Boundary Commission's report for 2010, South West Norfolk gained wards from neighbouring North West Norfolk including Walpole, Tilney St Lawrence, and Wiggenhall villages. It lost to Mid Norfolk the wards of All Saints, Buckenham, Burgh and Haverscroft, Haggard De Toni, Necton, Queen's, Templar and Watton, which included the villages of Necton, Great Ellingham and Watton.
History
South West Norfolk has been held solidly by Conservatives since 1964 but for twenty years before then, it had been ultra-marginal: Labour first held it from 1929–31, and Sidney Dye won it for Labour in 1945 with a tiny majority of 53, holding it at the 1950 election by 260. He lost it to Denys Bullard in 1951 by 442 votes and won it back in 1955 with a majority of 193. Dye died at the end of 1958, and in the by-election Albert Hilton retained the seat for Labour by a margin of 1,354 votes. In the 1959 general election that soon followed, his majority was cut to 78.[2]
Although Labour thus had held the seat during two Conservative national election victories, the Conservatives took the seat in the 1964 election, which Labour won nationally. Paul Hawkins and Gillian Shephard held the seat. Shephard's majority was slashed in the 1997 general election before recovering in the 2001 general election.[2]
Shephard decided not to run again in 2005 and was elevated to a peerage. The Conservative Party selected Christopher Fraser, former MP for Mid Dorset and Poole North and he was elected with a majority of over 10,000.
On 28 May 2009, Fraser announced that he would be standing down at the 2010 general election citing family reasons.[3] This was after his expenses claims were highlighted in the Daily Telegraph; according to the newspaper, Fraser claimed £1,800 in public money for buying 215 trees and marking out the boundary of his second home in the constituency.[4]
Constituency profile
Workless claimants (registered jobseekers) were in November 2012 lower than the national average of 3.8%, at 3.0% of the population based on a statistical compilation by The Guardian.[5]
Members of Parliament
Elections
Elections in the 2010s
| Party | Candidate | Votes | % | ± | |
|---|---|---|---|---|---|
| Conservative | Elizabeth Truss[8] | 32,894 | 62.8 | +11.9 | |
| Labour | Peter Smith[8] | 14,582 | 27.8 | +10.5 | |
| UKIP | David Williams | 2,575 | 4.9 | -18.4 | |
| Liberal Democrat | Stephen Gordon | 2,365 | 4.5 | +0.1 | |
| Majority | 18,312 | 35.0 | +7.4 | ||
| Turnout | 52,416 | 67 | +1.9 | ||
| Conservative hold | Swing | +0.7 | |||
| Party | Candidate | Votes | % | ± | |
|---|---|---|---|---|---|
| Conservative | Elizabeth Truss[8] | 25,515 | 50.9 | +2.6 | |
| UKIP | Paul Smyth[9] | 11,654 | 23.3 | +17.0 | |
| Labour | Peter Smith[8] | 8,649 | 17.3 | −1.3 | |
| Liberal Democrat | Rupert Moss-Eccardt[10] | 2,217 | 4.4 | −17.2 | |
| Green | Sandra Walmsley[11] | 2,075 | 4.1 | +2.5 | |
| Majority | 13,861 | 27.6 | +1.0 | ||
| Turnout | 50,110 | 65.1 | −1.1 | ||
| Conservative hold | Swing | -7.2 | |||
| Party | Candidate | Votes | % | ± | |
|---|---|---|---|---|---|
| Conservative | Elizabeth Truss | 23,753 | 48.3 | +3.4 | |
| Liberal Democrat | Stephen Gordon | 10,613 | 21.6 | +2.4 | |
| Labour | Peter Smith | 9,119 | 18.6 | -11.4 | |
| UKIP | Kay Hipsey[13] | 3,061 | 6.2 | +1.5 | |
| BNP | Dennis Pearce[14] | 1,774 | 3.6 | +3.6 | |
| Green | Lori Allen | 830 | 1.7 | +1.7 | |
| Majority | 13,140 | 26.7 | +8.4 | ||
| Turnout | 49,150 | 66.2 | +4.1 | ||
| Conservative hold | Swing | ||||
Elections in the 2000s
| Party | Candidate | Votes | % | ± | |
|---|---|---|---|---|---|
| Conservative | Christopher Fraser | 25,881 | 46.9 | −5.3 | |
| Labour | Charmaine Morgan | 15,795 | 28.7 | −5.8 | |
| Liberal Democrat | April Pond | 10,207 | 18.5 | +7.8 | |
| UKIP | Delia Hall | 2,738 | 5.0 | +2.4 | |
| Independent | Kim Hayes | 506 | 0.9 | N/A | |
| Majority | 10,086 | 18.3 | |||
| Turnout | 55,127 | 62.5 | −0.6 | ||
| Conservative hold | Swing | +0.3 | |||
| Party | Candidate | Votes | % | ± | |
|---|---|---|---|---|---|
| Conservative | Gillian Shephard | 27,633 | 52.2 | +10.2 | |
| Labour | Anne Hanson | 18,267 | 34.5 | −3.3 | |
| Liberal Democrat | Gordon Dean | 5,681 | 10.7 | −3.2 | |
| UKIP | Ian Smith | 1,368 | 2.6 | N/A | |
| Majority | 9,366 | 17.7 | +13.5 | ||
| Turnout | 52,949 | 63.1 | −10.0 | ||
| Conservative hold | Swing | +6.7 | |||
Elections in the 1990s
| Party | Candidate | Votes | % | ± | |
|---|---|---|---|---|---|
| Conservative | Gillian Shephard | 24,694 | 42.0 | −12.6 | |
| Labour | Adrian Hefferman | 22,230 | 37.8 | +10.7 | |
| Liberal Democrat | David J. Bucton | 8,178 | 13.9 | −6.3 | |
| Referendum | Ronnie J.B. Hoare | 3,694 | 6.3 | N/A | |
| Majority | 2,434 | 4.2 | −23.3 | ||
| Turnout | 58,796 | 73.1 | −6.2 | ||
| Conservative hold | Swing | −11.65 | |||
| Party | Candidate | Votes | % | ± | |
|---|---|---|---|---|---|
| Conservative | Gillian Shephard | 33,637 | 54.6 | −3.0 | |
| Labour | Mary Page | 16,706 | 27.1 | +6.1 | |
| Liberal Democrat | John T. Marsh | 11,237 | 18.2 | −3.2 | |
| Majority | 16,931 | 27.5 | −8.7 | ||
| Turnout | 61,580 | 79.3 | +3.3 | ||
| Conservative hold | Swing | −4.6 | |||
Elections in the 1980s
| Party | Candidate | Votes | % | ± | |
|---|---|---|---|---|---|
| Conservative | Gillian Shephard | 32,519 | 57.6 | +1.9 | |
| Liberal | Malcolm Scott | 12,083 | 21.4 | −5.3 | |
| Labour | Mary Page | 11,844 | 21.0 | +3.4 | |
| Majority | 20,436 | 36.2 | |||
| Turnout | 76.0 | ||||
| Conservative hold | Swing | ||||
| Party | Candidate | Votes | % | ± | |
|---|---|---|---|---|---|
| Conservative | Paul Hawkins | 28,632 | 55.7 | ||
| Liberal | E.B.S. Baxter | 13,722 | 26.7 | ||
| Labour | A.L. Rosenberg | 9,072 | 17.6 | ||
| Majority | 14,910 | 29.0 | |||
| Turnout | 73.1 | ||||
| Conservative hold | Swing | ||||
Elections in the 1970s
| Party | Candidate | Votes | % | ± | |
|---|---|---|---|---|---|
| Conservative | Paul Hawkins | 24,767 | 54.80 | ||
| Labour | AL Rosenberg | 14,063 | 31.12 | ||
| Liberal | B Baxter | 6,363 | 14.08 | ||
| Majority | 10,704 | 23.69 | |||
| Turnout | 78.05 | ||||
| Conservative hold | Swing | ||||
| Party | Candidate | Votes | % | ± | |
|---|---|---|---|---|---|
| Conservative | Paul Hawkins | 19,778 | 47.90 | ||
| Labour | H Toch | 14,850 | 35.97 | ||
| Liberal | B Baxter | 6,658 | 16.13 | ||
| Majority | 4,928 | 11.94 | |||
| Turnout | 76.86 | ||||
| Conservative hold | Swing | ||||
| Party | Candidate | Votes | % | ± | |
|---|---|---|---|---|---|
| Conservative | Paul Hawkins | 20,430 | 46.24 | ||
| Labour | H Toch | 14,387 | 32.56 | ||
| Liberal | KW Nash | 8,986 | 20.34 | ||
| Independent Powellite | MM McNee | 380 | 0.86 | ||
| Majority | 6,043 | 13.68 | |||
| Turnout | 82.94 | ||||
| Conservative hold | Swing | ||||
| Party | Candidate | Votes | % | ± | |
|---|---|---|---|---|---|
| Conservative | Paul Hawkins | 22,220 | 57.28 | ||
| Labour | Leslie J Potter | 16,572 | 42.72 | ||
| Majority | 5,648 | 14.56 | |||
| Turnout | 80.46 | ||||
| Conservative hold | Swing | ||||
Elections in the 1960s
| Party | Candidate | Votes | % | ± | |
|---|---|---|---|---|---|
| Conservative | Paul Hawkins | 17,880 | 51.11 | ||
| Labour | Noel James Insley | 17,105 | 48.89 | ||
| Majority | 775 | 2.22 | |||
| Turnout | 84.00 | ||||
| Conservative hold | Swing | ||||
| Party | Candidate | Votes | % | ± | |
|---|---|---|---|---|---|
| Conservative | Paul Hawkins | 16,728 | 49.55 | ||
| Labour | Albert Hilton | 16,605 | 49.19 | ||
| Independent | Victor Welch | 427 | 1.26 | ||
| Majority | 123 | 0.36 | |||
| Turnout | 81.96 | ||||
| Conservative gain from Labour | Swing | ||||
Elections in the 1950s
| Party | Candidate | Votes | % | ± | |
|---|---|---|---|---|---|
| Labour | Albert Hilton | 16,858 | 50.12 | ||
| Conservative | Mary Kellett | 16,780 | 49.88 | ||
| Majority | 78 | 0.23 | |||
| Turnout | 83.5 | ||||
| Labour hold | Swing | ||||
| Party | Candidate | Votes | % | ± | |
|---|---|---|---|---|---|
| Labour | Albert Hilton | 15,314 | 50.95 | +0.66 | |
| Conservative | Mary Kellett | 13,960 | 46.44 | -3.27 | |
| Independent Nationalist | Andrew Fountaine | 785 | 2.61 | N/A | |
| Majority | 1,354 | 4.51 | +3.93 | ||
| Turnout | 30,059 | ||||
| Labour hold | Swing | ||||
| Party | Candidate | Votes | % | ± | |
|---|---|---|---|---|---|
| Labour | Sidney Dye | 16,781 | 50.29 | ||
| Conservative | Denys Bullard | 16,588 | 49.71 | ||
| Majority | 193 | 0.58 | |||
| Turnout | 82.60 | ||||
| Labour gain from Conservative | Swing | ||||
| Party | Candidate | Votes | % | ± | |
|---|---|---|---|---|---|
| Conservative | Denys Bullard | 16,970 | 50.66 | ||
| Labour | Sidney Dye | 16,528 | 49.34 | ||
| Majority | 442 | 1.32 | |||
| Turnout | 82.61 | ||||
| Conservative gain from Labour | Swing | ||||
| Party | Candidate | Votes | % | ± | |
|---|---|---|---|---|---|
| Labour | Sidney Dye | 15,649 | 47.35 | ||
| Conservative | Denys Bullard | 15,389 | 46.57 | ||
| Liberal | George Stephen Dennis | 2,009 | 6.08 | ||
| Majority | 260 | 0.79 | |||
| Turnout | 83.41 | ||||
| Labour hold | Swing | ||||
Election in the 1940s
| Party | Candidate | Votes | % | ± | |
|---|---|---|---|---|---|
| Labour | Sidney Dye | 15,091 | 50.09 | ||
| Conservative | Somerset de Chair | 15,038 | 49.91 | ||
| Majority | 53 | 0.18 | |||
| Turnout | 65.92 | ||||
| Labour gain from Conservative | Swing | ||||
Elections in the 1930s
| Party | Candidate | Votes | % | ± | |
|---|---|---|---|---|---|
| Conservative | Somerset de Chair | 16,060 | 57.35 | ||
| Labour | Sidney Dye | 11,943 | 42.65 | ||
| Majority | 4,117 | 14.70 | |||
| Turnout | 69.50 | ||||
| Conservative hold | Swing | ||||
| Party | Candidate | Votes | % | ± | |
|---|---|---|---|---|---|
| Conservative | Alan McLean | 19,614 | 66.34 | ||
| Labour | William Taylor | 9,952 | 33.66 | ||
| Majority | 9,662 | 32.68 | |||
| Turnout | 74.54 | ||||
| Conservative hold | Swing | ||||
Elections in the 1920s
| Party | Candidate | Votes | % | ± | |
|---|---|---|---|---|---|
| Labour | William Taylor | 12,152 | 41.8 | −0.2 | |
| Unionist | Alan McLean | 11,382 | 39.1 | −18.9 | |
| Liberal | Victor Diederichs Duval | 5,556 | 19.1 | N/A | |
| Majority | 770 | 2.7 | N/A | ||
| Turnout | 29,090 | 74.1 | +2.1 | ||
| Registered electors | 39,277 | ||||
| Labour gain from Unionist | Swing | +9.4 | |||
| Party | Candidate | Votes | % | ± | |
|---|---|---|---|---|---|
| Unionist | Alan McLean | 13,838 | 58.0 | +4.5 | |
| Labour | William Taylor | 10,004 | 42.0 | −4.5 | |
| Majority | 3,834 | 16.0 | +9.0 | ||
| Turnout | 23,842 | 72.0 | +7.3 | ||
| Registered electors | 33,131 | ||||
| Unionist hold | Swing | +4.5 | |||
| Party | Candidate | Votes | % | ± | |
|---|---|---|---|---|---|
| Unionist | Alan McLean | 11,269 | 53.5 | N/A | |
| Labour | William Taylor | 9,779 | 46.5 | +1.2 | |
| Majority | 1,490 | 7.0 | N/A | ||
| Turnout | 21,048 | 64.7 | +5.6 | ||
| Registered electors | 32,543 | ||||
| Unionist gain from National Liberal | Swing | N/A | |||
| Party | Candidate | Votes | % | ± | |
|---|---|---|---|---|---|
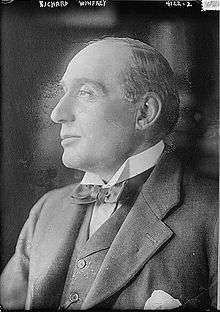
| National Liberal | Richard Winfrey | 10,432 | 54.7 | N/A | |
| Labour | William Taylor | 8,655 | 45.3 | N/A | |
| Majority | 1,777 | 9.4 | N/A | ||
| Turnout | 19,087 | 59.1 | N/A | ||
| Registered electors | 32,305 | ||||
| National Liberal hold | Swing | N/A | |||
Elections in the 1910s
| Party | Candidate | Votes | % | ± | |
|---|---|---|---|---|---|
| C | Liberal | Richard Winfrey | Unopposed | ||
| Liberal hold | |||||
| C indicates candidate endorsed by the coalition government. | |||||
| Party | Candidate | Votes | % | ± | |
|---|---|---|---|---|---|
| Liberal | Richard Winfrey | 4,176 | 52.7 | +1.2 | |
| Conservative | Albert Edward Stanley Clarke | 3,745 | 47.3 | -1.2 | |
| Majority | 431 | 5.4 | +2.4 | ||
| Turnout | 7,921 | 87.6 | -3.5 | ||
| Liberal hold | Swing | +1.2 | |||
| Party | Candidate | Votes | % | ± | |
|---|---|---|---|---|---|
| Liberal | Richard Winfrey | 4,239 | 51.5 | -4.2 | |
| Conservative | Thomas Hare | 4,000 | 48.5 | +4.2 | |
| Majority | 239 | 3.0 | -8.4 | ||
| Turnout | 8,239 | 91.1 | +2.4 | ||
| Liberal hold | Swing | -4.2 | |||
Elections in the 1900s
| Party | Candidate | Votes | % | ± | |
|---|---|---|---|---|---|
| Liberal | Richard Winfrey | 4,416 | 55.7 | +6.1 | |
| Conservative | Thomas Hare | 3,513 | 44.3 | -6.1 | |
| Majority | 903 | 10.4 | 12.2 | ||
| Turnout | 7,929 | 88.7 | +4.7 | ||
| Registered electors | 8,936 | ||||
| Liberal gain from Conservative | Swing | +6.1 | |||
| Party | Candidate | Votes | % | ± | |
|---|---|---|---|---|---|
| Conservative | Thomas Hare | 3,702 | 50.4 | -0.9 | |
| Liberal | Richard Winfrey | 3,636 | 49.6 | +0.9 | |
| Majority | 66 | 0.8 | -1.8 | ||
| Turnout | 7,338 | 84.0 | -0.8 | ||
| Registered electors | 8,740 | ||||
| Conservative hold | Swing | -0.9 | |||
Elections in the 1890s
| Party | Candidate | Votes | % | ± | |
|---|---|---|---|---|---|
| Conservative | Thomas Hare | 3,968 | 51.3 | −0.9 | |
| Liberal | Richard Winfrey | 3,762 | 48.7 | +0.9 | |
| Majority | 206 | 2.6 | −1.8 | ||
| Turnout | 7,730 | 84.8 | −7.2 | ||
| Registered electors | 9,119 | ||||
| Conservative hold | Swing | −0.9 | |||
| Party | Candidate | Votes | % | ± | |
|---|---|---|---|---|---|
| Conservative | Thomas Hare | 4,077 | 52.2 | N/A | |
| Liberal | Henry Lee-Warner | 3,739 | 47.8 | N/A | |
| Majority | 338 | 4.4 | N/A | ||
| Turnout | 7,816 | 92.0 | N/A | ||
| Registered electors | 8,499 | ||||
| Conservative hold | Swing | N/A | |||
Elections in the 1880s
| Party | Candidate | Votes | % | ± | |
|---|---|---|---|---|---|
| Conservative | William Tyssen-Amherst | Unopposed | |||
| Conservative hold | |||||
| Party | Candidate | Votes | % | ± | |
|---|---|---|---|---|---|
| Conservative | William Tyssen-Amherst | 4,096 | 52.0 | N/A | |
| Liberal | William Gurdon | 3,776 | 48.0 | N/A | |
| Majority | 320 | 4.0 | N/A | ||
| Turnout | 7,872 | 83.8 | N/A | ||
| Registered electors | 9,391 | ||||
| Conservative win (new seat) | |||||
See also
Notes and references
- Notes
- ↑ A county constituency (for the purposes of election expenses and type of returning officer)
- ↑ As with all constituencies, the constituency elects one Member of Parliament (MP) by the first past the post system of election at least every five years.
- References
- ↑ "Electorate Figures – Boundary Commission for England". 2011 Electorate Figures. Boundary Commission for England. 4 March 2011. Archived from the original on 6 November 2010. Retrieved 13 March 2011.
- 1 2 3 "Political Science Resources: links to UK and US politics". www.psr.keele.ac.uk.
- ↑ "BBC NEWS - UK - UK Politics - MP Fraser poised to leave Commons". news.bbc.co.uk.
- ↑ Swaine, By Jon. "MPs' expenses: Christopher Fraser says that claim for trees was necessary".
- ↑ Unemployment claimants by constituency The Guardian
- ↑ Leigh Rayment's Historical List of MPs – Constituencies beginning with "N" (part 2)
- 1 2 "Election Data 2015". Electoral Calculus. Archived from the original on 17 October 2015. Retrieved 17 October 2015.
- 1 2 3 4 "Norfolk South West 2015". electionresults.blogspot.co.uk.
- ↑ "UKIP South West Norfolk - Thetford Swaffham Downham Market". UKIP South West Norfolk - Thetford Swaffham Downham Market.
- ↑ http://www.libdems.org.uk/general_election_candidates#East of England
- ↑ "Candidates". YourNextMP. Retrieved 1 March 2015.
- ↑ "Election Data 2010". Electoral Calculus. Archived from the original on 26 July 2013. Retrieved 17 October 2015.
- ↑ http://candidates.ukip.org/index.php?pg=show&eid=399
- ↑ "Archived copy". Archived from the original on 2010-04-14. Retrieved 2010-03-11.
- ↑ "Election Data 2005". Electoral Calculus. Archived from the original on 15 October 2011. Retrieved 18 October 2015.
- ↑ "Election Data 2001". Electoral Calculus. Archived from the original on 15 October 2011. Retrieved 18 October 2015.
- ↑ "Election Data 1997". Electoral Calculus. Archived from the original on 15 October 2011. Retrieved 18 October 2015.
- ↑ "Election Data 1992". Electoral Calculus. Archived from the original on 15 October 2011. Retrieved 18 October 2015.
- ↑ "UK General Election results April 1992". Richard Kimber's Political Science Resources. Politics Resources. 9 April 1992. Retrieved 2010-12-06.
- ↑ "Election Data 1987". Electoral Calculus. Archived from the original on 15 October 2011. Retrieved 18 October 2015.
- ↑ "Election Data 1983". Electoral Calculus. Archived from the original on 15 October 2011. Retrieved 18 October 2015.
- 1 2 3 4 Craig, F. W. S. (1983). British parliamentary election results 1918–1949 (3 ed.). Chichester: Parliamentary Research Services. ISBN 0-900178-06-X.
- 1 2 3 4 5 6 7 8 British parliamentary election results, 1885–1918 (Craig)
- 1 2 3 The Liberal Year Book, 1907
- ↑ Debrett's House of Commons & Judicial Bench, 1886