Mid Norfolk (UK Parliament constituency)
| Mid Norfolk | |
|---|---|
|
County constituency for the House of Commons | |
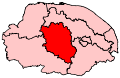 Boundary of Mid Norfolk in Norfolk for the 2010 general election. | |
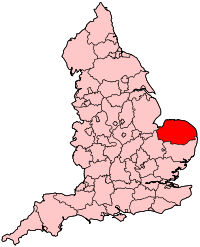 Location of Norfolk within England. | |
| County | Norfolk |
| Electorate | 75,080 (December 2010)[1] |
| Major settlements | Dereham and Wymondham |
| Current constituency | |
| Created | 1983 |
| Member of parliament | George Freeman (Conservative) |
| Number of members | One |
| Created from | Norfolk North, Norfolk South West and Yarmouth[2] |
| 1885–1918 | |
| Number of members | One |
| Type of constituency | County constituency |
| Replaced by | South Norfolk and South West Norfolk |
| Created from | North Norfolk, South Norfolk and West Norfolk |
| Overlaps | |
| European Parliament constituency | East of England |
Mid Norfolk is a constituency[n 1] represented in the House of Commons of the UK Parliament since 2010 by George Freeman, a Conservative.[n 2]
Boundaries
1885-1918: The Sessional Divisions of Forehoes, Guiltcross and Shropham, and Mitford and Launditch.
1983-1997: The District of Breckland wards of Beetley and Gressenhall, East Dereham Neatherd, East Dereham St Withburga, East Dereham Toftwood, East Dereham Town, Eynsford, Hermitage, Launditch, Mattishall, Shipworth, Springvale, Swanton Morley, Taverner, Two Rivers, Upper Wensum, and Upper Yare, and the District of Broadland wards of Acle, Aylsham, Blofield, Brundall, Burlingham, Buxton, Cawston, Coltishall, Drayton, Foulsham, Freethorpe, Great Witchingham, Hainford, Hevingham, Horsford, Plumstead, Rackheath, Reedham, Reepham, South Walsham, Spixworth, St Faiths, Taverham, and Wroxham.
1997-2010: The District of Breckland wards of Beetley and Gressenhall, East Dereham Neatherd, East Dereham St Withburga, East Dereham Toftwood, East Dereham Town, Eynsford, Hermitage, Launditch, Mattishall, Shipworth, Springvale, Swanton Morley, Taverner, Two Rivers, Upper Wensum, and Upper Yare, and the District of Broadland wards of Acle, Aylsham, Blofield, Brundall, Burlingham, Buxton, Cawston, Coltishall, Foulsham, Freethorpe, Great Witchingham, Hainford, Hevingham, Horsford, Plumstead, Rackheath, Reedham, Reepham, South Walsham, Spixworth, St Faiths, and Wroxham.
2010–present: The District of Breckland wards of All Saints, Buckenham, Burgh and Haverscroft, Dereham Central, Dereham Humbletoft, Dereham Neatherd, Dereham Toftwood, Eynsford, Haggard De Toni, Hermitage, Launditch, Necton, Queen’s, Shipdham, Springvale and Scarning, Swanton Morley, Taverner, Templar, Two Rivers, Upper Wensum, Upper Yare, Watton, and Wissey, and the District of South Norfolk wards of Abbey, Cromwells, Hingham and Deopham, Northfields, Rustens, Town, and Wicklewood.
Latest boundary review
The Boundary Commission's Fifth Periodic Review of Westminster constituencies for the 2010 election created a new constituency, Broadland, based on the local government district of the same name, which took electoral wards from the existing North Norfolk and Mid Norfolk seats, with consequential compensatory additions to both from neighbouring constituencies.
The former MP for Mid Norfolk, Keith Simpson, was selected to contest the newly created Broadland constituency.[3]
History
Parliament first created the constituency in the Redistribution of Seats Act 1885, however this did not last beyond 1918 when it was absorbed by neighbouring constituencies in a redistribution.
The present creation of the constituency is the second creation, dating to 1983, since which the area has only elected and been served by a Conservative MP.
Members of Parliament
MPs 1885–1918
| Election | Member[4] | Party | Notes | |
|---|---|---|---|---|
| 1885 | Robert Gurdon | Liberal | Gurdon was elected as a Liberal, but joined the Liberal Unionists when the party split | |
| 1886 | Liberal Unionist | |||
| 1892 | Clement Higgins | Liberal | Higgins was elected as a Liberal, but later joined the Liberal Unionists. He resigned his seat in 1895 | |
| ??? | Liberal Unionist | |||
| 1895 by-election | Robert Gurdon | Liberal Unionist | later Baron Cranworth | |
| 1895 | Frederick Wilson | Liberal | ||
| 1906 | John Wodehouse, Lord Wodehouse | Liberal | later 3rd Earl of Kimberley | |
| 1910 (Jan) | William Boyle | Liberal Unionist | ||
| 1918 by-election | Neville Jodrell | Conservative | Later MP for King's Lynn | |
| 1918 | Constituency abolished, but re-established 1983 | |||
MPs since 1983
| Election | Member[4] | Party | |
|---|---|---|---|
| 1983 | Richard Ryder | Conservative | |
| 1997 | Keith Simpson | Conservative | |
| 2010 | George Freeman | Conservative | |
Elections
Elections in the 2010s
| Party | Candidate | Votes | % | ± | |
|---|---|---|---|---|---|
| Conservative | George Freeman | 32,828 | 59.0 | +6.9 | |
| Labour | Sarah Simpson | 16,742 | 30.1 | +11.7 | |
| Liberal Democrat | Fionna Tod | 2,848 | 5.1 | −1.2 | |
| UKIP | Tracy Knowles | 2,092 | 3.8 | −15.3 | |
| Green | Hannah Lester | 1,158 | 2.1 | −2.1 | |
| Majority | 16,086 | 28.9 | −4.2 | ||
| Turnout | 55,668 | 69.6 | +1.9 | ||
| Conservative hold | Swing | −2.4 | |||
| Party | Candidate | Votes | % | ± | |
|---|---|---|---|---|---|
| Conservative | George Freeman[7] | 27,206 | 52.1 | +2.6 | |
| UKIP | Anna Coke[8] | 9,930 | 19.0 | +13.5 | |
| Labour | Harry Clarke | 9,585 | 18.4 | +0.4 | |
| Liberal Democrat | Paul Speed[9] | 3,300 | 6.3 | −15.9 | |
| Green | Simeon Jackson[10] | 2,191 | 4.2 | +1.3 | |
| Majority | 17,276 | 33.1 | +5.8 | ||
| Turnout | 52,212 | 67.8 | −0.6 | ||
| Conservative hold | Swing | -5.5 | |||
| Party | Candidate | Votes | % | ± | |
|---|---|---|---|---|---|
| Conservative | George Freeman | 25,123 | 49.5 | +2.9 | |
| Liberal Democrat | David Newman | 11,267 | 22.2 | +3.0 | |
| Labour | Elizabeth Hughes | 8,857 | 17.4 | −12.8 | |
| UKIP | Richard Toby Coke | 2,800 | 5.5 | +1.5 | |
| Green | Tim Birt | 1,457 | 2.9 | +2.9 | |
| BNP | Christene Kelly[12] | 1,261 | 2.5 | +2.5 | |
| Majority | 13,856 | 27.3 | |||
| Turnout | 50,765 | 68.4 | +2.8 | ||
| Conservative hold | Swing | −0.1 | |||
Elections in the 2000s
| Party | Candidate | Votes | % | ± | |
|---|---|---|---|---|---|
| Conservative | Keith Simpson | 23,564 | 43.1 | −1.7 | |
| Labour | Daniel Zeichner | 16,004 | 29.2 | −6.9 | |
| Liberal Democrat | Vivienne Clifford-Jackson | 12,988 | 23.7 | +9.2 | |
| UKIP | Simon Fletcher | 2,178 | 4.0 | +1.5 | |
| Majority | 7,560 | 13.8 | |||
| Turnout | 54,734 | 67.0 | −1.1 | ||
| Conservative hold | Swing | +2.6 | |||
| Party | Candidate | Votes | % | ± | |
|---|---|---|---|---|---|
| Conservative | Keith Simpson | 23,519 | 44.8 | +5.2 | |
| Labour | Daniel Zeichner | 18,957 | 36.1 | −1.2 | |
| Liberal Democrat | Vivienne Clifford-Jackson | 7,621 | 14.5 | −0.5 | |
| UKIP | Stuart Agnew | 1,333 | 2.5 | N/A | |
| Green | Peter Reeve | 1,118 | 2.1 | −0.1 | |
| Majority | 4,562 | 8.7 | |||
| Turnout | 52,548 | 68.1 | −8.2 | ||
| Conservative hold | Swing | 3.2 | |||
Elections in the 1990s
| Party | Candidate | Votes | % | ± | |
|---|---|---|---|---|---|
| Conservative | Keith Simpson | 22,739 | 39.6 | −14.7 | |
| Labour | Daniel Zeichner | 21,403 | 37.3 | +11.9 | |
| Liberal Democrat | Susan Frary | 8,617 | 15.0 | −4.9 | |
| Referendum | Nigel Holder | 3,229 | 5.6 | N/A | |
| Green | Tony Park | 1,254 | 2.1 | N/A | |
| Natural Law | Bruce Parker | 215 | 0.4 | N/A | |
| Majority | 1,336 | 2.3 | −26.6 | ||
| Turnout | 57,457 | 76.3 | −5.2 | ||
| Conservative hold | Swing | −13.3 | |||
| Party | Candidate | Votes | % | ± | |
|---|---|---|---|---|---|
| Conservative | Richard Ryder | 35,620 | 54.3 | −2.4 | |
| Labour | Michael Castle | 16,672 | 25.4 | +7.6 | |
| Liberal Democrat | Michael Gleed | 13,072 | 19.9 | −5.6 | |
| Natural Law | Coral Waite | 226 | 0.3 | N/A | |
| Majority | 18,948 | 28.9 | −2.3 | ||
| Turnout | 65,590 | 81.5 | +3.3 | ||
| Conservative hold | Swing | −5.0 | |||
Elections in the 1980s
| Party | Candidate | Votes | % | ± | |
|---|---|---|---|---|---|
| Conservative | Richard Ryder | 32,758 | 56.7 | +0.8 | |
| Social Democratic | Gavin Graham | 14,750 | 25.5 | −0.5 | |
| Labour | Keith Luckey | 10,272 | 17.8 | +0.6 | |
| Majority | 18,008 | 31.2 | |||
| Turnout | 78.2 | ||||
| Conservative hold | Swing | ||||
| Party | Candidate | Votes | % | ± | |
|---|---|---|---|---|---|
| Conservative | Richard Ryder | 29,032 | 55.9 | N/A | |
| Social Democratic | David Cargill | 13,517 | 26.0 | N/A | |
| Labour | Leslie Potter | 8,950 | 17.2 | N/A | |
| Independent | Mona McNee | 405 | 0.8 | N/A | |
| Majority | 15,515 | 29.9 | N/A | ||
| Turnout | 75.3 | N/A | |||
| Conservative win (new seat) | |||||
Elections in the 1910s
| Party | Candidate | Votes | % | ± | |
|---|---|---|---|---|---|
| Unionist | Neville Jodrell | Unopposed | |||
| Unionist hold | |||||
General Election 1914/15:
Another General Election was required to take place before the end of 1915. The political parties had been making preparations for an election to take place and by the July 1914, the following candidates had been selected;
- Unionist: William Lewis Boyle
- Liberal: David Waterlow
| Party | Candidate | Votes | % | ± | |
|---|---|---|---|---|---|
| Liberal Unionist | William Lewis Boyle | 4,345 | 50.2 | −2.4 | |
| Liberal | William Richard Lester | 4,308 | 49.8 | +2.4 | |
| Majority | 37 | 0.4 | −4.8 | ||
| Turnout | 8,653 | 86.7 | −3.3 | ||
| Registered electors | 9,984 | ||||
| Liberal Unionist hold | Swing | −2.4 | |||

| Party | Candidate | Votes | % | ± | |
|---|---|---|---|---|---|
| Liberal Unionist | William Lewis Boyle | 4,724 | 52.6 | +2.8 | |
| Liberal | William Richard Lester | 4,265 | 47.4 | −2.8 | |
| Majority | 459 | 5.2 | N/A | ||
| Turnout | 8,989 | 90.0 | +1.8 | ||
| Registered electors | 9,984 | ||||
| Liberal Unionist gain from Liberal | Swing | +2.8 | |||
Elections in the 1900s
| Party | Candidate | Votes | % | ± | |
|---|---|---|---|---|---|
| Liberal | John Wodehouse | 4,197 | 50.2 | −3.7 | |
| Liberal Unionist | William Lewis Boyle | 4,170 | 49.8 | +3.7 | |
| Majority | 27 | 0.4 | −7.4 | ||
| Turnout | 8,367 | 88.2 | +7.8 | ||
| Registered electors | 9,490 | ||||
| Liberal hold | Swing | −3.7 | |||
| Party | Candidate | Votes | % | ± | |
|---|---|---|---|---|---|
| Liberal | Frederick William Wilson | 3,996 | 53.9 | +3.1 | |
| Liberal Unionist | William Lewis Boyle | 3,422 | 46.1 | −3.1 | |
| Majority | 574 | 7.8 | +6.2 | ||
| Turnout | 7,418 | 80.4 | −6.9 | ||
| Registered electors | 9,226 | ||||
| Liberal hold | Swing | +3.1 | |||
Elections in the 1890s

| Party | Candidate | Votes | % | ± | |
|---|---|---|---|---|---|
| Liberal | Frederick William Wilson | 4,220 | 50.8 | −2.3 | |
| Liberal Unionist | Robert Gurdon | 4,086 | 49.2 | +2.3 | |
| Majority | 134 | 1.6 | −4.6 | ||
| Turnout | 8,306 | 87.3 | −1.9 | ||
| Registered electors | 9,509 | ||||
| Liberal hold | Swing | −2.3 | |||
| Party | Candidate | Votes | % | ± | |
|---|---|---|---|---|---|
| Liberal Unionist | Robert Gurdon | 4,112 | 51.3 | +4.4 | |
| Liberal | Frederick William Wilson | 3,904 | 48.7 | −4.4 | |
| Majority | 208 | 2.6 | N/A | ||
| Turnout | 8,016 | 84.3 | −4.9 | ||
| Registered electors | 9,509 | ||||
| Liberal Unionist gain from Liberal | Swing | +4.4 | |||
| Party | Candidate | Votes | % | ± | |
|---|---|---|---|---|---|
| Liberal | Clement Higgins | 4,069 | 53.1 | +6.7 | |
| Liberal Unionist | Robert Gurdon | 3,599 | 46.9 | −6.7 | |
| Majority | 470 | 6.2 | N/A | ||
| Turnout | 7,668 | 89.2 | +32.6 | ||
| Registered electors | 8,601 | ||||
| Liberal gain from Liberal Unionist | Swing | +6.7 | |||
Elections in the 1880s
| Party | Candidate | Votes | % | ± | |
|---|---|---|---|---|---|
| Liberal Unionist | Robert Gurdon | 3,032 | 53.6 | +18.3 | |
| Liberal | James Toller[24] | 2,625 | 46.4 | −18.3 | |
| Majority | 407 | 7.2 | N/A | ||
| Turnout | 5,657 | 56.6 | −24.9 | ||
| Registered electors | 9,992 | ||||
| Liberal Unionist gain from Liberal | Swing | +18.3 | |||
| Party | Candidate | Votes | % | ± | |
|---|---|---|---|---|---|
| Liberal | Robert Gurdon | 5,275 | 64.7 | N/A | |
| Conservative | Ailwyn Fellowes | 2,872 | 35.3 | N/A | |
| Majority | 2,403 | 29.4 | N/A | ||
| Turnout | 8,147 | 81.5 | N/A | ||
| Registered electors | 9,992 | ||||
| Liberal win (new seat) | |||||
See also
Notes and references
- Notes
- ↑ A county constituency (for the purposes of election expenses and type of returning officer)
- ↑ As with all constituencies, the constituency elects one Member of Parliament (MP) by the first past the post system of election at least every five years.
- References
- ↑ "Electorate Figures - Boundary Commission for England". 2011 Electorate Figures. Boundary Commission for England. 4 March 2011. Archived from the original on 6 November 2010. Retrieved 13 March 2011.
- ↑ "'Norfolk Mid', June 1983 up to May 1997". ElectionWeb Project. Cognitive Computing Limited. Archived from the original on 14 March 2016. Retrieved 13 March 2016.
- ↑ http://conservativehome.blogs.com/goldlist/2006/07/broadland_selec.html
- 1 2 Leigh Rayment's Historical List of MPs – Constituencies beginning with "N" (part 2)
- ↑ "Election Data 2017". BBC. Retrieved 14 June 2017.
- ↑ "Election Data 2015". Electoral Calculus. Archived from the original on 17 October 2015. Retrieved 17 October 2015.
- ↑ http://electionresults.blogspot.co.uk/2013/05/norfolk-mid-2015.html
- ↑ "Why Anna?". Mid Norfolk UKIP. Archived from the original on 1 February 2015. Retrieved 1 February 2015.
- ↑ http://www.libdems.org.uk/general_election_candidates#East of England
- ↑ "Member of Parliament for Mid Norfolk". YourNextMP. Archived from the original on 1 February 2015. Retrieved 1 February 2015.
- ↑ "Election Data 2010". Electoral Calculus. Archived from the original on 26 July 2013. Retrieved 17 October 2015.
- ↑ "Archived copy". Archived from the original on 2010-04-14. Retrieved 2010-03-11.
- ↑ "Election Data 2005". Electoral Calculus. Archived from the original on 15 October 2011. Retrieved 18 October 2015.
- ↑ "Election Data 2001". Electoral Calculus. Archived from the original on 15 October 2011. Retrieved 18 October 2015.
- ↑ "Election Data 1997". Electoral Calculus. Archived from the original on 15 October 2011. Retrieved 18 October 2015.
- ↑ "Election Data 1992". Electoral Calculus. Archived from the original on 15 October 2011. Retrieved 18 October 2015.
- ↑ "Politics Resources". Election 1992. Politics Resources. 9 April 1992. Retrieved 2010-12-06.
- ↑ "Election Data 1987". Electoral Calculus. Archived from the original on 15 October 2011. Retrieved 18 October 2015.
- ↑ "Election Data 1983". Electoral Calculus. Archived from the original on 15 October 2011. Retrieved 18 October 2015.
- 1 2 3 4 5 6 7 8 9 10 Craig, FWS, ed. (1974). British Parliamentary Election Results: 1885-1918. London: Macmillan Press. ISBN 9781349022984.
- 1 2 Debrett's House of Commons & Judicial Bench, 1916
- 1 2 3 4 5 6 7 The Liberal Year Book, 1907
- 1 2 Debrett's House of Commons & Judicial Bench, 1901
- ↑ "Mid Division of Norfolk". Norwich Mercury. 25 August 1886. p. 1. Retrieved 5 December 2017 – via British Newspaper Archive. (Subscription required (help)).
- ↑ Debrett's House of Commons & Judicial Bench, 1886