Brighton Kemptown (UK Parliament constituency)
Coordinates: 50°49′26″N 0°02′06″W / 50.824°N 0.035°W
| Brighton, Kemptown | |
|---|---|
|
Borough constituency for the House of Commons | |
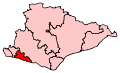 Boundary of Brighton, Kemptown in East Sussex. | |
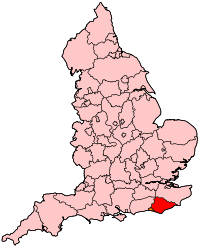 Location of East Sussex within England. | |
| County | East Sussex |
| Population | 91,567 (2011 census)[1] |
| Electorate | 66,557 (December 2010)[2] |
| Current constituency | |
| Created | 1950 |
| Member of parliament | Lloyd Russell-Moyle (Labour) |
| Number of members | One |
| Created from | Brighton |
| Overlaps | |
| European Parliament constituency | South East England |
Brighton Kemptown is a constituency created in 1950[n 1] in the House of Commons of the UK Parliament covering the eastern portion of the city of Brighton and Hove including Kemptown and part of the Lewes District.[n 2]
Since 2017, the constituency has been represented by Lloyd Russell-Moyle of the Labour Party. Save for two elections in 1974 when the seat leant to the right bucking the national result, the affiliation of the winning candidate was that of the winning party nationally for the years 1951 to 2015 – a bellwether. Brighton Kemptown is one of two seats won (held or gained) by a Labour candidate in 2017 from a total of eight covering its county. Russell-Moyle's 2017 win was one of 30 net gains of the Labour Party.
Boundaries
1950-1983: The County Borough of Brighton wards of Elm Grove, Hanover, King's Cliff, Lewes Road, Moulsecoomb, Pier, Queen's Park, Rottingdean, and St John's.
1983-1997: The Borough of Brighton wards of Hanover, King's Cliff, Marine, Moulsecoomb, Queen's Park, Rottingdean, Tenantry, and Woodingdean.
1997-2010: The Borough of Brighton wards of King's Cliff, Marine, Moulsecoomb, Queen's Park, Rottingdean, Tenantry, and Woodingdean, and the District of Lewes wards of East Saltdean, Peacehaven East, Peacehaven North, Peacehaven West, and Telscombe Cliffs.
2010-present: The City of Brighton and Hove wards of East Brighton, Moulsecoomb and Bevendean, Queen's Park, Rottingdean Coastal, and Woodingdean, and the District of Lewes wards of East Saltdean and Telscombe Cliffs, Peacehaven East, Peacehaven North, and Peacehaven West.
Constituency profile
The constituency takes in the eastern part of Brighton and semi-rural suburbs and villages stretching out to the east. From west to east it includes Queen's Park; Kemptown, the centre of Brighton's vibrant gay community; the council estates of Whitehawk and Moulsecoomb; and beyond the racecourse affluent and genteel coastal villages like Woodingdean, Saltdean and the town of Peacehaven.
History
- History of boundaries
This constituency was created in 1950 when the two-member constituency of Brighton was split into three single-member seats.
Boundary changes for the 1997 general election moved Peacehaven, a semi-rural area, into the constituency. This added a ward where the Conservatives had been favoured, but Labour gained the seat at its landslide victory. Des Turner held it until 2010, when Simon Kirby of the Conservative Party won it.
- History of results
For a total of 48 years since the seat's creation, it has been Conservative-controlled (1950–1964; 1970–1997; 2010–2017). The only other party to hold the seat since its creation has been the Labour Party.
Labour first won Kemptown in 1964, with a narrow majority of just seven votes[n 3]. Dennis Hobden, the first Labour MP to ever be elected in Sussex, increased his majority in 1966, but lost the seat in 1970, and another Labour MP was not returned until 1997. The seat was a national bellwether constituency from 1979-2015, but in 2017 elected a Labour MP when the country as a whole returned a hung parliament with the Conservatives being the largest party by a margin of 56 MPs.
Liberal Democrats and their two predecessor parties following national trends formed the third-largest party in the constituency, 1950–2010 inclusive. The 2010 general election result for the party can be seen as 0.6% behind "its" highest, at 18.6%, if including its SDP forerunner. The Liberal Democrat vote share collapsed to 3% in 2015 (behind UKIP and Green Party candidates) and remained at the 3% level in 2017 despite the absence of UKIP and Green candidates for the seat at that election.
The Green Party candidate finished in fourth place at the 2005, 2010 and 2015 elections, retaining their deposit each time, with vote shares ranging from 5.5% to 7.0%. The Greens did not field a candidate in 2017[3] in a tactical effort to assist the Labour Party unseat the sitting Conservative MP, Simon Kirby, who had held the seat for Conservatives in 2015 on a reduced majority; this worked, as Labour's Lloyd Russell-Moyle won the seat with a majority of 9,868 votes (20.0%), the largest Labour has ever held in Brighton Kemptown.
The 2015 general election result had made the seat the tenth-most marginal majority of the Conservative Party's 331 seats by percentage of majority.[4]
Members of Parliament
Elections
Elections in the 2010s
| Party | Candidate | Votes | % | ± | |
|---|---|---|---|---|---|
| Labour | Lloyd Russell-Moyle | 28,703 | 58.3 | +19.2 | |
| Conservative | Simon Kirby[7] | 18,835 | 38.3 | -2.4 | |
| Liberal Democrat | Emily Tester[8] | 1,457 | 3.0 | ±0.0 | |
| Independent | Doktor Haze [9] | 212 | 0.4 | +0.4 | |
| Majority | 9,868 | 20.0 | N/A | ||
| Turnout | 49,207 | 72.5 | +5.7 | ||
| Labour gain from Conservative | Swing | +10.8 | |||
| Party | Candidate | Votes | % | ± | |
|---|---|---|---|---|---|
| Conservative | Simon Kirby [12] | 18,428 | 40.7 | +2.7 | |
| Labour | Nancy Platts[12] | 17,738 | 39.2 | +4.3 | |
| UKIP | Ian Buchanan[13] | 4,446 | 9.8 | +6.6 | |
| Green | Davy Jones [12] | 3,187 | 7.0 | +1.6 | |
| Liberal Democrat | Paul Chandler[14] | 1,365 | 3.0 | −15.0 | |
| Socialist (GB) | Jacqueline Shodeke [15] | 73 | 0.2 | N/A | |
| Independent | Matthew Taylor [16] | 69 | 0.2 | N/A | |
| Majority | 690 | 1.5 | −1.6 | ||
| Turnout | 45,306 | 66.8 | +2.1 | ||
| Conservative hold | Swing | -0.8 | |||
| Party | Candidate | Votes | % | ± | |
|---|---|---|---|---|---|
| Conservative | Simon Kirby | 16,217 | 38.0 | +5.0 | |
| Labour Co-op | Simon Burgess | 14,889 | 34.9 | −5.0 | |
| Liberal Democrat | Juliet Williams | 7,691 | 18.0 | +1.5 | |
| Green | Ben Duncan | 2,330 | 5.5 | −1.5 | |
| UKIP | James Chamberlain-Webber | 1,384 | 3.2 | +1.3 | |
| TUSC | Dave Hill | 194 | 0.5 | ||
| Majority | 1,328 | 3.1 | |||
| Turnout | 42,705 | 64.7 | +4.5 | ||
| Conservative gain from Labour | Swing | +5.0 | |||
Elections in the 2000s
| Party | Candidate | Votes | % | ± | |
|---|---|---|---|---|---|
| Labour | Des Turner | 15,858 | 39.9 | −7.9 | |
| Conservative | Judith Symes | 13,121 | 33.0 | −2.3 | |
| Liberal Democrat | Marina Pepper | 6,560 | 16.5 | +6.1 | |
| Green | Simon Williams | 2,800 | 7.0 | +3.7 | |
| UKIP | James Chamberlain-Webber | 758 | 1.9 | +0.5 | |
| Peace | Caroline O'Reilly | 172 | 0.4 | +0.4 | |
| Socialist Labour | John McLeod | 163 | 0.4 | −0.5 | |
| Independent | Elaine Cooke | 127 | 0.3 | +0.3 | |
| Socialist Alternative | Phil Clarke | 113 | 0.3 | +0.3 | |
| Independent | Gene Dobbs | 47 | 0.1 | +0.1 | |
| Majority | 2,737 | 6.9 | |||
| Turnout | 39,719 | 60.2 | 2.6 | ||
| Labour hold | Swing | −2.8 | |||
| Party | Candidate | Votes | % | ± | |
|---|---|---|---|---|---|
| Labour | Des Turner | 18,745 | 47.8 | +1.3 | |
| Conservative | Geoffrey Theobald | 13,823 | 35.3 | −3.6 | |
| Liberal Democrat | Janet Marshall | 4,064 | 10.4 | +0.7 | |
| Green | Barney Miller | 1,290 | 3.3 | N/A | |
| UKIP | James Chamberlain-Webber | 543 | 1.4 | N/A | |
| Socialist Labour | John McLeod | 364 | 0.9 | +0.2 | |
| Free Party | Dave Dobbs | 227 | 0.6 | N/A | |
| ProLife Alliance | Elaine Cooke | 147 | 0.4 | N/A | |
| Majority | 4,922 | 12.6 | |||
| Turnout | 39,203 | 57.6 | −13.0 | ||
| Labour hold | Swing | ||||
Elections in the 1990s
| Party | Candidate | Votes | % | ± | |
|---|---|---|---|---|---|
| Labour | Des Turner | 21,479 | 46.6 | +14.0 | |
| Conservative | Andrew Bowden | 17,945 | 38.9 | −13.9 | |
| Liberal Democrat | Clive Gray | 4,478 | 9.7 | −4.2 | |
| Referendum | David Inman | 1,526 | 3.3 | N/A | |
| Socialist Labour | Hannah Williams | 316 | 0.7 | N/A | |
| Natural Law | Jeremy Bowler | 172 | 0.4 | −0.1 | |
| Monster Raving Loony | Lorrie Newman | 123 | 0.3 | N/A | |
| Rainbow Dream Ticket | Richard Darlow | 93 | 0.2 | N/A | |
| Majority | 3,534 | 7.7 | |||
| Turnout | 46,132 | 70.6 | |||
| Labour gain from Conservative | Swing | 14.0 | |||
| Party | Candidate | Votes | % | ± | |
|---|---|---|---|---|---|
| Conservative | Andrew Bowden | 21,129 | 48.1 | −5.4 | |
| Labour | Gill O. Haynes | 18,073 | 41.2 | +8.3 | |
| Liberal Democrat | Paul D. Scott | 4,461 | 10.2 | −3.4 | |
| Natural Law | Elizabeth J. Overall | 230 | 0.5 | N/A | |
| Majority | 3,056 | 7.0 | −13.7 | ||
| Turnout | 43,893 | 76.1 | +1.7 | ||
| Conservative hold | Swing | −6.8 | |||
Elections in the 1980s
| Party | Candidate | Votes | % | ± | |
|---|---|---|---|---|---|
| Conservative | Andrew Bowden | 24,031 | 53.5 | ||
| Labour | Steve Bassam | 14,771 | 32.9 | ||
| Liberal | Chris Berry | 6,080 | 13.6 | ||
| Majority | 9,260 | 20.6 | |||
| Turnout | 44,882 | 74.5 | |||
| Conservative hold | Swing | ||||
| Party | Candidate | Votes | % | ± | |
|---|---|---|---|---|---|
| Conservative | Andrew Bowden | 22,265 | 51.1 | ||
| Labour | R. Fitch | 12,887 | 29.6 | ||
| Social Democratic | D. T. Burke | 8,098 | 18.6 | ||
| National Front | Ted Budden | 290 | 0.7 | ||
| Majority | 9,378 | 21.5 | |||
| Turnout | 43,540 | 71.5 | |||
| Conservative hold | Swing | ||||
Elections in the 1970s
| Party | Candidate | Votes | % | ± | |
|---|---|---|---|---|---|
| Conservative | Andrew Bowden | 25,512 | 53.6 | ||
| Labour | Quintin Barry | 17,504 | 36.8 | ||
| Liberal | S. Osbourne | 8,098 | 8.8 | ||
| National Front | Valerie Tyndall | 404 | 0.8 | ||
| Majority | 8,008 | 16.8 | |||
| Turnout | 47,599 | 74.2 | |||
| Conservative hold | Swing | ||||
| Party | Candidate | Votes | % | ± | |
|---|---|---|---|---|---|
| Conservative | Andrew Bowden | 21,725 | 45.9 | ||
| Labour | Dennis Hobden | 19,060 | 40.3 | ||
| Liberal | S. Osbourne | 6,214 | 13.1 | ||
| English National | Harvey Holford | 155 | 0.3 | ||
| Marxist-Leninist (England) | J. Buckle | 125 | 0.3 | ||
| Independent | Brian Ralfe | 47 | 0.1 | ||
| Majority | 2,665 | 5.6 | |||
| Turnout | 47,326 | 72.3 | |||
| Conservative hold | Swing | ||||
| Party | Candidate | Votes | % | ± | |
|---|---|---|---|---|---|
| Conservative | Andrew Bowden | 23,504 | 46.0 | ||
| Labour | Dennis Hobden | 19,484 | 38.1 | ||
| Liberal | D. Hall | 7,954 | 15.6 | ||
| Marxist-Leninist (England) | J. Buckle | 170 | 0.3 | ||
| Majority | 4,020 | 7.9 | |||
| Turnout | 51,112 | 78.8 | |||
| Conservative hold | Swing | ||||
| Party | Candidate | Votes | % | ± | |
|---|---|---|---|---|---|
| Conservative | Andrew Bowden | 24,208 | 49.3 | ||
| Labour | Dennis Hobden | 21,105 | 42.9 | ||
| Liberal | Oliver Moxon | 3,833 | 7.8 | ||
| Majority | 3,103 | 6.3 | |||
| Turnout | 49,146 | 75.0 | |||
| Conservative gain from Labour | Swing | ||||
Elections in the 1960s
| Party | Candidate | Votes | % | ± | |
|---|---|---|---|---|---|
| Labour | Dennis Hobden | 24,936 | 50.8 | ||
| Conservative | Andrew Bowden | 24,105 | 49.2 | ||
| Majority | 831 | 1.7 | |||
| Turnout | 49,041 | 80.1 | |||
| Labour hold | Swing | ||||
| Party | Candidate | Votes | % | ± | |
|---|---|---|---|---|---|
| Labour | Dennis Hobden | 22,308 | 50.0 | ||
| Conservative | David James | 22,301 | 50.0 | ||
| Majority | 7 | 0.0 | |||
| Turnout | 44,609 | 72.2 | 6 recounts | ||
| Labour gain from Conservative | Swing | ||||
Elections in the 1950s
| Party | Candidate | Votes | % | ± | |
|---|---|---|---|---|---|
| Conservative | David James | 25,411 | 56.4 | ||
| Labour | Lewis Cohen | 19,665 | 43.6 | ||
| Majority | 5,746 | 12.8 | |||
| Turnout | 45,076 | 73.8 | |||
| Conservative hold | Swing | ||||
| Party | Candidate | Votes | % | ± | |
|---|---|---|---|---|---|
| Conservative | Howard Johnson | 23,142 | 56.4 | ||
| Labour | Lewis Cohen | 17,885 | 43.6 | ||
| Majority | 5,257 | 12.8 | |||
| Turnout | 41,027 | 70.0 | |||
| Conservative hold | Swing | ||||
| Party | Candidate | Votes | % | ± | |
|---|---|---|---|---|---|
| Conservative | Howard Johnson | 25,923 | 55.6 | ||
| Labour | Lewis Cohen | 20,726 | 44.4 | ||
| Majority | 5,197 | 11.1 | |||
| Turnout | 46,649 | 77.1 | |||
| Conservative hold | Swing | ||||
| Party | Candidate | Votes | % | ± | |
|---|---|---|---|---|---|
| Conservative | Howard Johnson | 22,431 | 48.8 | N/A | |
| Labour | J. T. Huddart | 19,430 | 42.3 | N/A | |
| Liberal | Robert Michael Buckley | 4,073 | 8.9 | N/A | |
| Majority | 3,001 | 6.5 | N/A | ||
| Turnout | 78.0 | N/A | |||
| Conservative hold | Swing | N/A | |||
See also
Notes
- ↑ A borough constituency (for the purposes of election expenses and type of returning officer)
- ↑ As with all constituencies, the constituency elects one Member of Parliament (MP) by the first past the post system of election at least every five years.
- ↑ The majority of seven made Brighton Kemptown the most marginal seat in the country in 1964
References
- ↑ "Brighton, Kemptown: Usual Resident Population, 2011". Neighbourhood Statistics. Office for National Statistics. Retrieved 3 February 2015.
- ↑ "Electorate Figures – Boundary Commission for England". 2011 Electorate Figures. Boundary Commission for England. 4 March 2011. Archived from the original on 6 November 2010. Retrieved 13 March 2011.
- ↑ "Greens pull out of General Election contest in Brighton Kemptown". Brighton & Hove News. 27 April 2017. Retrieved 11 June 2017.
- ↑ List of Conservative MPs elected in 2015 by % majority UK Political.info. Retrieved 2017-01-29
- ↑ "Brighton Kemptown 1950-". Hansard 1803-2005. UK Parliament. Retrieved 2 February 2015.
- ↑ Leigh Rayment's Historical List of MPs – Constituencies beginning with "K" (part 1)
- ↑ "MPs fire the election starting gun – and the contest begins in Brighton and Hove". 20 April 2017.
- ↑ "Lib Dems confirm candidates in Hove and Brighton Kemptown and consult members on whether to stand aside in Brighton Pavilion". 24 April 2017.
- ↑ "General election latest – 14 candidates stand for the three seats in Brighton and Hove". Brighton and Hove News.
- ↑ "Election Data 2015". Electoral Calculus. Archived from the original on 17 October 2015. Retrieved 17 October 2015.
- ↑ "Election results for Brighton Kemptown". city council web site. Brighton & Hove Council. Retrieved 8 May 2015.
- 1 2 3 "UK ELECTION RESULTS". electionresults.blogspot.co.uk.
- ↑ "Ian Buchanan". YourNextMP. Retrieved 22 January 2015.
- ↑ http://www.libdems.org.uk/general_election_candidates#South East
- ↑ "General Election - Campaign News". worldsocialism.org.
- ↑ "Matt Taylor for Brighton Kemptown 2015". Matt Taylor for Brighton Kemptown 2015.
- ↑ "Election Data 2010". Electoral Calculus. Archived from the original on 26 July 2013. Retrieved 17 October 2015.
- ↑ "Election Data 2005". Electoral Calculus. Archived from the original on 15 October 2011. Retrieved 18 October 2015.
- ↑ "Election Data 2001". Electoral Calculus. Archived from the original on 15 October 2011. Retrieved 18 October 2015.
- ↑ "Election Data 1997". Electoral Calculus. Archived from the original on 15 October 2011. Retrieved 18 October 2015.
- ↑ "Election Data 1992". Electoral Calculus. Archived from the original on 15 October 2011. Retrieved 18 October 2015.
- ↑ "Politics Resources". Election 1992. Politics Resources. 9 April 1992. Retrieved 6 December 2010.
- ↑ "Election Data 1987". Electoral Calculus. Archived from the original on 15 October 2011. Retrieved 18 October 2015.
- ↑ "Election Data 1983". Electoral Calculus. Archived from the original on 15 October 2011. Retrieved 18 October 2015.
- Sources
- Election result, 2005 (BBC)
- Election results, 1997 – 2001 (BBC)
- Election results, 1997 – 2001 (Election Demon)
- Election results, 1983 – 1992 (Election Demon)
- Election results, 1992 – 2005 (Guardian)
- Election results, 1951 – 2001 (Keele University)
External links
- nomis Constituency Profile for Brighton, Kemptown — presenting data from the ONS annual population survey and other official statistics.
City of Brighton and Hove | |||||||||||||
|---|---|---|---|---|---|---|---|---|---|---|---|---|---|
| Topics | |||||||||||||
| Events | |||||||||||||
| Culture | |||||||||||||
| Politics | |||||||||||||
| Transport |
| ||||||||||||
| Media | |||||||||||||
| Sport |
| ||||||||||||
| Buildings and architects | |||||||||||||
| Parks | |||||||||||||
| Areas |
| ||||||||||||
| |||||||||||||