Sheffield Central (UK Parliament constituency)
| Sheffield Central | |
|---|---|
|
Borough constituency for the House of Commons | |
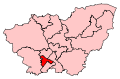 Boundary of Sheffield Central in South Yorkshire. | |
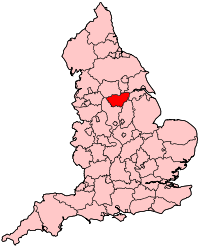 Location of South Yorkshire within England. | |
| County | South Yorkshire |
| Electorate | 69,975 (December 2010) |
| Current constituency | |
| Created | 1983 |
| Member of parliament | Paul Blomfield (Labour) |
| Number of members | One |
| Created from | Sheffield Park, Sheffield Hillsborough, Sheffield Hallam and Sheffield Attercliffe[1] |
| 1885–1950 | |
| Number of members | One |
| Replaced by | Sheffield Neepsend and Sheffield Hallam |
| Created from | Sheffield |
| Overlaps | |
| European Parliament constituency | Yorkshire and the Humber |
Sheffield Central is a constituency[n 1] represented in the House of Commons of the UK Parliament since 2010 by Paul Blomfield, a member of the Labour Party.[n 2]
Boundaries
- First creation
1885-1918: The Municipal Borough of Sheffield wards of St Peter's and St Philip's, and part of St George's ward.
1918-1950: The County Borough of Sheffield wards of St Peter's and St Philip's, and part of Broomhall ward.
1950-1983: See other seats.
- Second creation (current)
1983-1997: The City of Sheffield wards of Burngreave, Castle, Manor, Netherthorpe, and Sharrow.
1997-2010: as above plus Nether Edge
2010-2015: The City of Sheffield wards of Broomhill, Central, Manor Castle, Nether Edge, and Walkley.
2015-present: The City of Sheffield wards of Broomhill & Sharrow Vale, City, Manor Castle, Nether Edge & Sharrow, and Walkley; and parts of the wards of Crookes & Crosspool, Ecclesall, Fulwood and Hillsborough.
- Present boundaries
The seat covers central Sheffield and extends as far as Nether Edge and the Manor. It covers a similar area to the former Sheffield Park seat. It borders Sheffield Hallam, Sheffield Heeley, Sheffield Brightside and Hillsborough and Sheffield South East.
History
1885–1950
Created under the Redistribution of Seats Act 1885 for the election that year, Sheffield Central was one of five divisions of the former Sheffield constituency. Sheffield Central was abolished in 1950 and the sitting MP, Harry Morris, stood and won in the new seat (now extinct) of Sheffield Neepsend.
1983–present
- Revival
In varied form the constituency was brought back into existence for the 1983 general election.
- MPs
Labour's Richard Caborn represented Sheffield Central from its recreation in 1983 until he retired in 2010 and was narrowly succeeded at the ballot box by another Labour MP, Paul Blomfield.
- Winning margin
The 2015 result made the seat the 32nd-safest of Labour's 232 seats by percentage of majority.[2]
Labour majorities since 1983 in Sheffield Central have been in the top quartile save for 2010 — the Liberal Democrat share of the vote came 0.4% short of winning the seat — a highly marginal result.
- Opposition parties
The Green Party took second place in 2015, gaining a +12.1% swing (compared with +2.8% nationwide). This was the main target seat of the party in Yorkshire. Its 2012-2016 Leader Natalie Bennett, chose to settle locally on stepping down from the policy-steering role in 2016 and has chosen to contest Sheffield Central at the 2017 general election. Lib Dem candidates scored variable second places in 1997, 2001, 2005 and 2010 then took fourth place in 2015.
- Turnout
Turnout has ranged from 62.5% in 1987 to 49.5% in 2001.
Constituency profile
The constituency consists of Census Output Areas of a local government districts with: a working population whose income is close to the national average and lower than average reliance upon social housing.[3] At the end of 2012 the unemployment rate in the constituency stood as 4.0% of the population claiming jobseekers allowance, see table.[4]
| Office for National Statistics November 2012 | Jobseeker's Allowance claimant count |
|---|---|
| Sheffield, Brightside and Hillsborough | 7.6%[n 3] |
| Sheffield Central | 4.0% |
| Sheffield Hallam | 1.5% |
| Sheffield Heeley | 5.7% |
| Sheffield South East | 4.4% |
The district contributing to the bulk of the seat has a medium 33% of its population without a car.[n 4] A medium 24.3% of the City's population are without qualifications, a high 15.8% of the population with level 3 qualifications and a medium 25.7% with level 4 qualifications or above. In terms of tenure a relatively low 58.3% of homes are owned outright or on a mortgage by occupants as at the 2011 census across the district.[5]
Members of Parliament
| Year | Member[6] | Party | Subsequent roles | |
|---|---|---|---|---|
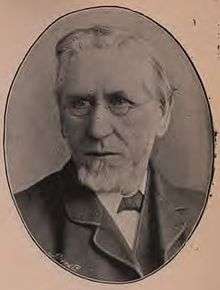
| 1885 | Howard Vincent | Conservative | ||
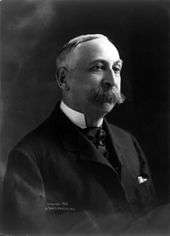
| 1908 | James Hope | Conservative | Lord Rankeillour | |
| 1929 | Philip Hoffman | Labour | ||
| 1931 | William Boulton | Conservative | ||
| 1945 | Harry Morris | Labour | Lord Morris | |
| 1950 | Constituency abolished | |||
| 1983 | Constituency created | |||
| 1983 | Richard Caborn | Labour | ||
| 2010 | Paul Blomfield | Labour | ||
Elections

Elections in the 2010s
| Party | Candidate | Votes | % | ± | |
|---|---|---|---|---|---|
| Labour | Paul Blomfield | 33,963 | 70.9 | +15.9 | |
| Conservative | Stephanie Roe | 6,215 | 13.0 | +1.8 | |
| Green | Natalie Bennett | 3,848 | 8.0 | -7.8 | |
| Liberal Democrat | Shaffaq Mohammed | 2,465 | 5.1 | -4.5 | |
| UKIP | Dominic Cook | 1,060 | 2.2 | -5.2 | |
| Yorkshire Party | Jack Carrington | 197 | 0.4 | N/A | |
| Pirate | Rob Moran | 91 | 0.2 | N/A | |
| SDP | Joe Westnidge | 38 | 0.1 | N/A | |
| Majority | 27,748 | 57.9 | +15.7 | ||
| Turnout | 47,877 | 62.0 | +4.6 | ||
| Labour hold | Swing | +7.0 | |||
| Party | Candidate | Votes | % | ± | |
|---|---|---|---|---|---|
| Labour | Paul Blomfield | 24,308 | 55.0 | +13.7 | |
| Green | Jillian Creasy | 6,999 | 15.8 | +12.1 | |
| Conservative | Stephanie Roe | 4,917 | 11.1 | +1.0 | |
| Liberal Democrat | Joe Otten | 4,278 | 9.7 | -31.2 | |
| UKIP | Dominic Cook | 3,296 | 7.5 | +5.9 | |
| Communist | Steve Andrew | 119 | 0.3 | +0.3 | |
| Pirate | Andy Halsall | 113 | 0.3 | N/A | |
| English Democrat | Elizabeth Breed | 68 | 0.2 | +0.2 | |
| Above and Beyond Party | Thom Brown | 42 | 0.1 | +0.1 | |
| Workers Revolutionary | Michael Driver | 33 | 0.1 | +0.1 | |
| Majority | 17,309 | 39.2 | +38.8 | ||
| Turnout | 44,173 | 57.4 | -2.2 | ||
| Labour hold | Swing | +0.8 | |||
| Party | Candidate | Votes | % | ± | |
|---|---|---|---|---|---|
| Labour | Paul Blomfield | 17,138 | 41.3 | -5.2 | |
| Liberal Democrat | Paul Scriven | 16,973 | 40.9 | +9.5 | |
| Conservative | Andrew Lee | 4,206 | 10.1 | +1.0 | |
| Green | Jillian Creasy | 1,556 | 3.8 | -2.0 | |
| BNP | Tracey Smith | 903 | 2.2 | +0.6 | |
| UKIP | Jeffrey Shaw | 652 | 1.6 | -0.1 | |
| Independent | Rod Rodgers | 40 | 0.1 | +0.1 | |
| Majority | 165 | 0.4 | -23.1 | ||
| Turnout | 41,468 | 59.6 | +4.6 | ||
| Labour hold | Swing | -7.4 | |||
Elections in the 2000s
| Party | Candidate | Votes | % | ± | |
|---|---|---|---|---|---|
| Labour | Richard Caborn | 14,950 | 49.9 | -11.5 | |
| Liberal Democrat | Ali Qadar | 7,895 | 26.3 | +6.6 | |
| Conservative | Samantha George | 3,094 | 10.3 | -0.6 | |
| Green | Bernard Little | 1,808 | 6.0 | +2.6 | |
| Respect | Maxine Bowler | 1,284 | 4.3 | N/A | |
| BNP | Mark Payne | 539 | 1.8 | N/A | |
| UKIP | Charlotte Arnott | 415 | 1.4 | +0.5 | |
| Majority | 7,055 | 23.5 | −18.2 | ||
| Turnout | 29,985 | 50.1 | +0.6 | ||
| Labour hold | Swing | -9.1 | |||
| Party | Candidate | Votes | % | ± | |
|---|---|---|---|---|---|
| Labour | Richard Caborn | 18,477 | 61.4 | -2.2 | |
| Liberal Democrat | Ali Qadar | 5,933 | 19.7 | +2.5 | |
| Conservative | Noelle Brelsford | 3,289 | 10.9 | -1.0 | |
| Green | Bernard Little | 1,008 | 3.4 | +0.7 | |
| Socialist Alliance | Nick Riley | 754 | 2.5 | N/A | |
| Socialist Labour | David Hadfield | 289 | 1.0 | N/A | |
| UKIP | Elizabeth Schofield | 257 | 0.9 | N/A | |
| Workers Revolutionary | Robert Driver | 62 | 0.2 | -0.0 | |
| Majority | 12,544 | 41.7 | −4.7 | ||
| Turnout | 30,069 | 49.5 | -3.6 | ||
| Labour hold | Swing | -2.36 | |||
Elections in the 1990s
| Party | Candidate | Votes | % | ± | |
|---|---|---|---|---|---|
| Labour | Richard Caborn | 23,179 | 63.6 | −5.1 | |
| Liberal Democrat | Ali Qadar | 6,273 | 17.2 | +5.6 | |
| Conservative | Martin Hess | 4,341 | 11.9 | −4.6 | |
| Green | Andy D'Agorne | 954 | 2.6 | +0.3 | |
| Referendum | Anthony Brownlow | 863 | 2.4 | N/A | |
| Socialist Alternative | Ken Douglas | 466 | 1.3 | N/A | |
| ProLife Alliance | Maureen Aitken | 280 | 0.8 | N/A | |
| Workers Revolutionary | Michael Driver | 63 | 0.2 | N/A | |
| Majority | 16,906 | 46.4 | −5.8 | ||
| Turnout | 36,419 | 53.0 | −3.1 | ||
| Labour hold | Swing | ||||
| Party | Candidate | Votes | % | ± | |
|---|---|---|---|---|---|
| Labour | Richard Caborn | 22,764 | 68.7 | +1.0 | |
| Conservative | Vernon Davies | 5,470 | 16.5 | −0.6 | |
| Liberal Democrat | Andrew Sangar | 3,856 | 11.6 | −2.3 | |
| Green | Graham Wroe | 750 | 2.3 | N/A | |
| End Unemployment Vote Justice for Jobless | Martin Clarke | 212 | 0.6 | N/A | |
| Communist League | Josephine O'Brien | 92 | 0.3 | N/A | |
| Majority | 17,294 | 52.2 | +1.5 | ||
| Turnout | 33,144 | 56.1 | −5.4 | ||
| Labour hold | Swing | ||||
Elections in the 1980s
| Party | Candidate | Votes | % | ± | |
|---|---|---|---|---|---|
| Labour | Richard Caborn | 25,872 | 67.7 | +7.5 | |
| Conservative | Brian Oxley | 6,530 | 17.1 | −2.1 | |
| Social Democratic | Fiona Hornby | 5,314 | 13.9 | −5.5 | |
| Red Front | C. T. Dingle | 278 | 0.7 | N/A | |
| Communist | Keith Petts | 203 | 0.5 | −0.2 | |
| Majority | 19,342 | 50.7 | +9.9 | ||
| Turnout | 38,197 | 62.5 | +0.9 | ||
| Labour hold | Swing | ||||
| Party | Candidate | Votes | % | ± | |
|---|---|---|---|---|---|
| Labour | Richard Caborn | 24,759 | 60.2 | N/A | |
| Social Democratic | Patricia Major | 7,969 | 19.4 | N/A | |
| Conservative | Patricia Rawlings | 7,908 | 19.2 | N/A | |
| Communist | Vi Gill | 296 | 0.7 | N/A | |
| Revolutionary Communist | C. Barrett | 222 | 0.5 | N/A | |
| Majority | 16,790 | 40.8 | N/A | ||
| Turnout | 41154 | 61.6 | N/A | ||
| Labour win (new seat) | |||||
Elections in the 1940s
| Party | Candidate | Votes | % | ± | |
|---|---|---|---|---|---|
| Labour | Harry Morris | 7,954 | 59.2 | +10.0 | |
| Conservative | George Vivian Hunt | 5,481 | 40.8 | −10.0 | |
| Majority | 2,473 | 18.4 | +16.8 | ||
| Turnout | 72.0 | -2.2 | |||
| Labour gain from Conservative | Swing | ||||
Elections in the 1930s
| Party | Candidate | Votes | % | ± | |
|---|---|---|---|---|---|
| Conservative | William Boulton | 13,821 | 50.8 | −11.2 | |
| Labour | Philip Hoffman | 13,408 | 49.2 | +11.2 | |
| Majority | 420 | 1.6 | -22.4 | ||
| Turnout | 74.2 | -6.0 | |||
| Conservative hold | Swing | ||||
| Party | Candidate | Votes | % | ± | |
|---|---|---|---|---|---|
| Conservative | William Boulton | 21,589 | 62.0 | ||
| Labour | Philip Hoffman | 13,212 | 38.0 | ||
| Majority | 8,377 | 24.0 | |||
| Turnout | 80.2 | ||||
| Conservative gain from Labour | Swing | ||||
Elections in the 1920s
| Party | Candidate | Votes | % | ± | |
|---|---|---|---|---|---|
| Labour | Philip Hoffman | 19,183 | 59.1 | +8.5 | |
| Unionist | John Ralph Patientins Warde-Aldam | 13,284 | 40.9 | -8.5 | |
| Majority | 5,899 | 18.2 | 17.0 | ||
| Turnout | 74.1 | -0.4 | |||
| Labour gain from Unionist | Swing | +8.5 | |||
| Party | Candidate | Votes | % | ± | |
|---|---|---|---|---|---|
| Conservative | James Hope | 13,302 | 50.6 | ||
| Labour | Tom Snowden | 12,995 | 49.4 | ||
| Majority | 307 | 1.2 | |||
| Turnout | 74.5 | ||||
| Conservative hold | Swing | ||||
| Party | Candidate | Votes | % | ± | |
|---|---|---|---|---|---|
| Unionist | James Hope | 9,727 | 45.7 | n/a | |
| Labour | Tom Snowden | 8,762 | 41.1 | n/a | |
| Liberal | John Henry Freeborough | 2,810 | 13.2 | n/a | |
| Majority | 965 | 4.6 | n/a | ||
| Turnout | 61.3 | n/a | |||
| Unionist hold | Swing | n/a | |||
In the 1922 general election, James Fitzalan Hope was elected unopposed.[23]
Elections in the 1910s
| Party | Candidate | Votes | % | ± | |
|---|---|---|---|---|---|
| C | Unionist | James Hope | 9,361 | 58.7 | +7.3 |
| National Amalgamated Union of Labour | Alfred James Bailey | 5,959 | 37.3 | −11.3 | |
| British Socialist Party | Robert George Murray | 643 | 4.0 | N/A | |
| Majority | 3,402 | 21.4 | +18.6 | ||
| Turnout | 15,963 | 43.1 | −34.4 | ||
| Unionist hold | Swing | +9.3 | |||
| C indicates candidate endorsed by the coalition government. | |||||
| Party | Candidate | Votes | % | ± | |
|---|---|---|---|---|---|
| Conservative | James Hope | 3,455 | 51.4 | −1.3 | |
| Lib-Lab | Alfred James Bailey | 3,271 | 48.6 | +1.3 | |
| Majority | 184 | 2.8 | −2.6 | ||
| Turnout | 6,726 | 77.5 | −6.2 | ||
| Registered electors | 8,684 | ||||
| Conservative hold | Swing | −1.3 | |||
| Party | Candidate | Votes | % | ± | |
|---|---|---|---|---|---|
| Conservative | James Hope | 3,829 | 52.7 | −3.5 | |
| Lib-Lab | Alfred James Bailey | 3,440 | 47.3 | +3.5 | |
| Majority | 389 | 5.4 | −7.0 | ||
| Turnout | 7,269 | 83.7 | +1.6 | ||
| Registered electors | 8,684 | ||||
| Conservative hold | Swing | −3.5 | |||
Elections in the 1900s
| Party | Candidate | Votes | % | ± | |
|---|---|---|---|---|---|
| Conservative | James Hope | Unopposed | |||
| Conservative hold | |||||
| Party | Candidate | Votes | % | ± | |
|---|---|---|---|---|---|
| Conservative | Howard Vincent | 4,217 | 56.2 | N/A | |
| Liberal | Stanley Udale | 3,290 | 43.8 | N/A | |
| Majority | 927 | 12.4 | N/A | ||
| Turnout | 7,507 | 82.1 | N/A | ||
| Registered electors | 9,142 | ||||
| Conservative hold | Swing | N/A | |||
| Party | Candidate | Votes | % | ± | |
|---|---|---|---|---|---|
| Conservative | Howard Vincent | Unopposed | |||
| Conservative hold | |||||
Elections in the 1890s
| Party | Candidate | Votes | % | ± | |
|---|---|---|---|---|---|
| Conservative | Howard Vincent | Unopposed | |||
| Conservative hold | |||||
| Party | Candidate | Votes | % | ± | |
|---|---|---|---|---|---|
| Conservative | Howard Vincent | 4,474 | 55.3 | −2.3 | |
| Liberal | Robert Cameron | 3,618 | 44.7 | +2.3 | |
| Majority | 856 | 10.6 | −4.6 | ||
| Turnout | 8,092 | 83.2 | +4.1 | ||
| Registered electors | 9,728 | ||||
| Conservative hold | Swing | −2.3 | |||
Elections in the 1880s
| Party | Candidate | Votes | % | ± | |
|---|---|---|---|---|---|
| Conservative | Howard Vincent | 4,522 | 57.6 | +1.5 | |
| Liberal | Joshua Hawkins | 3,326 | 42.4 | +0.2 | |
| Majority | 1,196 | 15.2 | +1.3 | ||
| Turnout | 7,848 | 79.1 | −4.1 | ||
| Registered electors | 9,923 | ||||
| Conservative hold | Swing | +0.7 | |||

| Party | Candidate | Votes | % | ± | |
|---|---|---|---|---|---|
| Conservative | Howard Vincent | 4,633 | 56.1 | N/A | |
| Lib-Lab | Samuel Plimsoll | 3,484 | 42.2 | N/A | |
| Independent Liberal | Mervyn Lanark Hawkes[27] | 140 | 1.7 | N/A | |
| Majority | 1,149 | 13.9 | N/A | ||
| Turnout | 8,257 | 83.2 | N/A | ||
| Registered electors | 9,923 | ||||
| Conservative win (new seat) | |||||
See also
Notes and references
- Notes
- ↑ A borough constituency (for the purposes of election expenses and type of returning officer)
- ↑ As with all constituencies, the constituency elects one Member of Parliament (MP) by the first past the post system of election at least every five years.
- ↑ This seat also saw the widest gender disparity with 10.5% of men were claimants, vs. 4.8% of women
- ↑ This falls within the centrally coloured banding for metropolitan areas
- References
- ↑ "'Sheffield Central', June 1983 up to May 1997". ElectionWeb Project. Cognitive Computing Limited. Retrieved 14 March 2016.
- ↑ List of Labour MPs elected in 2015 by % majority UK Political.info. Retrieved 2017-01-29
- ↑ 2001 Census
- 1 2 Unemployment claimants by constituency The Guardian
- ↑ 2011 census interactive maps Archived 2016-01-29 at the Wayback Machine.
- ↑ Leigh Rayment's Historical List of MPs – Constituencies beginning with "S" (part 3)
- ↑ "Sheffield Central". Sheffield City Council. Retrieved 12 May 2017.
- ↑ "Election Data 2015". Electoral Calculus. Archived from the original on 17 October 2015. Retrieved 17 October 2015.
- ↑ "Sheffield Central Parliamentary constituency". BBC News.
- ↑ "Election Data 2010". Electoral Calculus. Archived from the original on 26 July 2013. Retrieved 17 October 2015.
- ↑ "UK > England > Yorkshire & the Humber > Sheffield Central". Election 2010. BBC. 7 May 2010. Retrieved 11 May 2010.
- ↑ "Election Data 2005". Electoral Calculus. Archived from the original on 15 October 2011. Retrieved 18 October 2015.
- ↑ BBC Election 2005
- ↑ "Election Data 2001". Electoral Calculus. Archived from the original on 15 October 2011. Retrieved 18 October 2015.
- ↑ BBC Vote 2001
- ↑ "Election Data 1997". Electoral Calculus. Archived from the original on 15 October 2011. Retrieved 18 October 2015.
- 1 2 "Sheffield Central". The Guardian. Archived from the original on 2010-04-29.
- 1 2 3 4 5 Sheffield General Election Results 1945 - 2001, Sheffield City Council
- ↑ "Election Data 1992". Electoral Calculus. Archived from the original on 15 October 2011. Retrieved 18 October 2015.
- ↑ "Election Data 1987". Electoral Calculus. Archived from the original on 15 October 2011. Retrieved 18 October 2015.
- 1 2 Richard Kimber's Political Science Resources
- ↑ "Election Data 1983". Electoral Calculus. Archived from the original on 15 October 2011. Retrieved 18 October 2015.
- 1 2 3 4 5 6 7 8 Craig, F. W. S. (1983) [1969]. British parliamentary election results 1918-1949 (3rd ed.). Chichester: Parliamentary Research Services. ISBN 0-900178-06-X.
- 1 2 3 4 5 6 British Parliamentary Election Results 1885-1918, F. W. S. Craig
- 1 2 3 Craig, FWS, ed. (1974). British Parliamentary Election Results: 1885-1918. London: Macmillan Press. ISBN 9781349022984.
- ↑ Whittaker's Almanack (1910), p.159
- ↑ "Mr Mervyn Lanark Hawkes and the Sheffield Central Division". Sheffield Telegraph. 25 July 1885. p. 6. Retrieved 10 December 2017 – via British Newspaper Archive. (Subscription required (help)).