Chorley (UK Parliament constituency)
Coordinates: 53°39′11″N 2°37′55″W / 53.653°N 2.632°W
| Chorley | |
|---|---|
|
County constituency for the House of Commons | |
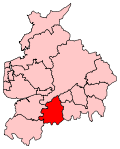 Boundary of Chorley in Lancashire. | |
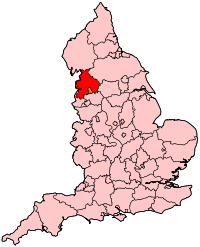 Location of Lancashire within England. | |
| County | Lancashire |
| Population | 94,932 (2011 census)[1] |
| Electorate | 71,333 (December 2010)[2] |
| Major settlements | Chorley |
| Current constituency | |
| Created | 1885 |
| Member of parliament | Sir Lindsay Hoyle (Labour) |
| Number of members | One |
| Created from | North Lancashire |
| Overlaps | |
| European Parliament constituency | North West England |
Chorley is a constituency[n 1] represented in the House of Commons of the UK Parliament since 1997 by Sir Lindsay Hoyle of the Labour Party.[n 2]
Boundaries
1885–1918: The Sessional Division of Leyland Hundred, and part of the Sessional Division of Leyland.
1918–1950: The Municipal Borough of Chorley, the Urban Districts of Adlington, Croston, Leyland, and Withnell, the Rural District of Chorley, and in the Rural District of Wigan the civil parishes of Haigh, Parbold, Worthington, and Wrightington.
1950–1983: The Municipal Borough of Chorley, the Urban Districts of Adlington and Leyland, and the Rural District of Chorley.
1983–1997: The Borough of Chorley, and the District of West Lancashire wards of Parbold and Wrightington.
1997–2010: The Borough of Chorley.
2010–present: The Borough of Chorley wards of Adlington and Anderton, Astley and Buckshaw, Brindle and Hoghton, Chisnall, Chorley East, Chorley North East, Chorley North West, Chorley South East, Chorley South West, Clayton-le-Woods and Whittle-le-Woods, Clayton-le-Woods North, Clayton-le-Woods West and Cuerden, Coppull, Euxton North, Euxton South, Heath Charnock and Rivington, Pennine, and Wheelton and Withnell.
Chorley constituency consists of the majority of the borough of Chorley. As well as the central market town of Chorley itself, the seat extends into southern Lancashire rural hinterland with three major villages and minor villages.
Chorley's expansion is assured with the building of Buckshaw Village, an urban development sprawling over the former Royal Ordnance Site east of Leyland in the seat.
Following their review of parliamentary representation in Lancashire leading up to the United Kingdom general election, 2010 the Boundary Commission for England created a new seat of Wyre and Preston North in the central part of the county, which caused "knock-on" effects elsewhere. Chorley constituency was one of the largest in electorate at the start of the review, which was a factor in the alterations to both its own composition and the changes to surrounding constituencies. These changes took away from the seat all the areas to the west of the M6 motorway, namely Croston, Eccleston, Bretherton and Mawdesley. These move to South Ribble.
History
Since the 1945 general election Chorley has proved to be a bellwether, changing hands between Labour and the Conservatives, however this pattern was broken in 2010. Chorley itself is Labour's strongest area in the seat, with the rural hinterland and smaller towns and villages more inclined to vote Conservative.
Members of Parliament
The Member of Parliament for the seat since 1997, Lindsay Hoyle of the Labour Party, is a Deputy Speaker of the House of Commons.[n 3]
| Election | Member[3][4] | Party | |
|---|---|---|---|
| 1885 | Joseph Feilden | Conservative | |
| 1895 by-election | David Lindsay, Lord Balniel | Conservative | |
| 1913 by-election | Sir Henry Hibbert | Conservative | |
| 1918 | Sir Douglas Hacking | Coalition Conservative | |
| 1922 | Conservative | ||
| 1945 | Clifford Kenyon | Labour | |
| 1970 | Connie Monks | Conservative | |
| Feb 1974 | George Rodgers | Labour | |
| 1979 | Den Dover | Conservative | |
| 1997 | Sir Lindsay Hoyle | Labour | |
Elections
Elections in the 2010s
June 2017
| Party | Candidate | Votes | % | ± | |
|---|---|---|---|---|---|
| Labour | Lindsay Hoyle | 30,745 | 55.3 | +10.2 | |
| Conservative | Caroline Moon | 23,233 | 41.8 | +5.4 | |
| Liberal Democrat | Stephen Fenn | 1,126 | 2.0 | −0.6 | |
| Green | Peter Lageard | 530 | 1.0 | −1.2 | |
| Majority | 7,512 | 13.5 | |||
| Turnout | 55,634 | 72.7 | |||
| Labour hold | Swing | +2.4 | |||
May 2015
| Party | Candidate | Votes | % | ± | |
|---|---|---|---|---|---|
| Labour | Lindsay Hoyle | 23,322 | 45.1 | +1.9 | |
| Conservative | Robert Loughenbury | 18,792 | 36.3 | −1.7 | |
| UKIP | Mark Smith | 6,995 | 13.5 | +9.5 | |
| Liberal Democrat | Stephen Fenn | 1,354 | 2.6 | −11.4 | |
| Green | Alistair Straw | 1,111 | 2.1 | N/A | |
| Independent | Adrian Maudsley | 138 | 0.3 | N/A | |
| Majority | 4,530 | 8.8 | |||
| Turnout | 51,712 | 69.2 | |||
| Labour hold | Swing | +1.4 | |||
May 2010
| Party | Candidate | Votes | % | ± | |
|---|---|---|---|---|---|
| Labour | Lindsay Hoyle | 21,515 | 43.2 | −7.6 | |
| Conservative | Alan Cullens | 18,922 | 38.0 | +3.6 | |
| Liberal Democrat | Stephen Fenn | 6,957 | 14.0 | +0.7 | |
| UKIP | Nick Hogan | 2,021 | 4.1 | N/A | |
| Independent | Christopher P. Curtis | 359 | 0.7 | N/A | |
| Majority | 2,593 | 5.2 | +11.2 | ||
| Turnout | 49,774 | 70.2 | +8.0 | ||
| Labour hold | Swing | +5.6 | |||
Elections in the 2000s
| Party | Candidate | Votes | % | ± | |
|---|---|---|---|---|---|
| Labour | Lindsay Hoyle | 25,131 | 50.7 | −1.6 | |
| Conservative | Simon Mallett | 17,506 | 35.3 | +0.6 | |
| Liberal Democrat | Alexander Wilson-Fletcher | 6,932 | 14.0 | +2.8 | |
| Majority | 7,625 | 15.4 | −2.2 | ||
| Turnout | 49,569 | 62.9 | +0.6 | ||
| Labour hold | Swing | +1.1 | |||
| Party | Candidate | Votes | % | ± | |
|---|---|---|---|---|---|
| Labour | Lindsay Hoyle | 25,088 | 52.3 | −0.7 | |
| Conservative | Peter Booth | 16,644 | 34.7 | −1.2 | |
| Liberal Democrat | Stephen Fenn | 5,372 | 11.2 | +2.7 | |
| UKIP | John Frost | 848 | 1.8 | N/A | |
| Majority | 8,444 | 17.6 | +0.5 | ||
| Turnout | 47,952 | 62.2 | −15.3 | ||
| Labour hold | Swing | +0.3 | |||
Elections in the 1990s
| Party | Candidate | Votes | % | ± | |
|---|---|---|---|---|---|
| Labour | Lindsay Hoyle | 30,607 | 53.0 | +12.0 | |
| Conservative | Den Dover | 20,737 | 35.9 | −11.6 | |
| Liberal Democrat | Simon Jones | 4,900 | 8.5 | −3.0 | |
| Referendum | Anthony Heaton | 1,319 | 2.3 | N/A | |
| Natural Law | Peter Leadbetter | 143 | 0.2 | −0.4 | |
| Majority | 9,870 | 17.1 | +23.7 | ||
| Turnout | 57,706 | 77.3 | +5.2 | ||
| Labour gain from Conservative | Swing | +11.8 | |||
| Party | Candidate | Votes | % | ± | |
|---|---|---|---|---|---|
| Conservative | Den Dover | 30,715 | 47.2 | −0.8 | |
| Labour | Raymond McManus | 26,469 | 40.7 | +6.0 | |
| Liberal Democrat | Janet Ross-Mills | 7,452 | 11.5 | −4.6 | |
| Natural Law | Peter Leadbetter | 402 | 0.6 | N/A | |
| Majority | 4,246 | 6.5 | -6.8 | ||
| Turnout | 65,038 | 82.8 | +5.9 | ||
| Conservative hold | Swing | +3.4 | |||
Elections in the 1980s
| Party | Candidate | Votes | % | ± | |
|---|---|---|---|---|---|
| Conservative | Den Dover | 29,015 | 48.0 | −0.2 | |
| Labour | Anthony Watmough | 20,958 | 34.7 | +4.2 | |
| Liberal | Ian Simpson | 9,706 | 16.1 | −4.2 | |
| Green | Anthony Holgate | 714 | 1.2 | +0.4 | |
| Majority | 8,057 | 13.3 | −4.5 | ||
| Turnout | 60,393 | 76.9 | −2.3 | ||
| Conservative hold | Swing | −2.2 | |||
| Party | Candidate | Votes | % | ± | |
|---|---|---|---|---|---|
| Conservative | Den Dover | 27,861 | 48.3 | +1.5 | |
| Labour | Ivan Taylor | 17,586 | 30.5 | −12.5 | |
| Social Democratic | Peter O'Neill | 11,691 | 20.2 | +10.6 | |
| Ecology | Anthony Holgate | 451 | 0.8 | N/A | |
| Independent | Eva Rokas | 114 | 0.2 | N/A | |
| Majority | 10,275 | 17.8 | +13.9 | ||
| Turnout | 57,703 | 79.2 | +2.8 | ||
| Conservative hold | Swing | +7.0 | |||
Elections in the 1970s
| Party | Candidate | Votes | % | ± | |
|---|---|---|---|---|---|
| Conservative | Den Dover | 31,125 | 46.8 | +7.1 | |
| Labour | George Rodgers | 28,546 | 43.0 | −1.1 | |
| Liberal | Neva Orrell | 6,388 | 9.6 | −6.3 | |
| National Front | Michael John Dean | 379 | 0.6 | N/A | |
| Majority | 2,579 | 3.9 | +8.3 | ||
| Turnout | 66,438 | 82.0 | +0.8 | ||
| Conservative gain from Labour | Swing | +4.1 | |||
| Party | Candidate | Votes | % | ± | |
|---|---|---|---|---|---|
| Labour | George Rodgers | 27,290 | 44.1 | +3.8 | |
| Conservative | Barry Porter | 24,577 | 39.7 | ±0.0 | |
| Liberal | Neva Orrell | 9,831 | 15.9 | −4.1 | |
| More Prosperous Britain | Harold Smith | 185 | 0.3 | N/A | |
| Majority | 2,713 | 4.4 | +3.8 | ||
| Turnout | 61,883 | 81.2 | +2.5 | ||
| Labour hold | Swing | +1.9 | |||
| Party | Candidate | Votes | % | ± | |
|---|---|---|---|---|---|
| Labour | George Rodgers | 25,440 | 40.3 | −4.0 | |
| Conservative | Constance Monks | 25,035 | 39.7 | −7.5 | |
| Liberal | Neva Orrell | 12,652 | 20.0 | +12.1 | |
| Majority | 405 | 0.6 | +3.6 | ||
| Turnout | 63,127 | 83.7 | +4.9 | ||
| Labour gain from Conservative | Swing | +1.8 | |||
| Party | Candidate | Votes | % | ± | |
|---|---|---|---|---|---|
| Conservative | Constance Monks | 26,577 | 47.2 | +2.0 | |
| Labour | Derek Alan Forwood | 24,900 | 44.3 | −10.5 | |
| Liberal | Gordon Payne | 4,428 | 7.9 | N/A | |
| Anti-Party | Barry John Alwyn Elder | 334 | 0.6 | N/A | |
| Majority | 1,677 | 3.0 | +12.5 | ||
| Turnout | 56,239 | 78.8 | +2.3 | ||
| Conservative gain from Labour | Swing | +6.3 | |||
Elections in the 1960s
| Party | Candidate | Votes | % | ± | |
|---|---|---|---|---|---|
| Labour | Clifford Kenyon | 27,319 | 54.8 | +6.4 | |
| Conservative | Constance Monks | 22,575 | 45.2 | +4.1 | |
| Majority | 4,744 | 9.5 | +2.2 | ||
| Turnout | 49,894 | 81.1 | +3.5 | ||
| Labour hold | Swing | +1.2 | |||
| Party | Candidate | Votes | % | ± | |
|---|---|---|---|---|---|
| Labour | Clifford Kenyon | 24,710 | 48.4 | −2.3 | |
| Conservative | John Sutcliffe | 20,997 | 41.1 | −8.2 | |
| Liberal | Alistair Bell | 5,331 | 10.5 | N/A | |
| Majority | 3,713 | 7.3 | +6.0 | ||
| Turnout | 51,038 | 84.6 | −1.1 | ||
| Labour hold | Swing | +3.0 | |||
Elections in the 1950s
| Party | Candidate | Votes | % | ± | |
|---|---|---|---|---|---|
| Labour | Clifford Kenyon | 25,641 | 50.7 | −0.7 | |
| Conservative | Frank Taylor | 24,965 | 49.3 | +0.7 | |
| Majority | 676 | 1.3 | −1.5 | ||
| Turnout | 50,606 | 85.7 | +1.4 | ||
| Labour hold | Swing | +0.7 | |||
| Party | Candidate | Votes | % | ± | |
|---|---|---|---|---|---|
| Labour | Clifford Kenyon | 24,994 | 51.4 | +0.8 | |
| Conservative | Alfred Hall-Davis | 23,656 | 48.6 | −0.8 | |
| Majority | 1,338 | 2.8 | +1.6 | ||
| Turnout | 48,650 | 84.3 | +3.8 | ||
| Labour hold | Swing | +0.8 | |||
| Party | Candidate | Votes | % | ± | |
|---|---|---|---|---|---|
| Labour | Clifford Kenyon | 24,771 | 50.6 | +3.0 | |
| Conservative | Alfred Hall-Davis | 24,118 | 49.4 | +2.5 | |
| Majority | 583 | 1.2 | +0.5 | ||
| Turnout | 48,889 | 88.1 | +0.3 | ||
| Labour hold | Swing | +0.3 | |||
| Party | Candidate | Votes | % | ± | |
|---|---|---|---|---|---|
| Labour | Clifford Kenyon | 23,233 | 47.6 | −5.6 | |
| Conservative | Andrew Fountaine | 22,872 | 46.9 | +0.1 | |
| Liberal | Florence Emilie Adams | 2,706 | 5.5 | N/A | |
| Majority | 361 | 0.7 | +5.7 | ||
| Turnout | 46,105 | 88.4 | +12.2 | ||
| Labour hold | Swing | +2.9 | |||
Elections in the 1940s
| Party | Candidate | Votes | % | ± | |
|---|---|---|---|---|---|
| Labour | Clifford Kenyon | 24,550 | 53.2 | +11.8 | |
| Conservative | Robert Hamilton Brown | 21,595 | 46.8 | −8.5 | |
| Majority | 2,955 | 6.4 | |||
| Turnout | 46,145 | 76.2 | +2.2 | ||
| Labour gain from Conservative | Swing | +10.2 | |||
Elections in the 1930s
| Party | Candidate | Votes | % | ± | |
|---|---|---|---|---|---|
| Conservative | Douglas Hacking | 23,061 | 55.3 | −14.0 | |
| Labour | Arthur Whiting | 17,286 | 41.4 | +10.7 | |
| Ind. Labour Party | Bob Edwards | 1,365 | 3.3 | N/A | |
| Majority | 5,775 | 13.8 | |||
| Turnout | 41,712 | 78.4 | −1.7 | ||
| Conservative hold | Swing | −12.4 | |||
| Party | Candidate | Votes | % | ± | |
|---|---|---|---|---|---|
| Conservative | Douglas Hacking | 28,749 | 69.3 | +23.7 | |
| Labour | John Barrow | 12,734 | 30.7 | −11.7 | |
| Majority | 16,015 | 38.6 | |||
| Turnout | 41,483 | 80.1 | |||
| Conservative hold | Swing | +17.7 | |||
Elections in the 1920s
| Party | Candidate | Votes | % | ± | |
|---|---|---|---|---|---|
| Unionist | Douglas Hacking | 19,728 | 45.6 | −12.1 | |
| Labour | William Taylor | 18,369 | 42.4 | +0.1 | |
| Liberal | Hugh Emlyn-Jones | 5,207 | 12.0 | N/A | |
| Majority | 1,359 | 3.1 | |||
| Turnout | 43,304 | ||||
| Unionist hold | Swing | ||||
| Party | Candidate | Votes | % | ± | |
|---|---|---|---|---|---|
| Unionist | Douglas Hacking | 17,844 | 57.7 | +3.0 | |
| Labour | Zeph Hutchinson | 13,074 | 42.3 | −3.0 | |
| Majority | 4,770 | 15.4 | |||
| Turnout | 30,918 | ||||
| Unionist hold | Swing | +3.0 | |||
| Party | Candidate | Votes | % | ± | |
|---|---|---|---|---|---|
| Unionist | Douglas Hacking | 14,715 | 54.7 | N/A | |
| Labour | Zeph Hutchinson | 12,179 | 45.3 | N/A | |
| Majority | 2,536 | 9.4 | N/A | ||
| Turnout | 26,894 | 74.4 | N/A | ||
| Unionist hold | Swing | N/A | |||
| Party | Candidate | Votes | % | ± | |
|---|---|---|---|---|---|
| Unionist | Douglas Hacking | unopposed | N/A | N/A | |
| Unionist hold | Swing | N/A | |||
Elections in the 1910s
| Party | Candidate | Votes | % | ± | |
|---|---|---|---|---|---|
| C | Unionist | Douglas Hacking | 13,059 | 67.7 | +10.2 |
| Labour | Elijah Sandham | 6,222 | 32.3 | N/A | |
| Majority | 6,837 | 35.4 | +20.4 | ||
| Turnout | 19,896 | 54.5 | −32.6 | ||
| Unionist hold | Swing | N/A | |||
General Election 1914/15: Another General Election was required to take place before the end of 1915. The political parties had been making preparations for an election to take place and by July 1914, the following candidates had been selected;
- Unionist: Henry Hibbert
- Liberal: John Peter Todd Jackson[18]
| Party | Candidate | Votes | % | ± | |
|---|---|---|---|---|---|
| Unionist | Henry Hibbert | 7,573 | 57.5 | −2.8 | |
| Liberal | John Peter Todd Jackson | 5,606 | 42.5 | +2.8 | |
| Majority | 1,967 | 15.0 | −5.6 | ||
| Turnout | 13,179 | 87.1 | +1.3 | ||
| Unionist hold | Swing | −2.8 | |||
| Party | Candidate | Votes | % | ± | |
|---|---|---|---|---|---|
| Conservative | David Lindsay | 7,423 | 60.3 | +2.0 | |
| Liberal | John Peter Todd Jackson | 4,887 | 39.7 | −2.0 | |
| Majority | 2,536 | 20.6 | +4.0 | ||
| Turnout | 12,310 | 85.8 | −6.6 | ||
| Conservative hold | Swing | +2.0 | |||
| Party | Candidate | Votes | % | ± | |
|---|---|---|---|---|---|
| Conservative | David Lindsay | 7,735 | 58.3 | ||
| Liberal | Lyon Blease | 5,523 | 41.7 | ||
| Majority | 2,212 | 16.6 | |||
| Turnout | 13,258 | 92.4 | |||
| Conservative hold | Swing | ||||
Elections in the 1900s
| Party | Candidate | Votes | % | ± | |
|---|---|---|---|---|---|
| Conservative | David Lindsay | 6,803 | 55.7 | N/A | |
| Liberal | Eliot Crawshay-Williams | 5,416 | 44.3 | N/A | |
| Majority | 1,387 | 11.4 | N/A | ||
| Turnout | 12,219 | 92.2 | N/A | ||
| Registered electors | 13,247 | ||||
| Conservative hold | Swing | N/A | |||
| Party | Candidate | Votes | % | ± | |
|---|---|---|---|---|---|
| Conservative | David Lindsay | 6,226 | 56.5 | N/A | |
| Liberal | James Lawrence | 4,798 | 43.5 | N/A | |
| Majority | 1,428 | 13.0 | N/A | ||
| Turnout | 11,024 | 85.9 | N/A | ||
| Registered electors | 12,836 | ||||
| Conservative hold | Swing | N/A | |||
Election results 1885-1918
Elections in the 1880s
| Party | Candidate | Votes | % | ± | |
|---|---|---|---|---|---|
| Conservative | Joseph Feilden | 5,867 | 67.6 | N/A | |
| Liberal | Harold Wright | 2,808 | 32.4 | N/A | |
| Majority | 3,059 | 35.2 | N/A | ||
| Turnout | 8,675 | 87.8 | N/A | ||
| Registered electors | 9,881 | ||||
| Conservative win (new seat) | |||||
| Party | Candidate | Votes | % | ± | |
|---|---|---|---|---|---|
| Conservative | Joseph Feilden | Unopposed | |||
| Conservative hold | |||||
Elections in the 1890s
| Party | Candidate | Votes | % | ± | |
|---|---|---|---|---|---|
| Conservative | Joseph Feilden | Unopposed | |||
| Conservative hold | |||||
| Party | Candidate | Votes | % | ± | |
|---|---|---|---|---|---|
| Conservative | David Lindsay | Unopposed | |||
| Conservative hold | |||||
| Party | Candidate | Votes | % | ± | |
|---|---|---|---|---|---|
| Conservative | David Lindsay | Unopposed | |||
| Conservative hold | |||||
| Party | Candidate | Votes | % | ± | |
|---|---|---|---|---|---|
| Conservative | David Lindsay | Unopposed | |||
| Conservative hold | |||||
See also
Notes and references
- Notes
- ↑ A county constituency (for the purposes of election expenses and type of returning officer)
- ↑ As with all constituencies, the constituency elects one Member of Parliament (MP) by the first past the post system of election at least every five years.
- ↑ And Hoyle is Chairman of Ways and Means a customary position coexisting with that role.
- References
- ↑ "Chorley: Usual Resident Population, 2011". Neighbourhood Statistics. Office for National Statistics. Retrieved 23 February 2015.
- ↑ "Electorate Figures – Boundary Commission for England". 2011 Electorate Figures. Boundary Commission for England. 4 March 2011. Archived from the original on 6 November 2010. Retrieved 13 March 2011.
- ↑ "Chorley 1885–". Hansard 1803–2005. UK Parliament. Retrieved 2 February 2015.
- ↑ Leigh Rayment's Historical List of MPs – Constituencies beginning with "C" (part 4)
- ↑ "Chorley parliamentary constituency". BBC News.
- ↑ "Election Data 2015". Electoral Calculus. Archived from the original on 17 October 2015. Retrieved 17 October 2015.
- ↑ "Chorley". BBC News. Retrieved 10 May 2015.
- ↑ "Election Data 2010". Electoral Calculus. Archived from the original on 26 July 2013. Retrieved 17 October 2015.
- ↑ BBC News, 7 May 2010
- ↑ "Election Data 2005". Electoral Calculus. Archived from the original on 15 October 2011. Retrieved 18 October 2015.
- ↑ "Election Data 2001". Electoral Calculus. Archived from the original on 15 October 2011. Retrieved 18 October 2015.
- ↑ "Election Data 1997". Electoral Calculus. Archived from the original on 15 October 2011. Retrieved 18 October 2015.
- ↑ "Election Data 1992". Electoral Calculus. Archived from the original on 15 October 2011. Retrieved 18 October 2015.
- ↑ "UK General Election results April 1992". Richard Kimber's Political Science Resources. Politics Resources. 9 April 1992. Retrieved 2010-12-06.
- ↑ "Election Data 1987". Electoral Calculus. Archived from the original on 15 October 2011. Retrieved 18 October 2015.
- ↑ "Election Data 1983". Electoral Calculus. Archived from the original on 15 October 2011. Retrieved 18 October 2015.
- 1 2 3 4 5 British Parliamentary Election Results 1918–1949, FWS Craig
- ↑ Manchester Courier and Lancashire General Advertiser 11 May 1914
- 1 2 3 4 5 6 7 8 9 10 11 British Parliamentary Election Results 1885-1918, FWS Craig
- 1 2 Debrett's House of Commons & Judicial Bench, 1916
- 1 2 3 4 5 6 7 8 The Liberal Year Book, 1907
- ↑ Debrett's House of Commons & Judicial Bench, 1886
- 1 2 3 Debrett's House of Commons & Judicial Bench, 1901
- Sources
External links
- nomis Constituency Profile for Chorley — presenting data from the ONS annual population survey and other official statistics.