Vale of Glamorgan (UK Parliament constituency)
Coordinates: 51°25′44″N 3°21′04″W / 51.429°N 3.351°W
| Vale of Glamorgan | |
|---|---|
|
County constituency for the House of Commons | |
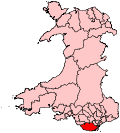 Boundary of Vale of Glamorgan in Wales. | |
| Preserved county | South Glamorgan |
| Electorate | 71,585 (December 2010)[1] |
| Major settlements | Barry, Llantwit Major, Dinas Powys, Cowbridge |
| Current constituency | |
| Created | 1983 |
| Member of parliament | Alun Cairns (Conservative) |
| Number of members | One |
| Created from | Barry and Pontypridd[2] |
| Overlaps | |
| Welsh Assembly | South Wales Central |
| European Parliament constituency | Wales |
Vale of Glamorgan (Welsh: Bro Morgannwg) is a county constituency in South Wales, represented in the House of Commons of the Parliament of the United Kingdom. It elects one Member of Parliament (MP), using the first-past-the-post voting system.
It is something of a bellwether, having been won by the party with a plurality of seats in every general election since the seat was created in 1983.
Boundaries
1983-2010: The Borough of Vale of Glamorgan wards of Baruc, Buttrills, Cadoc, Castleland, Court, Cowbridge, Dinas Powys, Dyfan, Gibbonsdown, Illtyd, Llandow, Llantwit Major, Peterson-super-Ely, Rhoose, St Athan, Sully, and Wenvoe.
2010-present: The Vale of Glamorgan County Borough electoral divisions of Baruc, Buttrills, Cadoc, Castleland, Court, Cowbridge, Dinas Powys, Dyfan, Gibbonsdown, Illtyd, Llandow and Ewenny, Llantwit Major, Peterston-super-Ely, Rhoose, St Athan, St Bride’s Major, and Wenvoe.
This marginal constituency to the west of Cardiff takes in the Labour-voting seaside resort of Barry and a number of Conservative villages and small towns, such as Cowbridge. There have been some close shaves for both parties here in the past: Conservative Walter Sweeney got home by a mere 19 votes in 1992; and John Smith (namesake of the late previous Labour leader) had a majority of under 2,000 in 2005. John Smith stood down from Parliament due to ill health, and the seat went Conservative at the 2010 election.
Sully ward was transferred to Cardiff South and Penarth in 2010.
Members of Parliament
| Election | Member[3] | Party | |
|---|---|---|---|
| 1983 | Sir Raymond Gower | Conservative | |
| 1989 by-election | John Smith | Labour | |
| 1992 | Walter Sweeney | Conservative | |
| 1997 | John Smith | Labour | |
| 2010 | Alun Cairns | Conservative | |
Elections
Elections in the 2010s
| Party | Candidate | Votes | % | ± | |
|---|---|---|---|---|---|
| Conservative | Alun Cairns | 25,501 | 47.5 | +1.5 | |
| Labour | Camilla Beaven | 23,311 | 43.4 | +10.8 | |
| Plaid Cymru | Ian Johnson | 2,295 | 4.3 | −1.3 | |
| Liberal Democrat | Jennifer Geroni | 1,020 | 1.9 | −0.7 | |
| UKIP | Melanie Hunter-Clarke | 868 | 1.8 | -8.1 | |
| Green | Stephen Davis-Barker | 419 | 0.8 | −1.3 | |
| Women's Equality | Sharon Lovell | 177 | 0.3 | N/A | |
| Pirate | David Elston | 127 | 0.2 | N/A | |
| Majority | 2,190 | 4.1 | -9.3 | ||
| Turnout | 53,718 | 72.6 | +1.5 | ||
| Registered electors | 73,959 | ||||
| Conservative hold | Swing | -4.6 | |||
| Party | Candidate | Votes | % | ± | |
|---|---|---|---|---|---|
| Conservative | Alun Cairns | 23,607 | 46.0 | +4.2 | |
| Labour | Chris Elmore | 16,727 | 32.6 | −0.3 | |
| UKIP | Kevin Mahoney | 5,489 | 10.7 | +7.6 | |
| Plaid Cymru | Ian Johnson | 2,869 | 5.6 | +0.1 | |
| Liberal Democrat | David Morgan[7] | 1,309 | 2.6 | −12.7 | |
| Green | Alan Armstrong | 1,054 | 2.1 | +1.1 | |
| CISTA | Steve Reed | 238 | 0.5 | N/A | |
| Majority | 6,880 | 13.4 | +4.6 | ||
| Turnout | 51,293 | 71.1 | +1.8 | ||
| Registered electors | 72,794 | ||||
| Conservative hold | Swing | +2.3 | |||
| Party | Candidate | Votes | % | ± | |
|---|---|---|---|---|---|
| Conservative | Alun Cairns | 20,341 | 41.8 | +4.4 | |
| Labour | Alana E. Davies | 16,034 | 32.9 | −7.8 | |
| Liberal Democrat | Eluned Parrott | 7,403 | 15.2 | +2.0 | |
| Plaid Cymru | Ian Johnson | 2,667 | 5.5 | +0.4 | |
| UKIP | Kevin Mahoney | 1,529 | 3.1 | +1.4 | |
| Green | Rhodri H. Thomas | 457 | 0.9 | N/A | |
| Christian | John Harrold | 236 | 0.5 | N/A | |
| Majority | 4,307 | 8.8 | N/A | ||
| Turnout | 48,667 | 69.3 | +0.7 | ||
| Registered electors | 70,211 | ||||
| Conservative gain from Labour | Swing | +6.1 | |||
Elections in the 2000s
| Party | Candidate | Votes | % | ± | |
|---|---|---|---|---|---|
| Labour | John William Patrick Smith | 19,481 | 41.2 | −4.2 | |
| Conservative | Alun Cairns | 17,673 | 37.3 | +2.3 | |
| Liberal Democrat | Mark Hooper | 6,140 | 13.0 | +0.8 | |
| Plaid Cymru | Barry Shaw | 2,423 | 5.1 | −1.2 | |
| UKIP | Richard Suchorzewski | 840 | 1.8 | +0.8 | |
| Liberal | Karl-James Langford | 605 | 1.3 | N/A | |
| Socialist Labour | Paul Mules | 162 | 0.3 | N/A | |
| Majority | 1,808 | 3.8 | -6.6 | ||
| Turnout | 47,324 | 68.9 | +2.2 | ||
| Registered electors | 68,657 | ||||
| Labour hold | Swing | −3.3 | |||
| Party | Candidate | Votes | % | ± | |
|---|---|---|---|---|---|
| Labour | John William Patrick Smith | 20,524 | 45.4 | −8.5 | |
| Conservative | Susan Inkin | 15,824 | 35.0 | +0.7 | |
| Liberal Democrat | Dewi Smith | 5,521 | 12.2 | +3.0 | |
| Plaid Cymru | Chris Franks | 2,867 | 6.3 | +3.8 | |
| UKIP | Timothy Warry | 448 | 1.0 | N/A | |
| Majority | 4,700 | 10.4 | -9.1 | ||
| Turnout | 45,184 | 66.7 | −13.3 | ||
| Registered electors | 67,774 | ||||
| Labour hold | Swing | -4.6 | |||
Elections in the 1990s
| Party | Candidate | Votes | % | ± | |
|---|---|---|---|---|---|
| Labour | John William Patrick Smith | 29,054 | 53.9 | +9.6 | |
| Conservative | Walter Sweeney | 18,522 | 34.4 | −9.9 | |
| Liberal Democrat | Suzanne Campbell | 4,945 | 9.2 | +0.0 | |
| Plaid Cymru | Melanie Corp | 1,393 | 2.6 | +0.5 | |
| Majority | 10,532 | 19.5 | N/A | ||
| Turnout | 53,914 | 80.0 | −1.9 | ||
| Registered electors | 67,413 | ||||
| Labour gain from Conservative | Swing | -9.8 | |||
| Party | Candidate | Votes | % | ± | |
|---|---|---|---|---|---|
| Conservative | Walter Sweeney | 24,220 | 44.3 | −2.4 | |
| Labour | John William Patrick Smith | 24,201 | 44.3 | +9.6 | |
| Liberal Democrat | David Keith Davies | 5,045 | 9.2 | −7.4 | |
| Plaid Cymru | David Haswell | 1,160 | 2.1 | +0.3 | |
| Majority | 19 | 0.0 | −12.0 | ||
| Turnout | 54,626 | 81.9 | +2.6 | ||
| Registered electors | 66,672 | ||||
| Conservative gain from Labour | Swing | ||||
Elections in the 1980s
| Party | Candidate | Votes | % | ± | |
|---|---|---|---|---|---|
| Labour | John William Patrick Smith | 23,342 | 48.9 | +14.2 | |
| Conservative | Rod Richards | 17,314 | 36.3 | −10.5 | |
| Social and Liberal Democrats | Frank Leavers | 2,017 | 4.2 | N/A | |
| Plaid Cymru | John Dixon | 1,672 | 3.5 | +1.7 | |
| SDP | David Keith Davies | 1,098 | 2.3 | N/A | |
| Green | Marilyn Wakefield | 971 | 2.0 | N/A | |
| Protect the Health Service | Christopher Tiarks | 847 | 1.8 | N/A | |
| Monster Raving Loony | Screaming Lord Sutch | 266 | 0.5 | N/A | |
| Independent Welsh Socialist | Eric Roberts | 148 | 0.3 | N/A | |
| Corrective Party | Lindi St Claire | 39 | 0.1 | N/A | |
| Christian Alliance | David Black | 32 | 0.1 | N/A | |
| Majority | 6,028 | 12.6 | N/A | ||
| Turnout | 47,746 | 70.7 | -8.6 | ||
| Registered electors | 67,549 | ||||
| Labour gain from Conservative | Swing | −12.4 | |||
| Party | Candidate | Votes | % | ± | |
|---|---|---|---|---|---|
| Conservative | Raymond Gower | 24,229 | 46.8 | −1.2 | |
| Labour | John William Patrick Smith | 17,978 | 34.7 | +8.9 | |
| Social Democratic | David Keith Davies | 8,633 | 16.7 | −7.2 | |
| Plaid Cymru | Penri Williams | 946 | 1.8 | −0.5 | |
| Majority | 6,251 | 12.1 | -10.1 | ||
| Turnout | 51,786 | 79.3 | +5.1 | ||
| Registered electors | 65,310 | ||||
| Conservative hold | Swing | −5.1 | |||
| Party | Candidate | Votes | % | ± | |
|---|---|---|---|---|---|
| Conservative | Raymond Gower | 22,241 | 48.0 | N/A | |
| Labour | Michael Sharp | 12,028 | 25.8 | N/A | |
| Social Democratic | William Evans | 11,154 | 23.9 | N/A | |
| Plaid Cymru | Andrew John Dixon | 1,068 | 2.3 | N/A | |
| Majority | 10,393 | 22.2 | N/A | ||
| Turnout | 46,671 | 74.2 | N/A | ||
| Registered electors | 62,885 | ||||
| Conservative win (new seat) | |||||
See also
Notes and references
- ↑ "Beyond 20/20 WDS – Table view". 2011 Electorate Figures. StatsWales. 1 December 2010. Retrieved 13 March 2011.
- ↑ "'Vale of Glamorgan', June 1983 up to May 1997". ElectionWeb Project. Cognitive Computing Limited. Archived from the original on 15 March 2016. Retrieved 14 March 2016.
- ↑ Leigh Rayment's Historical List of MPs – Constituencies beginning with "V"
- ↑ https://www.valeofglamorgan.gov.uk/Documents/Our%20Council/Council/Elections/Combined-notice-of-poll-persons-nom-stations-2.docx
- ↑ "Election Data 2015". Electoral Calculus. Archived from the original on 17 October 2015. Retrieved 17 October 2015.
- ↑ "Vale of Glamorgan result" (PDF). Statement of Results. Vale of Glamorgan Council. Retrieved 20 September 2015.
- ↑ http://www.libdems.org.uk/list_of_selected_candidates#
- ↑ "Election Data 2010". Electoral Calculus. Archived from the original on 26 July 2013. Retrieved 17 October 2015.
- ↑ Vale of Glamorgan, Vale of Glamorgan County Borough Council – candidates – Vale of Glamorgan
- ↑ Vale of Glamorgan BBC Election – Vale of Glamorgan
- ↑ "Election Data 2005". Electoral Calculus. Archived from the original on 15 October 2011. Retrieved 18 October 2015.
- ↑ "Election Data 2001". Electoral Calculus. Archived from the original on 15 October 2011. Retrieved 18 October 2015.
- ↑ "Election Data 1997". Electoral Calculus. Archived from the original on 15 October 2011. Retrieved 18 October 2015.
- ↑ "Election Data 1992". Electoral Calculus. Archived from the original on 15 October 2011. Retrieved 18 October 2015.
- ↑ "Politics Resources". Election 1992. Politics Resources. 9 April 1992. Retrieved 2010-12-06.
- ↑ "Election Data 1987". Electoral Calculus. Archived from the original on 15 October 2011. Retrieved 18 October 2015.
- ↑ "Election Data 1983". Electoral Calculus. Archived from the original on 15 October 2011. Retrieved 18 October 2015.
External links
- Politics Resources (Election results from 1922 onwards)
- Electoral Calculus (Election results from 1955 onwards)
- 2017 Election House Of Commons Library 2017 Election report
- A Vision Of Britain Through Time (Constituency elector numbers)