Morecambe and Lunesdale (UK Parliament constituency)
Coordinates: 54°05′20″N 2°49′26″W / 54.089°N 2.824°W
| Morecambe and Lunesdale | |
|---|---|
|
County constituency for the House of Commons | |
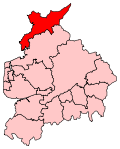 Boundary of Morecambe and Lunesdale in Lancashire. | |
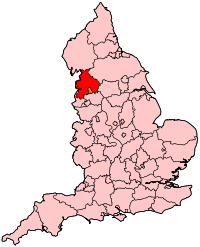 Location of Lancashire within England. | |
| County | Lancashire |
| Electorate | 69,254 (December 2010)[1] |
| Major settlements | Morecambe, Heysham, Carnforth and Skerton |
| Current constituency | |
| Created | 1950 |
| Member of parliament | David Morris (Conservative) |
| Number of members | One |
| Created from | Lonsdale |
| Overlaps | |
| European Parliament constituency | North West England |
Morecambe and Lunesdale is a constituency[n 1] represented in the House of Commons of the UK Parliament since 2010 by David Morris, a Conservative.[n 2]
Constituency profile
Since 1979 the constituency has been a bellwether and includes the seaside town and many villages as well as the north bank of the City of Lancaster, which is largely Skerton. This seat brings together northern semi-rural reaches of Lancashire bisected by the M6, including seaside Silverdale and Carnforth south of the Cumbria border, the seaside resort of Morecambe and the nuclear power station/ferry port village of Heysham which provides a direct east-west service to Warrenpoint, Northern Ireland. Separating Morecambe from Lancaster is a narrow belt of parkland, houses and the White Lund industrial estate.[2]
Boundaries
Before 1950, Morecambe was in the Lancaster constituency. This seat was formerly Morecambe and Lonsdale and gained a new name and redrawn boundaries in 1983. For the General Election of that year, sections of the constituency removed to be united with the former county of Westmorland in the Westmorland and Lonsdale constituency. For the 1983 election the electoral wards used in the creation of the new seat were:
- Alexandra, Arkholme, Bolton-le-Sands, Carnforth, Halton-with-Aughton, Harbour, Heysham Central, Heysham North, Kellet, Overton, Parks, Poulton, Silverdale, Slyne-with-Hest, Torrisholme, Victoria and Walton[3]
In boundary changes in the 2000s, only minor adjustments were made. Parliament approved the Boundary Commission's Fifth Periodic Review of Westminster constituencies recommendations in respect of this area, enacting only minor boundary alterations. The constituency has City of Lancaster electoral wards:
- Bolton-le-Sands, Carnforth, Halton-with-Aughton, Harbour, Heysham Central, Heysham North, Heysham South, Kellet, Overton, Poulton, Silverdale, Skerton East, Skerton West, Slyne-with-Hest, Torrisholme, Upper Lune Valley, Warton and Westgate.
History
Once a safe Conservative seat, Morecambe followed its neighbour and fellow seaside town, Blackpool, by voting Labour in the 1997 General Election. The results in the general elections of 1997, 2001 and 2005 had remarkably similar majorities with virtually no swing to the Conservatives. The Conservatives gained the seat at the 2010 General Election with an above average swing
Members of Parliament
| Election | Member[4] | Party | |
|---|---|---|---|
| 1950 | constituency created as "Morecambe and Lonsdale" | ||
| 1950 | Ian Fraser | Conservative | |
| 1958 by-election | Basil de Ferranti | Conservative | |
| 1964 | Alfred Hall-Davis | Conservative | |
| 1979 | Mark Lennox-Boyd | Conservative | |
| 1983 | constituency renamed as "Morecambe and Lunesdale" after boundary changes | ||
| 1983 | Mark Lennox-Boyd | Conservative | |
| 1997 | Geraldine Smith | Labour | |
| 2010 | David Morris | Conservative | |
Elections
Elections in the 2010s
| Party | Candidate | Votes | % | ± | |
|---|---|---|---|---|---|
| Labour | Lizzi Collinge[5] | ||||
| Conservative | David Morris | ||||
| Liberal Democrat | |||||
| UKIP | |||||
| Majority | |||||
| Turnout | |||||
| Party | Candidate | Votes | % | ± | |
|---|---|---|---|---|---|
| Conservative | David Morris | 21,773 | 47.7 | +2.2 | |
| Labour | Vikki Singleton | 20,374 | 44.6 | +9.7 | |
| Liberal Democrat | Matthew Severn | 1,699 | 3.7 | 0.0 | |
| UKIP | Robert Gillespie | 1,333 | 2.9 | −9.5 | |
| Green | Cait Sinclair | 478 | 1.0 | −2.2 | |
| Majority | 1,399 | 3.1 | −7.5 | ||
| Turnout | 45657 | 68.3 | +3.3 | ||
| Conservative hold | Swing | −3.8 | |||
| Party | Candidate | Votes | % | ± | |
|---|---|---|---|---|---|
| Conservative | David Morris | 19,691 | 45.5 | +4.0 | |
| Labour | Amina Lone | 15,101 | 34.9 | −4.6 | |
| UKIP | Steven Ogden | 5,358 | 12.4 | +8.1 | |
| Liberal Democrat | Matthew Severn | 1,612 | 3.7 | −9.6 | |
| Green | Phil Chandler | 1,395 | 3.2 | +1.8 | |
| Independent | Michael Dawson | 85 | 0.2 | +0.2 | |
| Majority | 4,590 | 10.6 | +8.6 | ||
| Turnout | 43,242 | 65.0 | +2.9 | ||
| Conservative hold | Swing | +4.3 | |||
| Party | Candidate | Votes | % | ± | |
|---|---|---|---|---|---|
| Conservative | David Morris | 18,035 | 41.5 | +4.2 | |
| Labour | Geraldine Smith | 17,169 | 39.5 | −9.5 | |
| Liberal Democrat | Les Jones | 5,791 | 13.3 | −0.3 | |
| UKIP | Nigel Brown | 1,843 | 4.2 | N/A | |
| Green | Chris Coates | 598 | 1.4 | N/A | |
| Majority | 866 | 2.0 | −9.5 | ||
| Turnout | 43,436 | 62.1 | +0.7 | ||
| Conservative gain from Labour | Swing | −6.9 | |||
Elections in the 2000s
| Party | Candidate | Votes | % | ± | |
|---|---|---|---|---|---|
| Labour | Geraldine Smith | 20,331 | 48.8 | −0.8 | |
| Conservative | James Airey | 15,563 | 37.4 | +0.1 | |
| Liberal Democrat | Alex Stone | 5,741 | 13.8 | +4.6 | |
| Majority | 4,768 | 11.5 | |||
| Turnout | 41,635 | 61.4 | +0.3 | ||
| Labour hold | Swing | −0.4 | |||
| Party | Candidate | Votes | % | ± | |
|---|---|---|---|---|---|
| Labour | Geraldine Smith | 20,646 | 49.6 | +0.7 | |
| Conservative | David Nuttall | 15,554 | 37.3 | +0.6 | |
| Liberal Democrat | Christopher Cotton | 3,817 | 9.2 | −2.2 | |
| UKIP | Greg Beaman | 935 | 2.2 | N/A | |
| Green | Cherith Adams | 703 | 1.7 | N/A | |
| Majority | 5,092 | 12.3 | |||
| Turnout | 41,655 | 61.1 | −11.2 | ||
| Labour hold | Swing | ||||
Elections in the 1990s
| Party | Candidate | Votes | % | ± | |
|---|---|---|---|---|---|
| Labour | Geraldine Smith | 24,061 | 48.9 | N/A | |
| Conservative | Mark Lennox-Boyd | 18,096 | 36.7 | N/A | |
| Liberal Democrat | June Greenwell | 5,614 | 11.4 | N/A | |
| Referendum | Ian Ogilvie | 1,313 | 2.7 | N/A | |
| Natural Law | David Walne | 165 | 0.3 | N/A | |
| Majority | 5,965 | 12.1 | N/A | ||
| Turnout | 49,249 | 72.3 | N/A | ||
| Labour gain from Conservative | Swing | +19.1 | |||
| Party | Candidate | Votes | % | ± | |
|---|---|---|---|---|---|
| Conservative | Mark Lennox-Boyd | 22,507 | 50.9 | −1.8 | |
| Labour | Jean Yates | 10,998 | 24.9 | +2.4 | |
| Liberal Democrat | Anthony Saville | 9,584 | 21.7 | −3.2 | |
| Morecambe Bay Independent | Mark Turner | 916 | 2.1 | N/A | |
| Natural Law | Richard Marriott | 205 | 0.5 | N/A | |
| Majority | 11,509 | 26.0 | −1.8 | ||
| Turnout | 44,210 | 78.3 | +2.2 | ||
| Conservative hold | Swing | −2.1 | |||
Elections in the 1980s
| Party | Candidate | Votes | % | ± | |
|---|---|---|---|---|---|
| Conservative | Mark Lennox-Boyd | 22, 327 | 52.7 | −3.9 | |
| Social Democratic | June Greenwell | 10,542 | 24.9 | −0.3 | |
| Labour | David Smith | 9, 535 | 22.5 | +4.8 | |
| Majority | 11,785 | 27.7 | |||
| Turnout | 42,404 | 76.1 | |||
| Conservative hold | Swing | ||||
| Party | Candidate | Votes | % | ± | |
|---|---|---|---|---|---|
| Conservative | Mark Lennox-Boyd | 21,968 | 56.6 | N/A | |
| Social Democratic | Tom Clare | 9,774 | 25.2 | N/A | |
| Labour | Abbott Bryning | 6,882 | 17.7 | N/A | |
| Independent | Irene Woods | 208 | 0.5 | N/A | |
| Majority | 12,194 | 31.4 | N/A | ||
| Turnout | 38,832 | 72.9 | N/A | ||
| Conservative win (new seat) | |||||
Morecambe and Lonsdale election results, 1950-79
See also
Notes and references
- Notes
- ↑ A county constituency (for the purposes of election expenses and type of returning officer)
- ↑ As with all constituencies, the constituency elects one Member of Parliament (MP) by the first past the post system of election at least every five years.
- References
- ↑ "Electorate Figures - Boundary Commission for England". 2011 Electorate Figures. Boundary Commission for England. 4 March 2011. Archived from the original on 6 November 2010. Retrieved 13 March 2011.
- ↑ "OpenStreetMap". openstreetmap.org.
- ↑ Crewe, Ivor (1983). British Parliamentary constituencies - a statistical compendium. faber and faber. ISBN 0-571-13236-7.
- ↑ Leigh Rayment's Historical List of MPs – Constituencies beginning with "M" (part 3)
- ↑ "Who have Labour members picked to fight the general election target seats? - LabourList". 29 January 2018.
- ↑ "Morecambe & Lunesdale parliamentary constituency". BBC News: Election 2017. 9 June 2017.
- ↑ "Election Data 2015". Electoral Calculus. Archived from the original on 17 October 2015. Retrieved 17 October 2015.
- ↑ "Morecambe & Lunesdale". BBC News. Archived from the original on 11 May 2015. Retrieved 11 May 2015.
- ↑ "Election Data 2010". Electoral Calculus. Archived from the original on 26 July 2013. Retrieved 17 October 2015.
- ↑ "Election Data 2005". Electoral Calculus. Archived from the original on 15 October 2011. Retrieved 18 October 2015.
- ↑ "Election Data 2001". Electoral Calculus. Archived from the original on 15 October 2011. Retrieved 18 October 2015.
- ↑ "Election Data 1997". Electoral Calculus. Archived from the original on 15 October 2011. Retrieved 18 October 2015.
- ↑ "Election Data 1992". Electoral Calculus. Archived from the original on 15 October 2011. Retrieved 18 October 2015.
- ↑ "UK General Election results April 1992". Richard Kimber's Political Science Resources. Politics Resources. 9 April 1992. Retrieved 2010-12-06.
- ↑ "Election Data 1987". Electoral Calculus. Archived from the original on 15 October 2011. Retrieved 18 October 2015.
- ↑ "Election Data 1983". Electoral Calculus. Archived from the original on 15 October 2011. Retrieved 18 October 2015.