Barking (UK Parliament constituency)
| Barking | |
|---|---|
|
Borough constituency for the House of Commons | |
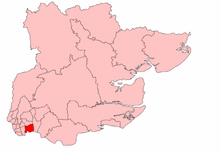
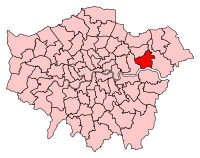 Boundary of Barking in Greater London. | |
| County | Greater London |
| Population | 122,313 (2011 census)[1] |
| Electorate | 74,027 (December 2010)[2] |
| Major settlements | Barking and Becontree |
| Current constituency | |
| Created | 1945 |
| Member of parliament | Margaret Hodge (Labour) |
| Created from | Romford |
| Overlaps | |
| European Parliament constituency | London |
Barking is a constituency formed in 1945;[n 1] represented throughout by a member of the Labour Party in the House of Commons of the UK Parliament — since 1994 its MP has been Margaret Hodge, a frontbencher from 2001 to 2015. Hodge chaired the Public Account Committee (2010–2015) for which she was made DBE.[n 2]
Political history
The area has elected Labour MPs since its creation in 1945, on strong majorities of 20.4% of the vote or greater; except for results in 1983 and 1987.
The rise in support for the British National Party since the turn of the 21st century saw the party attain 17% of the vote at the 2005 general election. Party members and supporters were optimistic that the party would soon make the breakthrough into UK parliament, and party leader Nick Griffin stood in Barking for the 2010 general election. However, his performance in Barking was poor as he polled 14.8% of the vote and Margaret Hodge retained the seat with more than half of the vote.[3] During the run-up to the 2010 election, filmmaker Laura Fairrie had access to the British National Party and Labour Party campaigns and later produced a documentary The Battle for Barking, which was premiered on More 4 on 30 November 2010.[4]
Bucking the national trend, the incumbent MP Margaret Hodge almost doubled her majority at the 2010 general election. The 2015 result for Hodge made the seat the 53rd safest of Labour's 232 seats by percentage of majority.[5]
Constituency profile
Set in the east of Greater London, the seat of Barking is one of the areas identified for London's planned expansion in housing. The Barking Riverside regeneration project aims to create new homes, jobs and services on the site of the former power station.
Labour since 1945, Margaret Hodge has been the seat's MP since 1994. A challenge from the BNP in 2005 saw her vote reduced by over 13% on 2001. The BNP, with 16.9% of the vote, out-polled the Liberal Democrats for third place and were 27 votes behind the Conservatives.
At 7.4%, the seat has the 21st highest proportion of unemployed people among constituencies in England and Wales, according to ONS 2011 Census data. It has the third highest proportion of people from Africa. One in six is Asian/Asian British. In 2010, Labour won with 54.3% of the vote, Conservatives 17.8%, BNP 14.6%.
In 2015, the UKIP vote increased to almost 23%, this was predicted as they came the runners up in every ward in the 2014 Barking and Dagenham Council election, they came within 200 votes of winning 4 seats on the council.
In 2017, the UKIP vote collapsed, and Labour and the Conservatives both increased their voteshare, although Labour's increase of 10.1% saw them claim 67.8% of the vote overall (their largest share in Barking in any election since the 1994 by-election and the greatest in a general election since 1970), increasing their majority from 35.5% to 45.3%.
The constituency has benefited from the Summer Olympics 2012 in London and its districts include a larger than average proportion of social housing and earners on low incomes.[6]
Boundaries
1945–1974: The Municipal Borough of Barking.
1974–1983: The London Borough of Barking wards of Abbey, Cambell, Gascoigne, Longbridge, and Manor.
1983–1997: The London Borough of Barking and Dagenham wards of Abbey, Cambell, Eastbury, Gascoigne, Goresbrook, Longbridge, Manor, Parsloes, and Thames.
1997–2010: The London Borough of Barking and Dagenham wards of Abbey, Becontree, Cambell, Eastbury, Gascoigne, Goresbrook, Longbridge, Manor, Parsloes, and Thames.
2010–present: The London Borough of Barking and Dagenham wards of Abbey, Alibon, Becontree, Eastbury, Gascoigne, Goresbrook, Longbridge, Mayesbrook, Parsloes, Thames, and Valence.[7]
2010 boundary changes
Following their review of parliamentary representation the Boundary Commission for England recommended that the wards of Alibon, Parsloes and Valence be transferred from the old Dagenham constituency to Barking, and that following a review of ward boundaries a small part of River ward be transferred from Barking to help form the new Dagenham and Rainham constituency. These boundaries were first contested for the 2010 general election.
2016 boundary review
Under this review, being consulted on in 2016, Alibon and Valence Wards would transfer out to Dagenham-and-Rainham constituency, and Goodmayes and Mayfield Wards would transfer in from Ilford South constituency.[8]
Members of Parliament
| Election | Member[9] | Party | |
|---|---|---|---|
| 1945 | Somerville Hastings | Labour | |
| 1959 | Tom Driberg | Labour | |
| Feb 1974 | Jo Richardson | Labour | |
| 1994 by-election | Margaret Hodge | Labour | |
Elections
Elections in the 2010s
| Party | Candidate | Votes | % | ± | |
|---|---|---|---|---|---|
| Labour | Margaret Hodge | 32,319 | 67.8 | +10.1 | |
| Conservative | Minesh Talati | 10,711 | 22.5 | +6.2 | |
| UKIP | Roger Gravett | 3,031 | 6.4 | -15.8 | |
| Green | Shanon Butterfield | 724 | 1.5 | -0.6 | |
| Liberal Democrat | Pauline Pearce | 599 | 1.3 | +0.04 | |
| Independent | Noel Falvey | 295 | 0.6 | N/A | |
| Majority | 21,608 | 45.3 | +10.2 | ||
| Turnout | 47,679 | 61.9 | +3.7 | ||
| Registered electors | 77,022 | ||||
| Labour hold | Swing | +1.97 | |||
| Party | Candidate | Votes | % | ± | |
|---|---|---|---|---|---|
| Labour | Margaret Hodge | 24,826 | 57.7 | +3.4 | |
| UKIP | Roger Gravett | 9,554 | 22.2 | +19.3 | |
| Conservative | Mina Rahman[17] | 7,019 | 16.3 | −1.5 | |
| Green | Tony Rablen | 879 | 2.0 | +1.3 | |
| Liberal Democrat | Peter Wilcock | 562 | 1.3 | −6.9 | |
| TUSC | Joseph Mambuliya[18] | 183 | 0.4 | N/A | |
| Majority | 15,272 | 35.5 | -1.0 | ||
| Turnout | 43,023 | 58.2 | −3.2 | ||
| Registered electors | 73,977 | ||||
| Labour hold | Swing | +1.97 | |||
| Party | Candidate | Votes | % | ± | |
|---|---|---|---|---|---|
| Labour | Margaret Hodge | 24,628 | 54.3 | +4.7 | |
| Conservative | Simon Marcus | 8,073 | 17.8 | +1.2 | |
| BNP | Nick Griffin | 6,620 | 14.8 | −1.7 | |
| Liberal Democrat | Dominic Carman | 3,719 | 8.2 | −2.6 | |
| UKIP | Frank Maloney | 1,300 | 2.9 | −0.6 | |
| Christian | George Hargreaves | 482 | 1.1 | N/A | |
| Green | Jayne Forbes | 317 | 0.7 | −1.0 | |
| Monster Raving Loony | Crucial Chris Dowling | 82 | 0.2 | N/A | |
| Independent | Thomas Darwood | 77 | 0.2 | N/A | |
| Restoration Party | Dapo Sijuwola | 45 | 0.1 | N/A | |
| Majority | 16,555 | 36.5 | +5.8 | ||
| Turnout | 44,343 | 61.4 | +13.2 | ||
| Registered electors | 73,868 | ||||
| Labour hold | Swing | +1.7 | |||
Elections in the 2000s
| Party | Candidate | Votes | % | ± | |
|---|---|---|---|---|---|
| Labour | Margaret Hodge | 13,826 | 47.8 | −13.1 | |
| Conservative | Keith Prince | 4,943 | 17.1 | −5.9 | |
| BNP | Richard Barnbrook | 4,916 | 16.9 | +10.6 | |
| Liberal Democrat | Toby Wickenden | 3,211 | 11.1 | +1.3 | |
| UKIP | Terry Jones | 803 | 2.8 | +2.8 | |
| Green | Laurie Cleeland | 618 | 2.1 | +2.1 | |
| Independent | Demetrious Panton | 530 | 1.8 | +1.8 | |
| Workers Revolutionary | Mick Saxby | 59 | 0.2 | +0.2 | |
| Majority | 8,883 | 30.7 | -7.2 | ||
| Turnout | 28,906 | 50.1 | +4.6 | ||
| Registered electors | 57,658 | ||||
| Labour hold | Swing | −3.6 | |||
| Party | Candidate | Votes | % | ± | |
|---|---|---|---|---|---|
| Labour | Margaret Hodge | 15,302 | 60.9 | −4.9 | |
| Conservative | Mike Weatherley | 5,768 | 23.0 | +5.4 | |
| Liberal Democrat | Anura Keppetipola | 2,450 | 9.8 | +0.3 | |
| BNP | Mark C. Tolman | 1,606 | 6.4 | +3.7 | |
| Majority | 9,534 | 37.9 | -10.3 | ||
| Turnout | 25,126 | 45.5 | −16.2 | ||
| Registered electors | 55,229 | ||||
| Labour hold | Swing | −5.2 | |||
Elections in the 1990s
| Party | Candidate | Votes | % | ± | |
|---|---|---|---|---|---|
| Labour | Margaret Hodge | 21,698 | 65.8 | +14.2 | |
| Conservative | Keith Langford | 5,802 | 17.6 | −16.3 | |
| Liberal Democrat | Mark Marsh | 3,128 | 9.5 | −5.0 | |
| Referendum | Colin Taylor | 1,283 | 3.9 | N/A | |
| BNP | Mark Tolman | 894 | 2.7 | N/A | |
| ProLife Alliance | Damien Mearns | 159 | 0.5 | N/A | |
| Majority | 15,896 | 48.2 | +30.5 | ||
| Turnout | 32,962 | 61.7 | -8.3 | ||
| Registered electors | 53,458 | ||||
| Labour hold | Swing | +15.3 | |||
| Party | Candidate | Votes | % | ± | |
|---|---|---|---|---|---|
| Labour | Margaret Hodge | 13,704 | 72.1 | +20.5 | |
| Liberal Democrat | Gary White | 2,290 | 12.0 | −2.5 | |
| Conservative | Theresa May | 1,976 | 10.4 | −23.5 | |
| National Front | Gary Needs | 551 | 2.9 | N/A | |
| UKIP | Gerard Batten | 406 | 2.1 | N/A | |
| Natural Law | H. R. Butensky | 90 | 0.5 | N/A | |
| Majority | 11,414 | 42.4 | +24.7 | ||
| Turnout | 19,017 | 38.3 | -31.7 | ||
| Registered electors | 49,635 | ||||
| Labour hold | Swing | +22.0 | |||
| Party | Candidate | Votes | % | ± | |
|---|---|---|---|---|---|
| Labour | Jo Richardson | 18,224 | 51.6 | +7.3 | |
| Conservative | John G. Kennedy | 11,956 | 33.9 | −0.6 | |
| Liberal Democrat | Stephen W. Churchman | 5,133 | 14.5 | −6.7 | |
| Majority | 6,268 | 17.7 | +7.9 | ||
| Turnout | 35,313 | 70.0 | +3.1 | ||
| Registered electors | 50,454 | ||||
| Labour hold | Swing | +3.9 | |||
Elections in the 1980s
| Party | Candidate | Votes | % | ± | |
|---|---|---|---|---|---|
| Labour | Jo Richardson | 15,307 | 44.3 | +2.2 | |
| Conservative | William Sharp | 11,898 | 34.5 | +4.1 | |
| Liberal | John Gibb | 7,366 | 21.2 | −4.4 | |
| Majority | 3,409 | 9.9 | −1.9 | ||
| Turnout | 34,541 | 66.9 | +1.4 | ||
| Registered electors | 51,639 | ||||
| Labour hold | Swing | −1.0 | |||
| Party | Candidate | Votes | % | ± | |
|---|---|---|---|---|---|
| Labour | Jo Richardson | 14,415 | 42.1 | −10.7 | |
| Conservative | Hugo Summerson | 10,389 | 30.4 | −2.0 | |
| Liberal | J. Gibb | 8,770 | 25.6 | +14.9 | |
| National Front | Ian Newport | 646 | 1.9 | −1.1 | |
| Majority | 4,026 | 11.8 | −8.7 | ||
| Turnout | 34,219 | 65.4 | −5.7 | ||
| Registered electors | 52,362 | ||||
| Labour hold | Swing | −4.4 | |||
Elections in the 1970s
| Party | Candidate | Votes | % | ± | |
|---|---|---|---|---|---|
| Labour | Jo Richardson | 18,111 | 52.8 | −11.1 | |
| Conservative | Marion Roe | 11,103 | 32.4 | +16.8 | |
| Liberal | M.F. Taylor | 3,679 | 10.7 | −4.9 | |
| National Front | Ian Newport | 1,021 | 3.0 | −1.9 | |
| Independent Labour | J Barry | 400 | 1.2 | N/A | |
| Majority | 7,008 | 20.4 | −27.9 | ||
| Turnout | 34,314 | 71.1 | +3.7 | ||
| Registered electors | 48,289 | ||||
| Labour hold | Swing | −14.0 | |||
| Party | Candidate | Votes | % | ± | |
|---|---|---|---|---|---|
| Labour | Jo Richardson | 21,546 | 63.9 | +3.8 | |
| Conservative | Eric Forth | 5,256 | 15.6 | −3.2 | |
| Liberal | M Taylor | 5,245 | 15.6 | −5.5 | |
| National Front | C. Bond | 1,661 | 4.9 | N/A | |
| Majority | 16,290 | 48.3 | +9.3 | ||
| Turnout | 33,706 | 67.4 | -9.2 | ||
| Registered electors | 50,039 | ||||
| Labour hold | Swing | +3.5 | |||
| Party | Candidate | Votes | % | ± | |
|---|---|---|---|---|---|
| Labour | Jo Richardson | 22,846 | 60.1 | −9.3 | |
| Liberal | M. Taylor | 8,012 | 21.1 | N/A | |
| Conservative | Eric Forth | 7,154 | 18.8 | -11.8 | |
| Majority | 14,834 | 39.0 | +0.2 | ||
| Turnout | 38,011 | 76.6 | +15.0 | ||
| Registered electors | 49,617 | ||||
| Labour hold | Swing | ||||
| Party | Candidate | Votes | % | ± | |
|---|---|---|---|---|---|
| Labour | Tom Driberg | 21,097 | 69.4 | +3.2 | |
| Conservative | Geoffrey Pattie | 9,309 | 30.6 | +8.8 | |
| Majority | 11,788 | 38.8 | −5.5 | ||
| Turnout | 49,363 | 61.6 | -10.4 | ||
| Registered electors | 49,363 | ||||
| Labour hold | Swing | −2.8 | |||
Elections in the 1960s
| Party | Candidate | Votes | % | ± | |
|---|---|---|---|---|---|
| Labour | Tom Driberg | 22,994 | 66.2 | +3.6 | |
| Conservative | Geoffrey Pattie | 7,584 | 21.8 | −0.8 | |
| Liberal | James T. Silvey | 4,181 | 12.0 | −2.8 | |
| Majority | 15,410 | 44.3 | +4.2 | ||
| Turnout | 48,281 | 72.0 | −1.2 | ||
| Registered electors | 48,281 | ||||
| Labour hold | Swing | +2.2 | |||
| Party | Candidate | Votes | % | ± | |
|---|---|---|---|---|---|
| Labour | Tom Driberg | 23,055 | 62.6 | +4.8 | |
| Conservative | Geoffrey C Waterer | 8,296 | 22.6 | −5.6 | |
| Liberal | Nicholas Henry Donahue | 5,463 | 14.8 | +0.9 | |
| Majority | 14,759 | 40.1 | +10.5 | ||
| Turnout | 50,326 | 73.2 | −5.3 | ||
| Registered electors | 50,326 | ||||
| Labour hold | Swing | +5.2 | |||
Elections in the 1950s
| Party | Candidate | Votes | % | ± | |
|---|---|---|---|---|---|
| Labour | Tom Driberg | 23,454 | 57.8 | -11.4 | |
| Conservative | Kenneth F Dibben | 11,454 | 28.2 | -2.6 | |
| Liberal | David E Evans | 5,648 | 13.9 | N/A | |
| Majority | 12,000 | 29.6 | -8.8 | ||
| Turnout | 51,654 | 78.5 | +4.9 | ||
| Registered electors | 51,654 | ||||
| Labour hold | Swing | -4.4 | |||
| Party | Candidate | Votes | % | ± | |
|---|---|---|---|---|---|
| Labour | Somerville Hastings | 27,129 | 69.2 | +1.8 | |
| Conservative | Bernard Massey | 12,082 | 30.8 | +5.7 | |
| Majority | 15,047 | 38.4 | -4.0 | ||
| Turnout | 53,314 | 73.6 | -8.3 | ||
| Registered electors | 53,314 | ||||
| Labour hold | Swing | -2.0 | |||
| Party | Candidate | Votes | % | ± | |
|---|---|---|---|---|---|
| Labour | Somerville Hastings | 30,486 | 67.4 | +1.1 | |
| Conservative | Michael Thomas Ben Underhill | 11,340 | 25.1 | +2.6 | |
| Liberal | Norman Henry Cork | 3,387 | 7.5 | -3.7 | |
| Majority | 19,146 | 42.4 | -1.5 | ||
| Turnout | 55,219 | 81.9 | -1.7 | ||
| Registered electors | 55,219 | ||||
| Labour hold | Swing | -0.8 | |||
| Party | Candidate | Votes | % | ± | |
|---|---|---|---|---|---|
| Labour | Somerville Hastings | 30,299 | 66.3 | -4.2 | |
| Conservative | Kenneth Edward Boulton Glenny | 10,269 | 22.5 | +6.4 | |
| Liberal | Harry Willcock | 5,109 | 11.2 | -2.2 | |
| Majority | 20,030 | 43.9 | -10.5 | ||
| Turnout | 54,627 | 83.6 | +10.8 | ||
| Registered electors | 54,627 | ||||
| Labour hold | Swing | -5.3 | |||
Elections in the 1940s
| Party | Candidate | Votes | % | ± | |
|---|---|---|---|---|---|
| Labour | Somerville Hastings | 24,504 | 70.5 | N/A | |
| Conservative | Kenneth Edward Boulton Glenny | 5,593 | 16.1 | N/A | |
| Liberal | Harry Willcock | 4,674 | 13.4 | N/A | |
| Majority | 18,911 | 54.4 | N/A | ||
| Turnout | 34,771 | 72.8 | N/A | ||
| Registered electors | 47,770 | ||||
| Labour win (new seat) | |||||
Notes and references
- Notes
- ↑ A borough constituency (for the purposes of election expenses and type of returning officer)
- ↑ As with all constituencies, the constituency elects one Member of Parliament (MP) by the first past the post system of election at least every five years.
- References
- ↑ "Usual Resident Population, 2011". Neighbourhood Statistics. Office for National Statistics. Retrieved 27 January 2015.
- ↑ "Electorate Figures – Boundary Commission for England". 2011 Electorate Figures. Boundary Commission for England. 4 March 2011. Archived from the original on November 6, 2010. Retrieved 13 March 2011.
- ↑ Barking election result (BBC News online).
- ↑ "The Battle for Barking". Channel 4. Retrieved 5 March 2011.
- ↑ List of Labour MPs elected in 2015 by % majority UK Political.info. Retrieved 2017-01-29
- ↑ "Local statistics - Office for National Statistics". neighbourhood.statistics.gov.uk.
- ↑ 2010 post-revision map Greater London and metropolitan areas of England
- ↑ Cooke, Phoebe. "Boundary review: Dagenham's Eastbrook ward could be lost to Romford".
- ↑ Leigh Rayment's Historical List of MPs – Constituencies beginning with "B" (part 1)
- ↑ "Barking parliamentary constituency". BBC News.
- ↑ organisation.email=enquires@lbbd.gov.uk, organisation name=London Borough Barking and Dagenham; (8 June 2017). "Election results for Barking, 8 June 2017".
- 1 2 "Barking parliamentary constituency - Election 2017" – via www.bbc.co.uk.
- ↑ House Of Commons Library 2017 Election report http://researchbriefings.files.parliament.uk/documents/CBP-7979/CBP-7979.pdf] House Of Commons Library 2017 Election report Check
|url=value (help). Missing or empty|title=(help) - 1 2 "Barking - UK Parliament Constituency - Election Polling". www.electionpolling.co.uk.
- ↑ "Election Data 2015". Electoral Calculus. Archived from the original on 17 October 2015. Retrieved 17 October 2015.
- ↑ https://www.lbbd.gov.uk/wp-content/uploads/2014/11/Declaration-of-results-Barking-Constituency.pdf electorate was 73,977
- ↑ "Archived copy". Archived from the original on 2014-08-11. Retrieved 2014-08-03.
- ↑ "MORE TUSC CANDIDATES IN PLACE AS ELECTION CHALLENGE GROWS". www.tusc.org.uk.
- ↑ "Election Data 2010". Electoral Calculus. Archived from the original on 26 July 2013. Retrieved 17 October 2015.
- ↑ Statement of Persons Nominated, London Borough of Barking and Dagenham
- ↑ Barking UKPolling
- ↑ "Election Data 2005". Electoral Calculus. Archived from the original on 15 October 2011. Retrieved 18 October 2015.
- ↑ "Election Data 2001". Electoral Calculus. Archived from the original on 15 October 2011. Retrieved 18 October 2015.
- ↑ "Election Data 1997". Electoral Calculus. Archived from the original on 15 October 2011. Retrieved 18 October 2015.
- ↑ "Barking [Archive]". www.politicsresources.net.
- ↑ Boothroyd, David. "Results of Byelections in the 1992-97 Parliament". United Kingdom Election Results. Retrieved 2015-10-01.
- ↑ "Election Data 1992". Electoral Calculus. Archived from the original on 15 October 2011. Retrieved 18 October 2015.
- ↑ "Politics Resources". Election 1992. Politics Resources. 9 April 1992. Retrieved 6 Dec 2010.
- ↑ "Election Data 1987". Electoral Calculus. Archived from the original on 15 October 2011. Retrieved 18 October 2015.
- ↑ "Election Data 1983". Electoral Calculus. Archived from the original on 15 October 2011. Retrieved 18 October 2015.
- ↑ "UK General Election results: October 1974 [Archive]". www.politicsresources.net.
- ↑ "UK General Election results: February 1974 [Archive]". www.politicsresources.net.
- ↑ "UK General Election results 1970 [Archive]". www.politicsresources.net.
- ↑ "UK General Election results: March 1966 [Archive]". www.politicsresources.net.
- ↑ "UK General Election results: October 1964 [Archive]". www.politicsresources.net.
- ↑
- ↑ "UK General Election results: October 1959 [Archive]". www.politicsresources.net.
- ↑
- ↑ "UK General Election results: May 1955 [Archive]". www.politicsresources.net.
- ↑
- ↑ "UK General Election results: October 1951 [Archive]". www.politicsresources.net.
- ↑
- ↑ "UK General Election results: February 1950 [Archive]". www.politicsresources.net.
- ↑
- ↑ "UK General Election results: July 1945 [Archive]". www.politicsresources.net.
External links
- Politics Resources (Election results from 1922 onwards)
- Electoral Calculus (Election results from 1955 onwards)
| Districts |  | |
|---|---|---|
| Attractions | ||
| Places of worship | ||
| Parks and open spaces | ||
| Constituencies |
| |
| Tube and rail stations | ||
| Other topics | ||