Stratford-on-Avon (UK Parliament constituency)
| Stratford-on-Avon | |
|---|---|
|
County constituency for the House of Commons | |
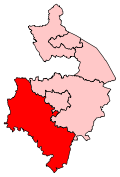 Boundary of Stratford-on-Avon in Warwickshire. | |
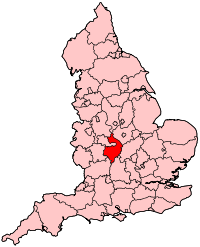 Location of Warwickshire within England. | |
| County | Warwickshire |
| Electorate | 69,108 (December 2010)[1] |
| Current constituency | |
| Created | 1950 |
| Member of parliament | Nadhim Zahawi (Conservative) |
| Number of members | One |
| Created from | Warwick and Leamington and Rugby |
| 1885–1918 | |
| Number of members | One |
| Type of constituency | County constituency |
| Replaced by | Tamworth, Rugby and Warwick & Leamington |
| Created from | South Warwickshire |
| Overlaps | |
| European Parliament constituency | West Midlands |
Stratford-on-Avon is a constituency[n 1] represented in the House of Commons of the UK Parliament since 2010 by Nadhim Zahawi, a Conservative.[n 2]
Members of Parliament
MPs 1885–1918
| Election | Member[2] | Party | |
|---|---|---|---|
| 1885 | Lord William Compton | Liberal | |
| 1886 | Frederick Townsend | Conservative | |
| 1892 | Algernon Freeman-Mitford | Conservative | |
| 1895 | Victor Milward | Conservative | |
| 1901 by-election | Philip Staveley Foster | Conservative | |
| 1906 | Thomas Kincaid-Smith | Liberal | |
| 1909 by-election | Philip Staveley Foster | Conservative | |
| 1918 | Constituency abolished | ||
MPs since 1950
| Election | Member[2] | Party | Notes | |
|---|---|---|---|---|
| 1950 | John Profumo | Conservative | Secretary of State for War 1960–63; resigned | |
| 1963 by-election | Angus Maude | Conservative | ||
| 1983 | Alan Howarth | Conservative | ||
| 1995 | Labour | |||
| 1997 | John Maples | Conservative | Previously MP for Lewisham West 1983–92 | |
| 2010 | Nadhim Zahawi | Conservative | ||
Constituency profile
The seat includes the historic town itself, as with Warwick, a major place in England for international tourism with its buildings, museums and Royal Shakespeare Company theatre, surrounded by green belt villages southeast of Birmingham, with the next largest wards being Studley and Alcester each with just under 5,000 electors.
Workless claimants, registered jobseekers, were in November 2012 significantly lower than the national average of 3.8%, at 1.4% of the population based on a statistical compilation by The Guardian.[3]
Boundaries
The constituency consists of relatively widely spaced rural villages, inhabited largely by commuters,[4] with its boundaries taking in almost all of the Stratford-on-Avon local government district.
2010-present: The District of Stratford-on-Avon wards of Alcester, Aston Cantlow, Bardon, Bidford and Salford, Brailes, Claverdon, Ettington, Henley, Kinwarton, Long Compton, Quinton, Sambourne, Shipston, Snitterfield, Stratford Alveston, Stratford Avenue and New Town, Stratford Guild and Hathaway, Stratford Mount Pleasant, Studley, Tanworth, Tredington, Vale of the Red Horse, and Welford.
1997-2010: All the wards of the District of Stratford-on-Avon except the wards of Henley, Tanworth, and Tanworth Earlswood.
1983-1997: The District of Stratford-on-Avon.
1974-1983: As 1950 but with redrawn boundaries.
1950-1974: The Municipal Borough of Stratford-upon-Avon, and the Rural Districts of Alcester, Shipston-on-Stour, Southam, and Stratford-on-Avon.
1885-1918: The Municipal Boroughs of Leamington, Stratford-upon-Avon, and Warwick, the Sessional Divisions of Alcester, Brailes, Henley, Stratford, Snitterfield, and Warwick, and the part of the Sessional Division of Kenilworth in the Parliamentary Borough of Warwick and Leamington.
At the 2010 general election, following the Fifth Periodic Review of Westminster constituencies, this seat was reduced in size: a new constituency of Kenilworth and Southam was created, taking in much of the eastern half of the previous version of this constituency, along with parts of the abolished seat of Rugby and Kenilworth.
History
Since its recreation in 1950, the seat has elected only Conservatives. The earliest member, John Profumo, was noted for his personal life scandal; another MP, Alan Howarth, served on the benches of the Labour Party for two years, choosing to cross the floor.
- Political history
With the exception of a close 1963 by-election, the constituency has always returned substantial majorities for the Conservatives. The Liberal/Liberal Democratic parties came second in every election between 1974 and 2010. After a brief increase in the UKIP vote in 2015, Labour is now in clear second place in the constituency following the 2017 General Election. No other parties have broken the keep-deposit threshold of 5% of the vote.
Elections
Elections in the 2010s
]]
| Party | Candidate | Votes | % | ± | |
|---|---|---|---|---|---|
| Conservative | Nadhim Zahawi | 32,657 | 62.2 | ||
| Labour | Jeff Kenner | 11,699 | 22.3 | ||
| Liberal Democrat | Elizabeth Adams | 6,357 | 12.1 | ||
| Green | Dominic Giles | 1,345 | 2.6 | ||
| Independent | Jandy Spurway | 255 | 0.5 | ||
| Independent | Tom Darwood | 219 | 0.4 | ||
| Majority | 20,958 | 39.9 | |||
| Turnout | 52,532 | 72.3 | |||
| Registered electors | |||||
| Conservative hold | Swing | -2.4 | |||
| Party | Candidate | Votes | % | ± | |
|---|---|---|---|---|---|
| Conservative | Nadhim Zahawi | 29,674 | 57.7 | ||
| UKIP | Edward Fila | 6,798 | 13.2 | ||
| Labour | Jeff Kenner | 6,677 | 13.0 | ||
| Liberal Democrat | Elizabeth Adams | 6,182 | 12.0 | ||
| Green | Dominic Giles | 2,128 | 4.1 | ||
| Majority | 22,876 | 44.5 | |||
| Turnout | 51,459 | 72.6 | |||
| Conservative hold | Swing | ||||
| Party | Candidate | Votes | % | ± | |
|---|---|---|---|---|---|
| Conservative | Nadhim Zahawi | 26,052 | 51.5 | ||
| Liberal Democrat | Martin Turner | 14,706 | 29.1 | ||
| Labour | Robert Johnston | 4,809 | 9.5 | ||
| UKIP | Brett Parsons | 1,846 | 3.7 | ||
| BNP | George Jones | 1,097 | 2.2 | N/A | |
| Independent | Neil Basnett | 1,032 | 2.0 | N/A | |
| Green | Karen Varga | 527 | 1.0 | ||
| English Democrat | Frederick Bishop | 473 | 0.9 | N/A | |
| Majority | 11,346 | 22.4 | |||
| Turnout | 50,542 | 72.7 | |||
| Conservative hold | Swing | ||||
Elections in the 2000s
| Party | Candidate | Votes | % | ± | |
|---|---|---|---|---|---|
| Conservative | John Maples | 28,652 | 49.2 | ||
| Liberal Democrat | Susan Juned | 16,468 | 28.3 | ||
| Labour | Rachel Blackmore | 10,145 | 17.4 | ||
| UKIP | Harry Cottam | 1,621 | 2.8 | ||
| Green | Mick Davies | 1,354 | 2.3 | ||
| Majority | 12,184 | 20.9 | |||
| Turnout | 58,240 | 68.8 | |||
| Conservative hold | Swing | ||||
| Party | Candidate | Votes | % | ± | |
|---|---|---|---|---|---|
| Conservative | John Maples | 27,606 | 50.3 | ||
| Liberal Democrat | Susan Juned | 15,804 | 28.8 | ||
| Labour | Mushtaq Hussain | 9,164 | 16.7 | ||
| UKIP | Ron A Mole | 1,184 | 2.2 | ||
| Green | Mick Davies | 1,156 | 2.1 | N/A | |
| Majority | 11,802 | 21.5 | |||
| Turnout | 54,914 | 64.4 | |||
| Conservative hold | Swing | ||||
Elections in the 1990s
| Party | Candidate | Votes | % | ± | |
|---|---|---|---|---|---|
| Conservative | John Maples | 29,967 | 48.3 | ||
| Liberal Democrat | Susan Juned | 15,861 | 25.5 | ||
| Labour | Stewart Stacey | 12,754 | 20.5 | ||
| Referendum | Adrian K Hilton | 2,064 | 3.3 | N/A | |
| UKIP | JEM Spilsbury | 556 | 0.9 | N/A | |
| Natural Law | James Brewster | 307 | 0.5 | ||
| Stratford First Democratic Conservative | Simon G Marcus | 306 | 0.5 | N/A | |
| ProLife Alliance | Sarah A Miller | 284 | 0.5 | N/A | |
| Majority | 14,106 | 22.8 | |||
| Turnout | 62,099 | 76.3 | |||
| Conservative hold | Swing | ||||
| Party | Candidate | Votes | % | ± | |
|---|---|---|---|---|---|
| Conservative | Alan Howarth | 40,251 | 59.2 | ||
| Liberal Democrat | JN Fogg | 17,359 | 25.5 | ||
| Labour | SM Brookes | 8,932 | 13.1 | ||
| Green | RG Roughan | 729 | 1.1 | N/A | |
| Ind. Conservative | AJ Saunders | 573 | 0.8 | N/A | |
| Natural Law | MR Twite | 130 | 0.2 | N/A | |
| Majority | 22,892 | 33.7 | |||
| Turnout | 67,974 | 82.1 | |||
| Conservative hold | Swing | ||||
Elections in the 1980s
| Party | Candidate | Votes | % | ± | |
|---|---|---|---|---|---|
| Conservative | Alan Howarth | 38,483 | 61.93 | ||
| Liberal | David Cowcher | 17,318 | 27.87 | ||
| Labour | Robert Rhodes | 6,335 | 10.20 | ||
| Majority | 21,165 | 34.06 | |||
| Turnout | 62,136 | 76.46 | |||
| Conservative hold | Swing | ||||
| Party | Candidate | Votes | % | ± | |
|---|---|---|---|---|---|
| Conservative | Alan Howarth | 34,041 | 60.90 | ||
| Liberal | WJB Taylor | 16,124 | 28.85 | ||
| Labour | Frank Hooley | 5,731 | 10.25 | ||
| Majority | 17,917 | 32.05 | |||
| Turnout | 55,896 | 72.92 | |||
| Conservative hold | Swing | ||||
Elections in the 1970s
| Party | Candidate | Votes | % | ± | |
|---|---|---|---|---|---|
| Conservative | Angus Maude | 35,470 | 60.41 | ||
| Liberal | J Taylor | 12,916 | 22.00 | ||
| Labour | CA Purnell | 10,334 | 17.60 | ||
| Majority | 22,554 | 38.41 | |||
| Turnout | 58,720 | 76.67 | |||
| Conservative hold | Swing | ||||
| Party | Candidate | Votes | % | ± | |
|---|---|---|---|---|---|
| Conservative | Angus Maude | 27,123 | 50.96 | ||
| Liberal | MJW Wright | 14,555 | 27.34 | ||
| Labour | DV Hunt | 11,551 | 21.70 | ||
| Majority | 12,568 | 23.61 | |||
| Turnout | 53,229 | 74.04 | |||
| Conservative hold | Swing | ||||
| Party | Candidate | Votes | % | ± | |
|---|---|---|---|---|---|
| Conservative | Angus Maude | 30,106 | 51.77 | ||
| Liberal | MJW Wright | 16,885 | 29.03 | ||
| Labour | M Burton | 11,165 | 19.20 | ||
| Majority | 13,221 | 22.73 | |||
| Turnout | 58,156 | 81.06 | |||
| Conservative hold | Swing | ||||
| Party | Candidate | Votes | % | ± | |
|---|---|---|---|---|---|
| Conservative | Angus Maude | 28,106 | 58.08 | ||
| Labour | Peter Eric Tombs | 11,393 | 23.54 | ||
| Liberal | David R Bruce | 8,895 | 18.38 | ||
| Majority | 16,713 | 34.54 | |||
| Turnout | 48,394 | 74.08 | |||
| Conservative hold | Swing | ||||
Elections in the 1960s
| Party | Candidate | Votes | % | ± | |
|---|---|---|---|---|---|
| Conservative | Angus Maude | 22,381 | 51.30 | ||
| Labour | Vernon G Hale | 12,954 | 29.69 | ||
| Liberal | Gordon H Herringshaw | 6,556 | 15.03 | ||
| Ind. Conservative | Christopher G Clayton-Wright | 1,733 | 3.97 | N/A | |
| Majority | 9,427 | 21.61 | |||
| Turnout | 43,624 | 78.03 | |||
| Conservative hold | Swing | ||||
| Party | Candidate | Votes | % | ± | |
|---|---|---|---|---|---|
| Conservative | Angus Maude | 23,236 | 53.80 | ||
| Labour | Andrew Faulds | 12,646 | 29.28 | ||
| Liberal | Derick Mirfin | 7,307 | 16.92 | N/A | |
| Majority | 10,590 | 24.52 | |||
| Turnout | 43,189 | 83.07 | |||
| Conservative hold | Swing | ||||
| Party | Candidate | Votes | % | ± | |
|---|---|---|---|---|---|
| Conservative | Angus Maude | 15,846 | 43.61 | ||
| Labour | Andrew Faulds | 12,376 | 34.06 | ||
| Liberal | Derick Mirfin | 7,622 | 20.98 | N/A | |
| Independent | MS Blair | 281 | 0.77 | N/A | |
| Teenage Party | David Sutch | 209 | 0.58 | N/A | |
| Majority | 3,470 | 9.55 | |||
| Turnout | 36,334 | ||||
| Conservative hold | Swing | ||||
Elections in the 1950s
| Party | Candidate | Votes | % | ± | |
|---|---|---|---|---|---|
| Conservative | John Profumo | 26,146 | 68.5 | ||
| Labour | Joseph Stretton | 12,017 | 31.5 | ||
| Majority | 14,129 | 37.0 | |||
| Turnout | 38,163 | 76.9 | |||
| Conservative hold | Swing | ||||
| Party | Candidate | Votes | % | ± | |
|---|---|---|---|---|---|
| Conservative | John Profumo | 24,587 | 68.6 | ||
| Labour | Thomas LK Locksley | 11,275 | 31.4 | ||
| Majority | 13,312 | 37.1 | |||
| Turnout | 35,862 | 75.6 | |||
| Conservative hold | Swing | ||||
| Party | Candidate | Votes | % | ± | |
|---|---|---|---|---|---|
| Conservative | John Profumo | 24,041 | 64.5 | ||
| Labour | Henry Hilditch | 13,246 | 35.5 | ||
| Majority | 10,795 | 29.0 | |||
| Turnout | 37,287 | 79.9 | |||
| Conservative hold | Swing | ||||
| Party | Candidate | Votes | % | ± | |
|---|---|---|---|---|---|
| Conservative | John Profumo | 21,492 | 57.3 | N/A | |
| Labour | RGM Brown | 12,143 | 32.0 | N/A | |
| Liberal | Hadleigh Sydney Seaborne | 4,318 | 11.4 | N/A | |
| Majority | 9,349 | 24.6 | N/A | ||
| Turnout | 37,953 | 83.1 | N/A | ||
| Conservative win (new seat) | |||||
Election results 1885-1918
Elections in the 1910s
General Election 1914/15:
Another General Election was required to take place before the end of 1915. The political parties had been making preparations for an election to take place and by the July 1914, the following candidates had been selected;
- Unionist: Philip Foster
- Liberal: John Pascoe Elsden[20]
| Party | Candidate | Votes | % | ± | |
|---|---|---|---|---|---|
| Conservative | Philip Foster | 5,147 | 59.8 | ||
| Liberal | Walter King | 3,462 | 40.2 | ||
| Majority | 1,685 | 19.6 | |||
| Turnout | 8,609 | 79.5 | |||
| Registered electors | 10,835 | ||||
| Conservative hold | Swing | ||||
| Party | Candidate | Votes | % | ± | |
|---|---|---|---|---|---|
| Conservative | Philip Foster | 5,505 | 58.9 | ||
| Liberal | Oscar William Bowen | 3,838 | 41.1 | ||
| Majority | 1,667 | 17.8 | N/A | ||
| Turnout | 9,343 | 86.2 | |||
| Registered electors | 10,835 | ||||
| Conservative gain from Liberal | Swing | ||||
Elections in the 1900s
| Party | Candidate | Votes | % | ± | |
|---|---|---|---|---|---|
| Conservative | Philip Foster | 5,374 | 62.5 | ||
| Liberal | Joseph Martin | 2,747 | 31.9 | ||
| Independent | Thomas Kincaid-Smith | 479 | 5.6 | N/A | |
| Majority | 2,627 | 30.6 | N/A | ||
| Turnout | 8,600 | 80.9 | |||
| Registered electors | 10,628 | ||||
| Conservative hold | Swing | ||||
| Party | Candidate | Votes | % | ± | |
|---|---|---|---|---|---|
| Liberal | Thomas Kincaid-Smith | 4,321 | 50.9 | N/A | |
| Conservative | Philip Foster | 4,173 | 49.1 | N/A | |
| Majority | 148 | 1.8 | N/A | ||
| Turnout | 8,494 | 83.5 | N/A | ||
| Registered electors | 10,173 | ||||
| Liberal gain from Conservative | Swing | N/A | |||
| Party | Candidate | Votes | % | ± | |
|---|---|---|---|---|---|
| Conservative | Philip Foster | 4,755 | 61.5 | N/A | |
| Liberal | Bolton King | 2,977 | 38.5 | N/A | |
| Majority | 1,778 | 23.0 | N/A | ||
| Turnout | 7,732 | 76.8 | N/A | ||
| Registered electors | 10,063 | ||||
| Conservative hold | Swing | N/A | |||
| Party | Candidate | Votes | % | ± | |
|---|---|---|---|---|---|
| Conservative | Victor Milward | Unopposed | |||
| Conservative hold | |||||
Elections in the 1890s
| Party | Candidate | Votes | % | ± | |
|---|---|---|---|---|---|
| Conservative | Victor Milward | 4,598 | 61.9 | +6.1 | |
| Liberal | Isaac Thomas Sadler | 2,827 | 38.1 | −6.1 | |
| Majority | 1,771 | 23.8 | +12.2 | ||
| Turnout | 7,425 | 76.2 | −2.2 | ||
| Registered electors | 9,745 | ||||
| Conservative hold | Swing | +6.1 | |||
| Party | Candidate | Votes | % | ± | |
|---|---|---|---|---|---|
| Conservative | Algernon Freeman-Mitford | 4,157 | 55.8 | +2.4 | |
| Liberal | George Septimus Warmington[25] | 3,293 | 44.2 | −2.4 | |
| Majority | 864 | 11.6 | +4.8 | ||
| Turnout | 7,450 | 78.4 | +3.9 | ||
| Registered electors | 9,505 | ||||
| Conservative hold | Swing | +2.4 | |||
Elections in the 1880s
| Party | Candidate | Votes | % | ± | |
|---|---|---|---|---|---|
| Conservative | Frederick Townsend | 3,833 | 53.4 | ||
| Liberal | William Compton | 3,344 | 46.6 | ||
| Majority | 489 | 6.8 | N/A | ||
| Turnout | 7,177 | 74.5 | |||
| Registered electors | 9,631 | ||||
| Conservative gain from Liberal | Swing | ||||
| Party | Candidate | Votes | % | ± | |
|---|---|---|---|---|---|
| Liberal | William Compton | 4,639 | 55.4 | N/A | |
| Conservative | Sampson Lloyd | 3,738 | 44.6 | N/A | |
| Majority | 901 | 10.8 | N/A | ||
| Turnout | 8,377 | 87.0 | N/A | ||
| Registered electors | 9,631 | ||||
| Liberal win (new seat) | |||||
See also
Notes and references
- Notes
- ↑ A county constituency (for the purposes of election expenses and type of returning officer)
- ↑ As with all constituencies, the constituency elects one Member of Parliament (MP) by the first past the post system of election at least every five years.
- References
- ↑ "Electorate Figures - Boundary Commission for England". 2011 Electorate Figures. Boundary Commission for England. 4 March 2011. Archived from the original on 6 November 2010. Retrieved 13 March 2011.
- 1 2 Leigh Rayment's Historical List of MPs – Constituencies beginning with "S" (part 5)
- ↑ Unemployment claimants by constituency The Guardian
- ↑ "Local statistics - Office for National Statistics". neighbourhood.statistics.gov.uk.
- ↑ "Candidates confirmed for General Election". Stratford-upon-Avon Herald. 11 May 2017. Retrieved 12 May 2017.
- ↑ "Election Data 2015". Electoral Calculus. Archived from the original on 17 October 2015. Retrieved 17 October 2015.
- ↑ "Election Data 2010". Electoral Calculus. Archived from the original on 26 July 2013. Retrieved 17 October 2015.
- ↑ "UK > England > West Midlands > Stratford-on-Avon". Election 2010. BBC. 7 May 2010. Retrieved 12 May 2010.
- ↑ "Election Data 2005". Electoral Calculus. Archived from the original on 15 October 2011. Retrieved 18 October 2015.
- 1 2 3 "News > Politics > Constituency > Stratford-on-Avon". Elections. The Guardian. 7 May 2010. Retrieved 6 March 2011.
- ↑ "Election Data 2001". Electoral Calculus. Archived from the original on 15 October 2011. Retrieved 18 October 2015.
- ↑ "Election Data 1997". Electoral Calculus. Archived from the original on 15 October 2011. Retrieved 18 October 2015.
- ↑ "Election Data 1992". Electoral Calculus. Archived from the original on 15 October 2011. Retrieved 18 October 2015.
- ↑ "UK General Election results April 1992". Richard Kimber's Political Science Resources. Politics Resources. 9 April 1992. Retrieved 2010-12-06.
- ↑ "Election Data 1987". Electoral Calculus. Archived from the original on 15 October 2011. Retrieved 18 October 2015.
- ↑ "Election Data 1983". Electoral Calculus. Archived from the original on 15 October 2011. Retrieved 18 October 2015.
- ↑
- ↑
- ↑
- ↑ Leamington Spa Courier 14 Nov 1913
- 1 2 3 4 5 6 7 8 9 Craig, F. W. S., ed. (1974). British Parliamentary Election Results: 1885-1918. London: Macmillan Press. p. 410. ISBN 9781349022984.
- 1 2 Debrett's House of Commons & Judicial Bench, 1916
- 1 2 3 4 5 6 The Liberal Year Book, 1907
- 1 2 Debrett's House of Commons & Judicial Bench, 1901
- ↑ Kentish Mail, Greenwich and Deptford Observer. 7 Aug 1908 https://newspaperarchive.com/kentish-mail-greenwich-and-deptford-observer-aug-07-1908-p-5/. Retrieved 20 November 2017. Missing or empty
|title=(help) - ↑ Debrett's House of Commons & Judicial Bench, 1886