Clwyd West (UK Parliament constituency)
| Clwyd West | |
|---|---|
|
County constituency for the House of Commons | |
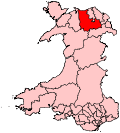 Boundary of Clwyd West in Wales. | |
| Preserved county | Clwyd |
| Electorate | 58,544 (December 2010)[1] |
| Major settlements | Abergele, Colwyn Bay, Ruthin |
| Current constituency | |
| Created | 1997 |
| Member of parliament | David Jones (Conservative) |
| Number of members | One |
| Created from | Clwyd South West and Clwyd North West |
| Overlaps | |
| Welsh Assembly | North Wales |
| European Parliament constituency | Wales |
Clwyd West (Gorllewin Clwyd in Welsh) is a constituency of the House of Commons of the Parliament of the United Kingdom (at Westminster). It elects one Member of Parliament (MP) by the first past the post method of election. The current MP is David Jones of the Conservative Party, first elected at the 2005 general election and who also served as Secretary of State for Wales from 4 September 2012 until 14 July 2014.
Boundaries
Following the Fifth Periodic Review of Westminster constituencies, as confirmed by 'The Parliamentary Constituencies and Assembly Electoral Regions (Wales) Order 2006',[2] the boundaries of Clwyd West is formed from the following electoral wards;
- From Conwy County Borough: Abergele Pensarn, Betws yn Rhos, Colwyn, Eirias, Gele, Glyn, Kinmel Bay, Llanddulas, Llandrillo yn Rhos, Llanfair Talhaiarn, Llangernyw, Llansannan, Llysfaen, Mochdre, Pentre Mawr, Rhiw, Towyn, Uwchaled
- From Denbighshire County: Efenechtyd, Llanarmon-yn-Ial/Llandegla, Llanbedr Dyffryn Clwyd/Llangynhafal, Llanfair Dyffryn Clwyd/Gwyddelwern, Llanrhaeadr-yng-Nghinmeirch, Ruthin.
History
The constituency was created in 1997 from parts of the seats of Clwyd South West and Clwyd North West. In the 2005 election this constituency was the Conservative Party's twentieth target. The area has generally voted for Conservative candidates, though it was won by Labour in their 1997 and 2001 landslides.
Members of Parliament
| Election | Member[3] | Party | |
|---|---|---|---|
| 1997 | Gareth Thomas | Labour | |
| 2005 | David Jones | Conservative | |
Elections
Elections in the 2010s
| Party | Candidate | Votes | % | ± | |
|---|---|---|---|---|---|
| Conservative | David Jones | 19,541 | 48.1 | +4.8 | |
| Labour | Gareth Thomas | 16,104 | 39.6 | +14.0 | |
| Plaid Cymru | Dilwyn Roberts | 3,918 | 9.6 | -2.6 | |
| Liberal Democrats | Victor Babu | 1,091 | 2.7 | -1.0 | |
| Majority | 3,437 | 8.5 | -9.2 | ||
| Turnout | 40,354 | 69.8 | +5.0 | ||
| Registered electors | 58,263 | ||||
| Conservative hold | Swing | -4.6 | |||
| Party | Candidate | Votes | % | ± | |
|---|---|---|---|---|---|
| Conservative | David Jones | 16,463 | 43.3 | +1.7 | |
| Labour | Gareth Thomas | 9,733 | 25.6 | +0.9 | |
| UKIP | Warwick Nicholson | 4,988 | 13.1 | +10.8 | |
| Plaid Cymru | Marc Jones | 4,651 | 12.2 | -3.2 | |
| Liberal Democrat | Sarah Lesiter-Burgess | 1,387 | 3.6 | -11.6 | |
| Socialist Labour | Bob English | 612 | 1.6 | N/A | |
| Above and Beyond | Rory Jepson | 194 | 0.5 | N/A | |
| Majority | 6,730 | 17.7 | +0.9 | ||
| Turnout | 38,028 | 64.8 | -1.0 | ||
| Registered electors | 58,644 | ||||
| Conservative hold | Swing | +0.4 | |||
| Party | Candidate | Votes | % | ± | |
|---|---|---|---|---|---|
| Conservative | David Jones | 15,833 | 41.5 | +5.4 | |
| Labour | Donna Hutton | 9,414 | 24.7 | -11.3 | |
| Plaid Cymru | Llŷr Huws Gruffydd | 5,864 | 15.4 | +4.5 | |
| Liberal Democrat | Michele Jones | 5,801 | 15.2 | +1.9 | |
| UKIP | Warwick Nicholson | 864 | 2.3 | +0.8 | |
| Christian | Rev Griffiths | 239 | 0.6 | N/A | |
| Independent | Joe Blakesley | 96 | 0.3 | N/A | |
| Majority | 6,419 | 16.8 | +16.4 | ||
| Turnout | 38,111 | 65.8 | +0.7 | ||
| Registered electors | 57,913 | ||||
| Conservative hold | Swing | +8.4 | |||
Elections in the 2000s
| Party | Candidate | Votes | % | ± | |
|---|---|---|---|---|---|
| Conservative | David Jones | 12,909 | 36.2 | +0.6 | |
| Labour | Gareth Thomas | 12,776 | 35.9 | -2.9 | |
| Liberal Democrat | Frank Taylor | 4,723 | 13.3 | +1.9 | |
| Plaid Cymru | Eilian Williams | 3,874 | 10.9 | -2.0 | |
| UKIP | Warwick Nicholson | 512 | 1.4 | +0.0 | |
| Independent | Jimmy James | 507 | 1.4 | +1.4 | |
| Socialist Labour | Patrick Keenan | 313 | 0.9 | +0.9 | |
| Majority | 133 | 0.4 | N/A | ||
| Turnout | 35,614 | 62.6 | -1.5 | ||
| Registered electors | 55,642 | ||||
| Conservative gain from Labour | Swing | +1.8 | |||
| Party | Candidate | Votes | % | ± | |
|---|---|---|---|---|---|
| Labour | Gareth Thomas | 13,426 | 38.8 | +1.7 | |
| Conservative | Jimmy James | 12,311 | 35.6 | +3.1 | |
| Plaid Cymru | Elfed Williams | 4,453 | 12.9 | -0.6 | |
| Liberal Democrat | Robina L. Feeley | 3,934 | 11.4 | -1.4 | |
| UKIP | Matthew Guest | 476 | 1.4 | N/A | |
| Majority | 1,115 | 3.2 | -1.4 | ||
| Turnout | 34,600 | 64.1 | -11.2 | ||
| Registered electors | 53,962 | ||||
| Labour hold | Swing | -0.7 | |||
Elections in the 1990s
| Party | Candidate | Votes | % | ± | |
|---|---|---|---|---|---|
| Labour | Gareth Thomas | 14,918 | 37.1 | N/A | |
| Conservative | Rod Richards | 13,070 | 32.5 | N/A | |
| Plaid Cymru | Eryl W. Williams | 5,421 | 13.5 | N/A | |
| Liberal Democrat | Gwyn Williams | 5,151 | 12.8 | N/A | |
| Referendum | Heather Bennett-Collins | 1,114 | 2.8 | N/A | |
| Conservatory | David K. Neal | 583 | 1.4 | N/A | |
| Majority | 1,848 | 4.6 | N/A | ||
| Turnout | 40,257 | 75.3 | N/A | ||
| Registered electors | 53,467 | ||||
| Labour win (new seat) | |||||
See also
Notes and references
- ↑ "Beyond 20/20 WDS - Table view". 2011 Electorate Figures. StatsWales. 1 December 2010. Retrieved 13 March 2011.
- ↑ http://www.legislation.gov.uk/uksi/2006/1041/pdfs/uksi_20061041_en.pdf
- ↑ Leigh Rayment's Historical List of MPs – Constituencies beginning with "C" (part 5)
- ↑ "North Wales Daily Post". Retrieved 30 April 2017.
- ↑ "BBC News". Retrieved 28 April 2017.
- ↑ "Statement of Persons Nominated" (PDF). Retrieved 11 May 2017.
- ↑ "BBC News Election Results". Retrieved 9 June 2017.
- ↑ "Election Data 2015". Electoral Calculus. Archived from the original on 17 October 2015. Retrieved 17 October 2015.
- ↑ "Clwyd West result" (PDF). DECLARATION OF RESULT OF POLL. Conwy County Borough Council. Retrieved 21 September 2015.
- ↑ "Election Data 2010". Electoral Calculus. Archived from the original on 26 July 2013. Retrieved 17 October 2015.
- ↑ Clwyd West Archived 2011-06-12 at the Wayback Machine., Cyngor Conwy Council - candidates Clwyd West
- ↑ Clwyd West BBC Election - Clwyd West
- ↑ "Election Data 2005". Electoral Calculus. Archived from the original on 15 October 2011. Retrieved 18 October 2015.
- ↑ "Election Data 2001". Electoral Calculus. Archived from the original on 15 October 2011. Retrieved 18 October 2015.
- ↑ "Election Data 1997". Electoral Calculus. Archived from the original on 15 October 2011. Retrieved 18 October 2015.
External links
- Official declaration of result of the poll (2005) (in PDF)
- Politics Resources (Election results from 1922 onwards)
- Electoral Calculus (Election results from 1955 onwards)
- 2017 Election House Of Commons Library 2017 Election report
- A Vision Of Britain Through Time (Constituency elector numbers)