City of Lancaster
.jpg)

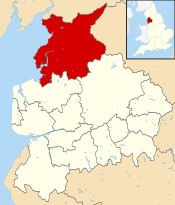
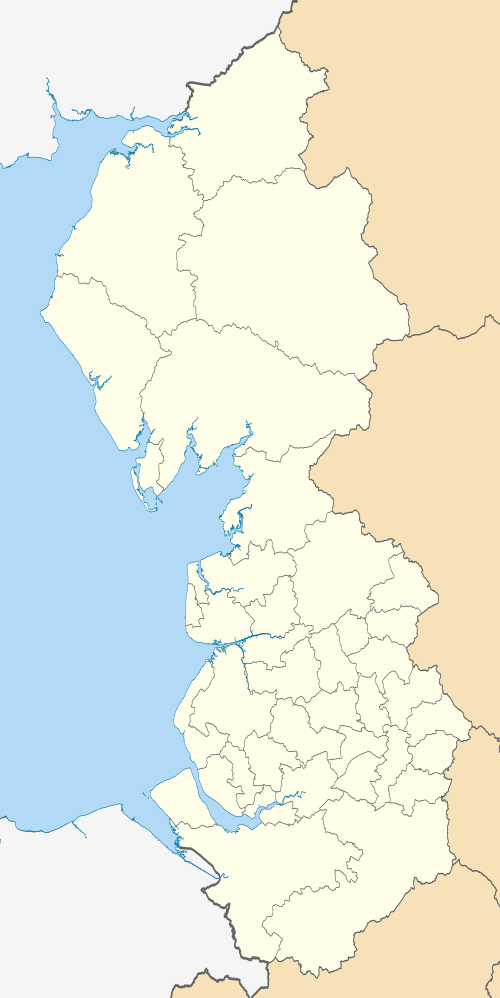
The City of Lancaster (/ˈlæŋkæstər/[1]) is a local government district of Lancashire, England, with the status of a city and non-metropolitan district. It is named after its largest settlement, Lancaster, but covers a far larger area, which includes the towns of Morecambe, Heysham, and Carnforth, as well as outlying villages, farms, rural hinterland and (since 1 August 2016) a section of the Yorkshire Dales National Park.[2] The district has a population of 142,500 (mid-2017 est.),[3] and an area of 222.5 square miles (576.2 km2).[4]
The current city boundaries were set as part of the provisions of the Local Government Act 1972, and cover an amalgamation of five former local government districts—the municipal boroughs of Lancaster and Morecambe and Heysham, together with the Carnforth Urban District and rural districts of Lancaster and Lunesdale, all from the administrative county of Lancashire.
History
Government
The higher tier of local government is Lancashire County Council. At a lower level, there are many parish councils:[5] See this list of civil parishes in the district.
The district comprises two parliamentary constituencies: Lancaster and Fleetwood, and Morecambe and Lunesdale.[6] In the 2010 General Election both seats were won by the Conservatives. In 2015, Lancaster and Fleetwood was gained by Labour, whilst Morecambe and Lunesdale was retained by the Conservatives.
Following a by-election in May 2018, the council stood under Labour control:[7][8]
- Labour Party – 31
- Conservative Party – 18
- Green Party – 7
- Morecambe Bay Independent – 2
- Free Independent – 2
Elections for all council seats are held every four years. There were elections in 2007,[9] 2011[10] and 2015.[11]
Demography
| Lancaster compared | ||||
|---|---|---|---|---|
| 2001 UK Census | Lancaster[12] | Lancashire[13] | England | United Kingdom |
| Total population | 133,914 | 1,134,974 | 49,138,831 | 58,789,194 |
| White | 97.8% | 94.7% | 90.9% | 92.14% |
| Asian | 0.7% | 4.1% | 4.6% | 3.4% |
| Black | 0.2% | 0.2% | 2.3% | 2% |
At the 2011 UK census, the City of Lancaster had a total population of 138,375.[14] Of the 57,822 households in the city, 33.5% were married couples living together, 31.9% were one-person households, 7.8% were co-habiting couples and 10.0% were lone parents. These figures were similar to the national averages.[15]
The population density was 233/km2 (600/sq mi)[16] and for every 100 females, there were 91.8 males. Of those aged 16–74 in Lancaster, 26.7% had no academic qualifications, lower than 28.9% in all of England. The city of Lancaster had a higher proportion of white people than Lancashire and England.[14]
Population change
The table below details the population change since 1801, including the percentage change since the last available census data. Although the City of Lancaster has existed as a district since 1974, figures have been generated by combining data from the towns, villages, and civil parishes that would later be constituent parts of the city.
| Population growth in City of Lancaster since 1801 | |||||||||||||||||||||||||||||||||||||||||||||||||||||||||||||||||||||||||||||
|---|---|---|---|---|---|---|---|---|---|---|---|---|---|---|---|---|---|---|---|---|---|---|---|---|---|---|---|---|---|---|---|---|---|---|---|---|---|---|---|---|---|---|---|---|---|---|---|---|---|---|---|---|---|---|---|---|---|---|---|---|---|---|---|---|---|---|---|---|---|---|---|---|---|---|---|---|---|
|
|
| |||||||||||||||||||||||||||||||||||||||||||||||||||||||||||||||||||||||||||
| Source: Vision of Britain[17] | |||||||||||||||||||||||||||||||||||||||||||||||||||||||||||||||||||||||||||||
Religion
| Lancaster compared | |||
|---|---|---|---|
| 2011 UK Census | City of Lancaster[14] | Lancashire[18] | England |
| Population | 138,375 | 1,134,974 | 49,138,831 |
| Christian | 65.9% | 68.8% | 59.4% |
| Muslim | 1.3% | 4.8% | 5.0% |
| No religion | 24.5% | 19.2% | 24.7% |
At the 2011 UK census, 65.9% of Lancaster's population reported themselves as Christian, 1.3% Muslim, 0.4% Buddhist, 0.3% Hindu, 0.1% Jewish, and 0.1% Sikh. 24.5% had no religion, 0.5% had an alternative religion and 7.1% did not state their religion.[14] The city is covered by the Roman Catholic Diocese of Lancaster,[19] and the Church of England Diocese of Blackburn.[20]
Economy
| City of Lancaster compared | |||
|---|---|---|---|
| 2001 UK Census | City of Lancaster[21] | Lancashire[22] | England |
| Population of working age | 97,365 | 814,434 | 35,532,091 |
| Full-time employment | 33.5% | 39.2% | 40.8% |
| Part-time employment | 12.7% | 12.2% | 11.8% |
| Self employed | 7.8% | 8.2% | 8.3% |
| Unemployed | 3.6% | 2.9% | 3.3% |
| Retired | 14.9% | 15.0% | 13.5% |
At the United Kingdom Census 2001, the City of Lancaster had 97,365 residents aged 16 to 74. Of these people, 4.0% were students with jobs, 9.6% students without jobs, 5.1% looking after home or family, 6.0% permanently sick or disabled and 2.8% economically inactive for other reasons.[21]
In 2001, of the 55,906 residents of the City of Lancaster in employment, the industry of employment was 16.7% retail and wholesale, 14.2% health and social work, 11.4% education, 11.2% manufacturing, 7.8% property and business services, 6.7% construction, 6.7% hotels and restaurants, 6.5% transport and communications, 5.7% public administration and defence, 2.5% finance, 2.4% energy and water supply, 2.2% agriculture, 0.4% mining, and 5.3% other. This was roughly in line with national figures, although the proportion of jobs in agriculture which was more than the national average of 1.5% and the percentage of people working in finance was below the national average of 4.8%; the proportion of people working in property was well below the national average of 13.2%.[23]
Settlements
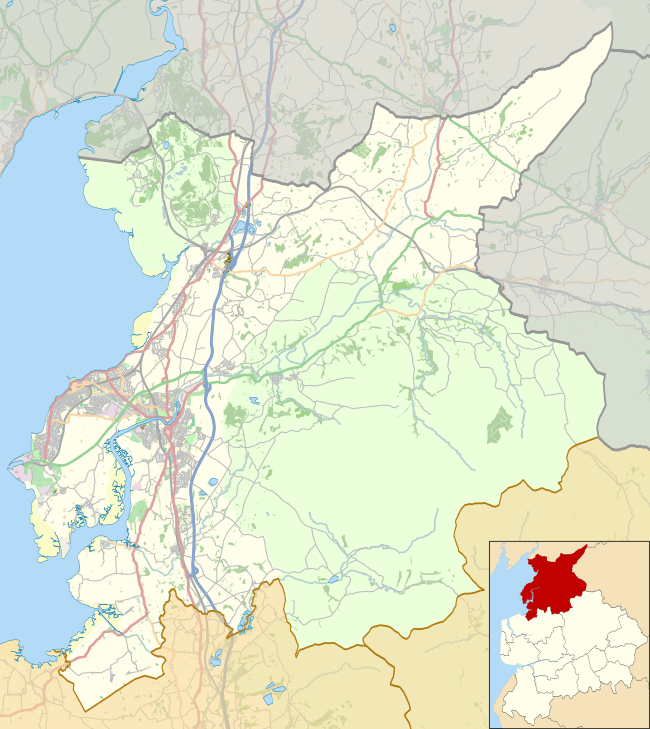
Civil parishes
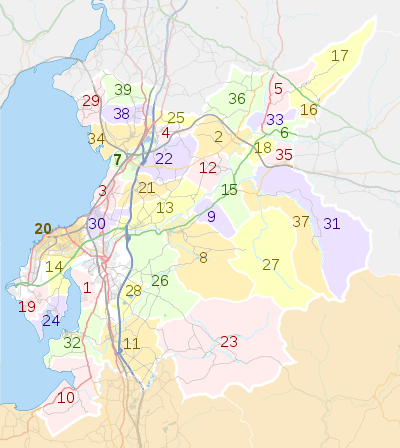
- Aldcliffe-with-Stodday
- Arkholme-with-Cawood
- Bolton-le-Sands
- Borwick
- Burrow-with-Burrow
- Cantsfield
- Carnforth
- Caton-with-Littledale
- Claughton
- Cockerham
- Ellel
- Gressingham
- Halton-with-Aughton
- Heaton-with-Oxcliffe
- Hornby-with-Farleton
- Ireby
- Leck
- Melling-with-Wrayton
- Middleton
- Morecambe
- Nether Kellet
- Over Kellet
- Over Wyresdale
- Overton
- Priest Hutton
- Quernmore
- Roeburndale
- Scotforth
- Silverdale
- Slyne-with-Hest
- Tatham
- Thurnham
- Tunstall
- Warton
- Wennington
- Whittington
- Wray-with-Botton
- Yealand Conyers
- Yealand Redmayne
Lancaster and Heysham lie within unparished areas.
Twin towns


Associate towns
References
- ↑ Roach, Peter; Hartman, James; Setter, Jane; Jones, Daniel, eds. (2006). Cambridge English Pronouncing Dictionary (17th ed.). Cambridge: CUP. ISBN 978-0-521-68086-8.
- ↑ Yorkshire Dales National Park: Boundary extension
- ↑ "Population Estimates for UK, England and Wales, Scotland and Northern Ireland, Mid-2017". Office for National Statistics. 28 June 2018. Retrieved 28 June 2018.
- ↑ "Standard Area Measurements (2016) for Administrative Areas in the United Kingdom". Office for National Statistics. 1 February 2017. Retrieved 9 February 2017.
- ↑ "Parish Councils". Lancaster City Council. Retrieved 25 May 2010.
- ↑ "Your MPs". Lancaster City Council. Retrieved 25 May 2010.
- ↑ "University and Scotforth Rural Ward Election Results". Britain Elects. Retrieved 17 May 2018.
- ↑ "Council Structure". Lancaster City Council. Retrieved 24 April 2018.
- ↑ "Lancaster City Council Elections - Thursday, 3rd May 2007". Lancaster City Council. Retrieved 30 March 2013.
- ↑ "Lancaster City Council Elections - Thursday, 5th May 2011". Lancaster City Council. Retrieved 30 March 2013.
- ↑ "Lancaster City Council Elections - Thursday, 7th May 2015". Lancaster City Council. Archived from the original on 11 May 2015. Retrieved 21 January 2016.
- ↑ Lancaster Local Authority ethnic group, Statistics.gov.uk, retrieved 26 June 2009
- ↑ Lancashire Education Authority ethnic group, Statistics.gov.uk, retrieved 26 June 2009
- 1 2 3 4 Lancaster Local Authority key statistics, Statistics.gov.uk, retrieved 23 October 2015
- ↑ Lancaster Local Authority household data, Statistics.gov.uk, retrieved 26 June 2009
- ↑ Lancaster Local Authority population density, Statistics.gov.uk, retrieved 26 June 2009
- ↑ Lancaster District: total population, Vision of Britain, retrieved 26 June 2009
- ↑ Religion, 2011 Census of Population, Lancashire County Council, retrieved 4 March 2016
- ↑ The Diocese of Lancaster, Lancaster Diocese, archived from the original on 21 June 2009, retrieved 26 June 2009
- ↑ The Diocese of Blackburn, Blackburn Diocese, retrieved 26 June 2009
- 1 2 Lancaster Local Authority economic activity, Statistics.gov.uk, retrieved 26 June 2009
- ↑ Lancashire Education Authority economic activity, Statistics.gov.uk, retrieved 26 June 2009
- ↑ Lancaster Local Authority industry of employment, Statistics.gov.uk, retrieved 26 June 2009
- 1 2 "Twin towns". www.lancaster.gov.uk. Lancaster City Council. Retrieved 24 March 2017.
External links
Neighbouring ceremonial counties and principal areas | ||||||||||
|---|---|---|---|---|---|---|---|---|---|---|
| ||||||||||
Buildings and structures in the City of Lancaster | ||||||
|---|---|---|---|---|---|---|
| Grade I |
| .jpg) | ||||
| Grade II* |
| |||||
| Grade II |
| |||||
| Unlisted |
| |||||
| Demolished | ||||||
| Listed buildings in |
| |||||
Culture and infrastructure of the City of Lancaster | |||||||||||||
|---|---|---|---|---|---|---|---|---|---|---|---|---|---|
| Transport |
| ||||||||||||
| Parks & reserves | |||||||||||||
| Sport | |||||||||||||
| Media | |||||||||||||
| Politics | |||||||||||||
| Education |
| ||||||||||||
| |||||||||||||