Bradford South (UK Parliament constituency)
| Bradford South | |
|---|---|
|
Borough constituency for the House of Commons | |
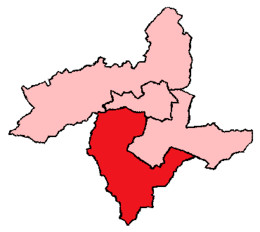
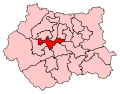 Boundary of Bradford South in West Yorkshire. | |
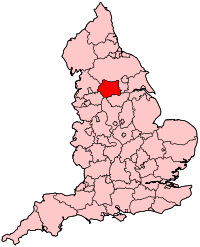 Location of West Yorkshire within England. | |
| County | West Yorkshire |
| Population | 101,545 (2011 census)[1] |
| Electorate | 64,715 (December 2010)[2] |
| Major settlements | Bradford |
| Current constituency | |
| Created | 1918 |
| Member of parliament | Judith Cummins (Labour) |
| Number of members | One |
| Created from | Elland |
| Overlaps | |
| European Parliament constituency | Yorkshire and the Humber |
Bradford South is a constituency[n 1] of the city of Bradford, West Yorkshire represented in the House of Commons of the UK Parliament since 2015 by Judith Cummins of the Labour Party.[n 2]
Boundaries
1918-1950: The County Borough of Bradford wards of Great Horton, Lister Hills, Little Horton, North Bierley East, and North Bierley West.
1950-1955: The County Borough of Bradford wards of Clayton, Great Horton, Lister Hills, North Bierley West, and Thornton.
1955-1974: The County Borough of Bradford wards of Clayton, North Bierley East, North Bierley West, and West Bowling, and the Urban District of Queensbury and Shelf.
1974-1983: The County Borough of Bradford wards of Clayton, Great Horton, Odsal, Tong, Wibsey, and Wyke, and the Urban District of Queensbury and Shelf.
1983-2010: The City of Bradford wards of Great Horton, Odsal, Queensbury, Tong, Wibsey, and Wyke.
2010-present: The City of Bradford wards of Great Horton, Queensbury, Royds, Tong, Wibsey, and Wyke.
History
It was a Liberal-held seat from 1922–24 and 1931-1945. Since the 1945 general election Bradford South has returned Labour Party MPs, although the Conservative Party came very close to gaining the seat in the 1980s.
Members of Parliament
Elections
Elections in the 2010s
| Party | Candidate | Votes | % | ± | |
|---|---|---|---|---|---|
| Labour | Judith Cummins | 22,364 | 54.5 | +11.1 | |
| Conservative | Tanya Graham | 15,664 | 38.2 | +11.9 | |
| UKIP | Stephen Place | 1,758 | 4.3 | -19.8 | |
| Liberal Democrat | Stuart Thomas | 516 | 1.3 | -1.7 | |
| English Democrat | Therese Hirst | 377 | 0.9 | N/A | |
| Green | Darren Parkinson | 370 | 0.9 | -2.4 | |
| Majority | 6,700 | 16.3 | -0.9 | ||
| Turnout | 41,049 | 60.6 | +1.5 | ||
| Labour hold | Swing | ||||
| Party | Candidate | Votes | % | ± | |
|---|---|---|---|---|---|
| Labour | Judith Cummins | 16,328 | 43.4 | +2.2 | |
| Conservative | Tanya Graham | 9,878 | 26.3 | −2.8 | |
| UKIP | Jason Smith | 9,057 | 24.1 | +20.6 | |
| Green | Andy Robinson | 1,243 | 3.3 | N/A | |
| Liberal Democrat | Andrew Tear | 1,094 | 2.9 | −15.4 | |
| Majority | 6,450 | 17.2 | |||
| Turnout | 37,600 | 59.1 | |||
| Labour hold | Swing | +2.5 | |||
| Party | Candidate | Votes | % | ± | |
|---|---|---|---|---|---|
| Labour | Gerry Sutcliffe | 15,682 | 41.3 | −7.0 | |
| Conservative | Matthew Palmer | 11,060 | 29.1 | +4.8 | |
| Liberal Democrat | Alun Griffiths | 6,948 | 18.3 | +3.8 | |
| BNP | Sharon Sutton | 2,651 | 7.0 | −0.8 | |
| UKIP | Jamie Illingworth | 1,339 | 3.5 | +2.0 | |
| Democratic Nationalist | James Lewthwaite | 315 | 0.8 | N/A | |
| Majority | 4,622 | 12.2 | |||
| Turnout | 37,995 | 59.8 | +6.3 | ||
| Labour hold | Swing | −5.9 | |||
Elections in the 2000s
| Party | Candidate | Votes | % | ± | |
|---|---|---|---|---|---|
| Labour | Gerry Sutcliffe | 17,954 | 49.0 | −6.8 | |
| Conservative | Geraldine Carter | 8,787 | 24.0 | −4.3 | |
| Liberal Democrat | Mike Doyle | 5,334 | 14.6 | +4.0 | |
| BNP | James Lewthwaite | 2,862 | 7.8 | N/A | |
| Green | Derek Curtis | 695 | 1.9 | N/A | |
| UKIP | Jason Smith | 552 | 1.5 | −0.7 | |
| Veritas | Therese Muchewicz | 421 | 1.2 | +1.2 | |
| Majority | 9,167 | 25.0 | |||
| Turnout | 36,605 | 54.2 | +2.9 | ||
| Labour hold | Swing | −1.2 | |||
| Party | Candidate | Votes | % | ± | |
|---|---|---|---|---|---|
| Labour | Gerry Sutcliffe | 19,603 | 55.8 | −0.9 | |
| Conservative | Graham Tennyson | 9,941 | 28.3 | +0.3 | |
| Liberal Democrat | Alexander Wilson-Fletcher | 3,717 | 10.6 | −0.7 | |
| UKIP | Peter North | 783 | 2.2 | N/A | |
| Socialist Labour | Tony Kelly | 571 | 1.6 | N/A | |
| Socialist Alliance | Ateeq Siddique | 302 | 0.9 | N/A | |
| Defend The Welfare State Against Blairism | George Riseborough | 220 | 0.6 | N/A | |
| Majority | 9,662 | 27.5 | |||
| Turnout | 35,137 | 51.3 | −14.5 | ||
| Labour hold | Swing | ||||
Elections in the 1990s
| Party | Candidate | Votes | % | ± | |
|---|---|---|---|---|---|
| Labour | Gerry Sutcliffe | 25,558 | 56.7 | +9.1 | |
| Conservative | Ann G. Hawkesworth | 12,622 | 28.0 | −10.4 | |
| Liberal Democrat | Alexander Wilson-Fletcher | 5,093 | 11.3 | −2.4 | |
| Referendum | Marilyn Kershaw | 1,785 | 4.0 | N/A | |
| Majority | 12,936 | 28.7 | +19.5 | ||
| Turnout | 45,058 | 65.9 | |||
| Labour hold | Swing | ||||
| Party | Candidate | Votes | % | ± | |
|---|---|---|---|---|---|
| Labour | Gerry Sutcliffe | 17,014 | 55.3 | +7.7 | |
| Liberal Democrat | Helen Wright | 7,350 | 23.9 | +10.2 | |
| Conservative | Ronnie Farley | 5,475 | 17.8 | −20.6 | |
| Monster Raving Loony | David Sutch | 727 | 2.4 | N/A | |
| Natural Law | Keith Laycock | 197 | 0.6 | N/A | |
| Majority | 9,664 | 31.4 | +22.1 | ||
| Turnout | 30,763 | 44.1 | −31.5 | ||
| Labour hold | Swing | ||||
| Party | Candidate | Votes | % | ± | |
|---|---|---|---|---|---|
| Labour | Bob Cryer | 25,185 | 47.6 | +6.2 | |
| Conservative | Andrew S. Popat | 20,283 | 38.4 | −2.4 | |
| Liberal Democrat | Brian J. Boulton | 7,243 | 13.7 | −4.1 | |
| Islamic Party | Mohammad Naseem | 156 | 0.3 | N/A | |
| Majority | 4,902 | 9.3 | +8.7 | ||
| Turnout | 52,867 | 75.6 | +2.0 | ||
| Labour hold | Swing | ||||
Elections in the 1980s
| Party | Candidate | Votes | % | ± | |
|---|---|---|---|---|---|
| Labour | Bob Cryer | 21,230 | 41.42 | ||
| Conservative | Graham Hall | 20,921 | 40.81 | ||
| Social Democratic | Trevor Lindley | 9,109 | 17.77 | ||
| Majority | 309 | 0.60 | |||
| Turnout | 73.66 | ||||
| Labour hold | Swing | ||||
| Party | Candidate | Votes | % | ± | |
|---|---|---|---|---|---|
| Labour | Tom Torney | 18,542 | 37.52 | ||
| Conservative | Graham Hall | 18,432 | 37.29 | ||
| Social Democratic | D.A. Pearl | 12,143 | 24.57 | ||
| Ecology | Robert Adset | 308 | 0.62 | ||
| Majority | 110 | 0.22 | |||
| Turnout | 71.03 | ||||
| Labour hold | Swing | ||||
Elections in the 1970s
| Party | Candidate | Votes | % | ± | |
|---|---|---|---|---|---|
| Labour | Tom Torney | 26,323 | 47.11 | ||
| Conservative | JK Hirst | 22,005 | 39.38 | ||
| Liberal | R Taylor | 7,127 | 12.75 | ||
| National Front | G Wright | 422 | 0.76 | ||
| Majority | 4,318 | 7.73 | |||
| Turnout | 73.18 | ||||
| Labour hold | Swing | ||||
| Party | Candidate | Votes | % | ± | |
|---|---|---|---|---|---|
| Labour | Tom Torney | 25,219 | 48.05 | ||
| Conservative | GC Littlewood | 16,964 | 32.32 | ||
| Liberal | CJ Cawood | 10,306 | 19.63 | ||
| Majority | 8,255 | 15.73 | |||
| Turnout | 71.64 | ||||
| Labour hold | Swing | ||||
| Party | Candidate | Votes | % | ± | |
|---|---|---|---|---|---|
| Labour | Tom Torney | 25,875 | 44.76 | ||
| Conservative | PG Dwyer | 18,222 | 31.52 | ||
| Liberal | Margaretta Holmstedt | 12,961 | 22.42 | ||
| Independent Powellite | R Pearson | 749 | 1.30 | ||
| Majority | 7,653 | 13.24 | |||
| Turnout | 79.68 | ||||
| Labour hold | Swing | ||||
| Party | Candidate | Votes | % | ± | |
|---|---|---|---|---|---|
| Labour | Tom Torney | 20,985 | 45.93 | ||
| Conservative | John Derek Whittaker Bottomley | 19,009 | 41.61 | ||
| Liberal | George Dunkerley | 5,694 | 12.46 | ||
| Majority | 1,976 | 4.32 | |||
| Turnout | 45,688 | 72.01 | |||
| Labour hold | Swing | -6.3 | |||
Elections in the 1960s
| Party | Candidate | Votes | % | ± | |
|---|---|---|---|---|---|
| Labour | George Craddock | 22,932 | 52.53 | ||
| Conservative | John Derek Whittaker Bottomley | 15,435 | 35.35 | ||
| Liberal | George Dunkerley | 5,291 | 12.12 | ||
| Majority | 7,497 | 17.17 | |||
| Turnout | 43,658 | 75.99 | |||
| Labour hold | Swing | +4.25 | |||
| Party | Candidate | Votes | % | ± | |
|---|---|---|---|---|---|
| Labour | George Craddock | 21,004 | 46.28 | ||
| Conservative and National Liberal | John Derek Whittaker Bottomley | 17,097 | 37.67 | ||
| Liberal | Allen Clegg | 7,286 | 16.05 | ||
| Majority | 3,907 | 8.61 | |||
| Turnout | 45,387 | 78.57 | |||
| Labour hold | Swing | ||||
Elections in the 1950s
| Party | Candidate | Votes | % | ± | |
|---|---|---|---|---|---|
| Labour | George Craddock | 21,172 | 45.85 | ||
| National Liberal and Conservative | Reginald Winston Jones | 18,158 | 39.32 | ||
| Liberal | Hugh Womersley | 6,850 | 14.83 | ||
| Majority | 3,014 | 6.53 | |||
| Turnout | 46,180 | 80.99 | |||
| Labour hold | Swing | ||||
| Party | Candidate | Votes | % | ± | |
|---|---|---|---|---|---|
| Labour | George Craddock | 20,478 | 47.32 | ||
| National Liberal and Conservative | Reginald Winston Jones | 16,768 | 38.75 | ||
| Liberal | Arthur T Ellis | 6,029 | 13.93 | ||
| Majority | 3,710 | 8.57 | |||
| Turnout | 43,275 | 80.36 | |||
| Labour hold | Swing | ||||
| Party | Candidate | Votes | % | ± | |
|---|---|---|---|---|---|
| Labour | George Craddock | 21,364 | 47.16 | ||
| Conservative and National Liberal | Geoffrey Francis Greenbank | 17,863 | 39.43 | ||
| Liberal | Edward Rushworth | 6,072 | 13.40 | ||
| Majority | 3,501 | 7.73 | |||
| Turnout | 86.21 | ||||
| Labour hold | Swing | ||||
| Party | Candidate | Votes | % | ± | |
|---|---|---|---|---|---|
| Labour | George Craddock | 21,344 | 47.50 | ||
| Conservative and National Liberal | John Lightfoot Windle | 15,998 | 35.60 | ||
| Liberal | Edward Rushworth | 7,594 | 16.90 | ||
| Majority | 5,346 | 11.90 | |||
| Turnout | 86.19 | ||||
| Labour hold | Swing | ||||
Elections in the 1940s
| Party | Candidate | Votes | % | ± | |
|---|---|---|---|---|---|
| Labour | George Craddock | 23,335 | 51.3 | -1.2 | |
| Conservative and National Liberal | John Lightfoot Windle | 19,313 | 42.4 | +9.3 | |
| Independent Liberal | Colin James Canning | 2,882 | 6.3 | n/a | |
| Majority | 4,022 | 8.9 | -10.5 | ||
| Turnout | 45,530 | 74.4 | -2.5 | ||
| Labour hold | Swing | -5.3 | |||
| Party | Candidate | Votes | % | ± | |
|---|---|---|---|---|---|
| Labour Co-op | Meredith Titterington | 24,394 | 52.5 | +11.0 | |
| Liberal National | Herbert Walker Peel | 15,392 | 33.1 | n/a | |
| Liberal | Charles Ewart Hindley | 6,707 | 14.4 | -44.1 | |
| Majority | 9,002 | 19.4 | +2.5 | ||
| Turnout | 46,493 | 76.9 | |||
| Labour Co-op gain from Liberal | Swing | ||||
General Election 1939/40:
Another General Election was required to take place before the end of 1940. The political parties had been making preparations for an election to take place from 1939 and by the end of this year, the following candidates had been selected;
- Liberal National: Herbert Holdsworth
- Labour: Meredith Titterington
- Liberal: Charles Ewart Hindley
Elections in the 1930s
| Party | Candidate | Votes | % | ± | |
|---|---|---|---|---|---|
| Liberal | Herbert Holdsworth | 24,081 | 58.5 | ||
| Labour Co-op | William Hirst | 17,121 | 41.5 | ||
| Majority | 6,960 | 16.9 | |||
| Turnout | 41,202 | 70.3 | |||
| Liberal hold | Swing | ||||
| Party | Candidate | Votes | % | ± | |
|---|---|---|---|---|---|
| Liberal | Herbert Holdsworth | 31,531 | 66.4 | ||
| Labour Co-op | William Hirst | 15,994 | 33.6 | ||
| Majority | 15,537 | 32.7 | |||
| Turnout | 47,525 | 82.61 | |||
| Liberal gain from Labour Co-op | Swing | ||||
Elections in the 1920s
| Party | Candidate | Votes | % | ± | |
|---|---|---|---|---|---|
| Labour Co-op | William Hirst | 23,251 | 48.9 | +9.9 | |
| Liberal | Frederick Ogden | 12,279 | 25.8 | -2.8 | |
| Unionist | Geoffrey William Ferrand | 12,059 | 25.3 | -7.1 | |
| Majority | 10,972 | 23.1 | +16.5 | ||
| Turnout | 83.0 | +0.8 | |||
| Labour Co-op hold | Swing | +6.3 | |||
| Party | Candidate | Votes | % | ± | |
|---|---|---|---|---|---|
| Labour Co-op | William Hirst | 13,919 | 39.0 | +4.1 | |
| Unionist | George Mitcheson | 11,586 | 32.4 | +4.3 | |
| Liberal | Herbert Harvey Spencer | 10,237 | 28.6 | -8.4 | |
| Majority | 2,333 | 6.6 | |||
| Turnout | 82.2 | +5.3 | |||
| Labour Co-op gain from Liberal | Swing | ||||
| Party | Candidate | Votes | % | ± | |
|---|---|---|---|---|---|
| Liberal | Herbert Harvey Spencer | 12,218 | 37.0 | -1.0 | |
| Labour Co-op | William Hirst | 11,543 | 34.9 | -0.4 | |
| Unionist | George Mitcheson | 9,270 | 28.1 | +1.4 | |
| Majority | 675 | 2.1 | -0.6 | ||
| Turnout | 76.9 | -5.3 | |||
| Liberal hold | Swing | -0.3 | |||
| Party | Candidate | Votes | % | ± | |
|---|---|---|---|---|---|
| Liberal | Herbert Harvey Spencer | 13,259 | 38.0 | +13.4 | |
| Labour Co-op | William Hirst | 12,353 | 35.3 | +4.4 | |
| Unionist | Vernon Willey | 9,334 | 26.7 | -17.8 | |
| Majority | 906 | 2.7 | |||
| Turnout | 82.2 | +17.4 | |||
| Liberal gain from Unionist | Swing | ||||
Elections in the 1910s
| Party | Candidate | Votes | % | ± | |
|---|---|---|---|---|---|
| C | Unionist | Vernon Willey | 11,949 | 44.5 | n/a |
| Co-operative Party | William Hirst | 8,291 | 30.9 | n/a | |
| Liberal | George Muff | 6,613 | 24.6 | n/a | |
| Majority | 3,658 | 13.6 | n/a | ||
| Turnout | 26,887 | 64.8 | n/a | ||
| Unionist win (new seat) | |||||
| C indicates candidate endorsed by the coalition government. | |||||
See also
Notes and references
- Notes
- ↑ A borough constituency (for the purposes of election expenses and type of returning officer)
- ↑ As with all constituencies, the constituency elects one Member of Parliament (MP) by the first past the post system of election at least every five years.
- References
- ↑ "Bradford South: Usual Resident Population, 2011". Neighbourhood Statistics. Office for National Statistics. Retrieved 1 February 2015.
- ↑ "Electorate Figures - Boundary Commission for England". 2011 Electorate Figures. Boundary Commission for England. 4 March 2011. Archived from the original on 6 November 2010. Retrieved 13 March 2011.
- ↑ "Hansard 1803-2005". Bradford South 1918-. UK Parliament. Retrieved 1 February 2015.
- ↑ "Bradford South parliamentary constituency". BBC News. Retrieved 9 June 2017.
- ↑ "Election Data 2015". Electoral Calculus. Archived from the original on 17 October 2015. Retrieved 17 October 2015.
- ↑ "Bradford South". BBC News. Retrieved 13 May 2015.
- ↑ "Election Data 2010". Electoral Calculus. Archived from the original on 26 July 2013. Retrieved 17 October 2015.
- ↑ "UK > England > Yorkshire & the Humber > Bradford South". Election 2010. BBC. 7 May 2010. Retrieved 11 May 2010.
- ↑ "Election Data 2005". Electoral Calculus. Archived from the original on 15 October 2011. Retrieved 18 October 2015.
- ↑ "Election Data 2001". Electoral Calculus. Archived from the original on 15 October 2011. Retrieved 18 October 2015.
- ↑ "Election Data 1997". Electoral Calculus. Archived from the original on 15 October 2011. Retrieved 18 October 2015.
- ↑ "Election Data 1992". Electoral Calculus. Archived from the original on 15 October 2011. Retrieved 18 October 2015.
- ↑ "Politics Resources". Election 1992. Politics Resources. 9 April 1992. Retrieved 6 December 2010.
- ↑ "Election Data 1987". Electoral Calculus. Archived from the original on 15 October 2011. Retrieved 18 October 2015.
- ↑ "Election Data 1983". Electoral Calculus. Archived from the original on 15 October 2011. Retrieved 18 October 2015.
- ↑
- ↑
- ↑
- ↑
- ↑
- 1 2 3 4 5 6 7 8 Craig, F.W.S., ed. (1969). British parliamentary election results 1918-1949. Glasgow: Political Reference Publications. p. 102. ISBN 0-900178-01-9.
External links
- nomis Constituency Profile for Bradford South — presenting data from the ONS annual population survey and other official statistics.