The Cotswolds (UK Parliament constituency)
| The Cotswolds | |
|---|---|
|
County constituency for the House of Commons | |
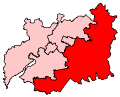 Boundary of The Cotswolds in Gloucestershire for the 2010 general election. | |
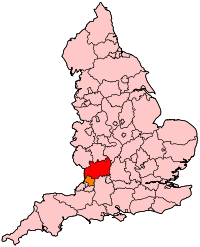 Location of Gloucestershire within England. | |
| County | Gloucestershire |
| Electorate | 78,439 (December 2010)[1] |
| Current constituency | |
| Created | 1997 |
| Member of parliament | Sir Geoffrey Clifton-Brown (Conservative) |
| Number of members | One |
| Created from | Cirencester and Tewkesbury |
| Overlaps | |
| European Parliament constituency | South West England |
The Cotswolds is a constituency[n 1] represented in the House of Commons of the UK Parliament since its 1997 creation by Sir Geoffrey Clifton-Brown, a Conservative.[n 2]
Members of Parliament
| Election | Member[2] | Party | ||
|---|---|---|---|---|
| 1997 | Sir Geoffrey Clifton-Brown | Conservative | 1992-1997: represented Cirencester and Tewkesbury. | |
Constituency profile
The Cotswolds is a safe Conservative seat in an area of natural beauty and heritage, with its market towns constructed of rare cream-to-yellow Cotswold stone. The area is welcoming to tourists and tourism has overtaken agriculture as the largest single employer in the area.
The largest town in the constituency is Cirencester, a compact traditional town. Other settlements include Andoversford, Bourton-on-the-Water, Chipping Campden, Fairford, Lechlade, Moreton-in-Marsh, Northleach, Stow-on-the-Wold, Tetbury (and the neighbouring village of Doughton, location of Highgrove, the Prince of Wales's estate), and Wotton-under-Edge.
The seat has the highest number of listed buildings of any constituency in Britain. It also contains eight of the 20 most popular attractions in Gloucestershire, including Westonbirt Arboretum, Hidcote Manor, and Chedworth Roman Villa.
Workless claimants, registered jobseekers, were in November 2012 significantly lower than the national average of 3.8%, at 1.6% of the population based on a statistical compilation by The Guardian.[3]
This was also the constituency, when declared during the 2015 UK General Election, saw the Conservatives gain a surprising majority that re-elected David Cameron as a hung parliament had been widely expected.
Boundaries
The constituency was created in 1997 as Cotswold, mostly from the former seat of Cirencester and Tewkesbury. In 2010 the name was changed to The Cotswolds to reflect the local district name.
2010-present: The District of Cotswold, and the District of Stroud wards of Kingswood, Minchinhampton, and Wotton-under-Edge.
1997-2010: The District of Cotswold, and the District of Stroud ward of Wotton and Kingswood.
Elections
Elections in the 2010s
| Party | Candidate | Votes | % | ± | |
|---|---|---|---|---|---|
| Conservative | Geoffrey Clifton-Brown | 36,201 | 60.1 | +4.1 | |
| Labour | Mark Huband | 10,702 | 17.9 | +8.7 | |
| Liberal Democrat | Andrew Gant | 9,748 | 16.3 | −2.3 | |
| Green | Sabrina Poole | 1,747 | 2.9 | −1.7 | |
| UKIP | Chris Harlow | 1,197 | 2 | −8.9 | |
| Independent | Sandy Steel | 107 | 0.2 | N/A | |
| Majority | 25,499 | 42.3 | +4.8 | ||
| Turnout | 59,702 | 74.2 | +1.8 | ||
| Registered electors | 80,449 | ||||
| Conservative hold | Swing | −2.3 | |||
| Party | Candidate | Votes | % | ± | |
|---|---|---|---|---|---|
| Conservative | Geoffrey Clifton-Brown | 32,045 | 56.5 | +3.5 | |
| Liberal Democrat | Paul Hodgkinson [8] | 10,568 | 18.6 | −10.9 | |
| UKIP | Chris Harlow | 6,188 | 10.9 | +6.7 | |
| Labour | Manjinder Kang | 5,240 | 9.2 | −1.5 | |
| Green | Penny Burgess | 2,626 | 4.6 | +2.9 | |
| Majority | 21,477 | 37.9 | +14.4 | ||
| Turnout | 56,667 | 72.4 | +0.9 | ||
| Registered electors | 78,292 | ||||
| Conservative hold | Swing | +7.2 | |||
| Party | Candidate | Votes | % | ± | |
|---|---|---|---|---|---|
| Conservative | Geoffrey Clifton-Brown | 29,075 | 53.0 | +3.7 | |
| Liberal Democrat | Mike Collins | 16,211 | 29.6 | +1.5 | |
| Labour | Mark Dempsey | 5,886 | 10.7 | −7.9 | |
| UKIP | Adrian Blake | 2,292 | 4.2 | +1.0 | |
| Green | Kevin Lister | 940 | 1.7 | N/A | |
| Independent | Alex Steel | 428 | 0.8 | N/A | |
| Majority | 12,864 | 23.5 | +2.2 | ||
| Turnout | 54,832 | 71.5 | +4.2 | ||
| Registered electors | 76,728 | ||||
| Conservative hold | Swing | +1.1 | |||
Elections in the 2000s
| Party | Candidate | Votes | % | ± | |
|---|---|---|---|---|---|
| Conservative | Geoffrey Clifton-Brown | 23,326 | 49.3 | −1.0 | |
| Liberal Democrat | Philip Beckerlegge | 13,638 | 28.8 | +4.6 | |
| Labour | Mark Dempsey | 8,457 | 17.9 | −4.7 | |
| UKIP | Richard Buckley | 1,538 | 3.2 | +0.3 | |
| Independent | James Derieg | 392 | 0.8 | N/A | |
| Majority | 9,688 | 20.5 | −5.6 | ||
| Turnout | 47,351 | 66.7 | −0.8 | ||
| Registered electors | 71,039 | ||||
| Conservative hold | Swing | −2.8 | |||
| Party | Candidate | Votes | % | ± | |
|---|---|---|---|---|---|
| Conservative | Geoffrey Clifton-Brown | 23,133 | 50.3 | +4.0 | |
| Liberal Democrat | Angela Lawrence | 11,150 | 24.2 | +1.3 | |
| Labour | Richard Wilkins | 10,383 | 22.6 | −0.1 | |
| UKIP | Jill Stopps | 1,315 | 2.9 | N/A | |
| Majority | 11,983 | 26.1 | +2.7 | ||
| Turnout | 45,981 | 67.5 | −8.5 | ||
| Registered electors | 68,157 | ||||
| Conservative hold | Swing | +1.3 | |||
Elections in the 1990s
| Party | Candidate | Votes | % | ± | |
|---|---|---|---|---|---|
| Conservative | Geoffrey Clifton-Brown | 23,698 | 46.4 | −8.0 | |
| Liberal Democrat | David Gayler | 11,733 | 22.9 | −10.4 | |
| Labour | David Elwell | 11,608 | 22.7 | +11.8 | |
| Referendum | Rupert Lowe | 3,393 | 6.6 | - | |
| Green | Valerie Michael | 560 | 1.1 | - | |
| Natural Law | Henry Brighouse | 129 | 0.3 | - | |
| Majority | 11,965 | 23.4 | +2.4 | ||
| Turnout | 51,121 | 75.9 | −6.5 | ||
| Registered electors | 67,333 | ||||
| Conservative win (new seat) | |||||
See also
Notes and references
- Notes
- ↑ A county constituency (for the purposes of election expenses and type of returning officer)
- ↑ As with all constituencies, the constituency elects one Member of Parliament (MP) by the first past the post system of election at least every five years.
- References
- ↑ "Electorate Figures - Boundary Commission for England". 2011 Electorate Figures. Boundary Commission for England. 4 March 2011. Archived from the original on 6 November 2010. Retrieved 13 March 2011.
- ↑ Leigh Rayment's Historical List of MPs – Constituencies beginning with "C" (part 6)
- ↑ Unemployment claimants by constituency The Guardian
- ↑ BBC - Election 2017 - Cotswolds, The
- ↑ http://www.cotswold.gov.uk/media/1510200/Declaration-of-result-Parliamentary-election-8-June-2017.pdf 9 June 2017
- ↑ "Election Data 2015". Electoral Calculus. Archived from the original on 17 October 2015. Retrieved 17 October 2015.
- ↑ http://www.cotswold.gov.uk/media/1178863/Declaration-of-result-PARLIAMENTARY-ELECTION-2015.pdf 19 June 2015
- ↑ http://electionresults.blogspot.co.uk/2013/04/cotswolds-2015.html
- ↑ "Election Data 2010". Electoral Calculus. Archived from the original on 26 July 2013. Retrieved 17 October 2015.
- ↑ BBC - Election 2010 - Cotswolds, The
- ↑ Percentage change and swing for 2010 is calculated relative to the PA (Rallings and Thrasher) 2005 notional result, not actual 2005 result "Press Association Elections". Press Association. Retrieved 17 July 2017.
- ↑ "Election Data 2005". Electoral Calculus. Archived from the original on 15 October 2011. Retrieved 18 October 2015.
- ↑ "Election Data 2001". Electoral Calculus. Archived from the original on 15 October 2011. Retrieved 18 October 2015.
- ↑ "Election Data 1997". Electoral Calculus. Archived from the original on 15 October 2011. Retrieved 18 October 2015.
- ↑ Percentage change and swing for 1997 is calculated relative to the Rallings and Thrasher 1992 notional constituency result, not actual 1992 result. See C. Rallings & M. Thrasher, The Media Guide to the New Parliamentary Constituencies (Plymouth: LGC Elections Centre, 1995)