United Kingdom general election, 1970
|
| |||||||||||||||||||||||||||||||||||||||||||||
| |||||||||||||||||||||||||||||||||||||||||||||
All 630 seats in the House of Commons 316 seats needed for a majority | |||||||||||||||||||||||||||||||||||||||||||||
|---|---|---|---|---|---|---|---|---|---|---|---|---|---|---|---|---|---|---|---|---|---|---|---|---|---|---|---|---|---|---|---|---|---|---|---|---|---|---|---|---|---|---|---|---|---|
| Turnout |
72.0%, | ||||||||||||||||||||||||||||||||||||||||||||
| |||||||||||||||||||||||||||||||||||||||||||||
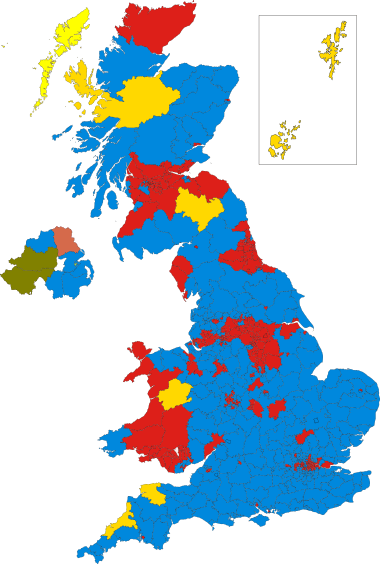 Colours denote the winning party—as shown in § Results | |||||||||||||||||||||||||||||||||||||||||||||
| |||||||||||||||||||||||||||||||||||||||||||||

The 1970 United Kingdom general election was held on Thursday 18 June 1970. It resulted in a surprise victory for the Conservative Party under leader Edward Heath, which defeated the governing Labour Party under Harold Wilson. The Liberal Party, under its new leader Jeremy Thorpe, lost half their seats. The Conservatives, including the Ulster Unionist Party (UUP), secured a majority of 31 seats. This general election was the first in which people could vote from the age of 18, after passage of the Representation of the People Act the previous year.
As of 2017, it is the earliest general election from which there remain members of the House of Commons who have a record of continuous service; Kenneth Clarke of the Conservatives and Dennis Skinner of Labour entered Parliament for the first time at this election. Clarke is the current Father of the House since the death of 86-year-old Gerald Kaufman in February 2017.
Most opinion polls prior to the election indicated a comfortable Labour victory, and put Labour up to 12.4% ahead of the Conservatives. On election day, however, a late swing gave the Conservatives a 3.4% lead and ended almost six years of Labour government, although Wilson remained leader of the Labour Party in opposition.
The result would provide the mandate for Edward Heath as Prime Minister to begin formal negotiations for the United Kingdom to become a member of the European Communities (EC)—or the "Common Market" as it was more widely known at the time, before it later became the European Union; the UK officially joined the EC on 1 January 1973, along with the Republic of Ireland and Denmark.
George Brown and Jennie Lee left Parliament as a result of this election.
The 1970 general election was the last election prior to that of 1997 where the Labour Party received more than 40% of the popular vote, and also the last until the 2017 election where the third-largest party by number of votes (in this case the Liberals) achieved less than 10% of the vote.
The election was the last in which a nationwide UK party gained seats in Northern Ireland.[1] The UUP sat with the Conservative Party at Westminster, traditionally taking the Conservative parliamentary whip. To all intents and purposes the UUP functioned as the Northern Ireland branch of the Conservative Party. In 1972, in protest over the permanent prorogation of the Parliament of Northern Ireland, the Westminster UUP MPs withdrew from the alliance.[2]
Election date
The date of 18 June was supposedly chosen because Harold Wilson wanted as Prime Minister to go to the polls before the introduction of decimal coinage in early 1971, for which his government had been responsible and which he thought was hugely unpopular,[3] and because Wilson sought to gain some momentum by surprising the Conservatives, who were expecting an October election.[3]
Overview
Commentators believed that an unexpectedly bad set of balance of payments figures (a £31 million trade deficit) released on election day, and a loss of national prestige after the England football team's defeat by West Germany on 15 June in the World Cup, contributed to the Labour defeat.[4]
Other factors that were cited as reasons for the Conservative victory included union indiscipline, rising prices, the risk of devaluation, the government's imposition of Selective Employment Tax (SET), and a set of jobless figures released on polling day showing unemployment at its highest level since 1940. Interviewed by Robin Day, the outgoing Prime Minister Harold Wilson highlighted the possibility that "complacency engendered by the opinion polls" may have resulted in a poor turnout of Labour supporters.[5] As defending world champions, England's venture in the World Cup attracted a much keener public interest than the general election did.[6]
American pollster Douglas Schoen and Oxford University academic R. W. Johnson asserted that Enoch Powell had attracted 2.5 million votes to the Conservatives, although the Conservative vote only increased by 1.7 million. Johnson later stated "It became clear that Powell had won the 1970 election for the Tories ... of all those who had switched their vote from one party to another, 50 per cent were working class Powellites".[7] The Professor of Political Science Randall Hansen assessed a range of studies, including some which contended that Powell had made little or no difference to the result, but concluded that "At the very least, Powell's effect was likely to have fired up the Conservative vote in constituencies which would have voted Tory in any event".[8] Election night commentators Michael Barratt and Jeffrey Preece dismissed any special "Powell factor", as did Conservative MPs Reginald Maudling, Timothy Raison and Hugh Dykes.[5]
The 1970–74 Parliament has to date been the only time since the 1924–29 Parliament in which the Conservative Party were only in government for one term before returning to opposition.
The most notable casualty of the election was George Brown, deputy leader of the Labour Party, who lost to the Conservative candidate in the Belper constituency. Brown had held the seat since 1945.
Unusually for the Liberal Party, the by-elections between 1966 and 1970 had proved almost fruitless, with many Liberal candidates losing deposits. The one exception was its by-election gain of Birmingham Ladywood in June 1969; this was promptly lost in the 1970 general election. The party found itself struggling to introduce its new leader Jeremy Thorpe to the public, owing to the extensive coverage and attention paid to Enoch Powell. The election result was poor for the Liberals, with Thorpe only narrowly winning his own seat in North Devon.[4]
The BBC's election coverage was led by Cliff Michelmore, along with Robin Day, David Butler and Robert McKenzie.[4] There were periodic cutaways to the BBC regions. This coverage has been rerun on BBC Parliament on several occasions, including on 18 July 2005 as a tribute to Edward Heath after his death the previous day. Its most recent screening was on 9 October 2010.[9] The BBC coverage was parodied by Monty Python's Flying Circus in its famous "Election Night Special" sketch.
Both BBC and ITN carried their 1970 election night broadcasts in colour, although segments broadcast from some remote locations and some BBC and ITN regional bureaus were transmitted in black-and-white. Some ITV regions were not yet broadcasting in colour at the time of the 1970 elections.
Timeline
The Prime Minister, Harold Wilson, visited Buckingham Palace on 18 May and asked the Queen to dissolve Parliament on 29 May, announcing that the election would be held on 18 June. The key dates were as follows:
| Friday 29 May | Dissolution of the 44th Parliament and campaigning officially begins |
| Monday 8 June | Last day to file nomination papers |
| Wednesday 17 June | Campaigning officially ends |
| Thursday 18 June | Polling day |
| Friday 19 June | The Conservative Party wins power with a majority of 31 |
| Monday 29 June | 45th Parliament assembles |
| Thursday 2 July | State Opening of Parliament |
Opinion poll summary
Summary of the final polling results before the general election.[10]
| Party | Marplan | Gallup | National opinion polls (NOP) | Opinion Research Centre (OPC) | Harris | |
|---|---|---|---|---|---|---|
| Conservative | 41.5% | 42.0% | 44.1% | 46.5% | 46.0% | |
| Labour | 50.2% | 49.0% | 48.2% | 45.5% | 48.0% | |
| Liberal | 7.0% | 7.5% | 6.4% | 6.5% | 5.0% | |
| Other parties | 1.3% | 1.5% | 1.3% | 1.5% | 1.0% | |
| Labour lead | 8.7% | 7.0% | 4.1% | −1.0% | 2.0% | |
| Fieldwork dates | 11–14 June | 14–16 June | 12–16 June | 13–17 June | 20 May – 16 June | |
| Sample size | 2,267 | 2,190 | 1,562 | 1,583 | 4,841 | |
Results
| 330 | 288 | 6 | 6 |
| Conservative | Labour | Lib | O |
This was the first general election where 18-year-olds had the right to vote. Therefore, despite 1.1 million more people voting in 1970 compared to 1966, turnout actually fell by 3%. Labour's number of votes, 12.2 million, was ironically the same amount they had needed to win in 1964. The Conservative vote surge cost Labour in many marginal seats. For the Liberals, a small 1% drop in their vote share saw them lose 6 seats, 3 of which were held by the narrowest of margins.
In the end the Conservatives achieved a swing of 4.7%, enough to give them a comfortable working majority. As for the smaller parties, they increased their number in the Commons from 2 to 6 seats.
| Candidates | Votes | ||||||||||
|---|---|---|---|---|---|---|---|---|---|---|---|
| Party | Leader | Stood | Elected | Gained | Unseated | Net | % of total | % | No. | Net % | |
| Conservative | Edward Heath | 628 | 330 | 80 | 3 | +77 | 52.4 | 46.4 | 13,145,123 | +4.5 | |
| Labour | Harold Wilson | 625 | 288 | 1 | 76 | −75 | 45.7 | 43.1 | 12,208,758 | −4.9 | |
| Liberal | Jeremy Thorpe | 332 | 6 | 0 | 6 | −6 | 1.0 | 7.5 | 2,117,035 | −1.0 | |
| SNP | William Wolfe | 65 | 1 | 1 | 0 | +1 | 0.2 | 1.1 | 306,802 | +0.6 | |
| Plaid Cymru | Gwynfor Evans | 36 | 0 | 0 | 0 | 0 | 0.6 | 175,016 | +0.4 | ||
| Unity | N/A | 5 | 2 | 2 | 0 | +2 | 0.3 | 0.50 | 140,930 | N/A | |
| Independent | N/A | 40 | 0 | 0 | 0 | 0 | 0.1 | 39,264 | 0.0 | ||
| Communist | John Gollan | 58 | 0 | 0 | 0 | 0 | 0.1 | 37,970 | −0.1 | ||
| Protestant Unionist | Ian Paisley | 2 | 1 | 1 | 0 | +1 | 0.2 | 0.1 | 35,303 | N/A | |
| Republican Labour | Gerry Fitt | 1 | 1 | 0 | 0 | 0 | 0.2 | 0.1 | 30,649 | N/A | |
| Independent Labour | N/A | 3 | 1 | 1 | 0 | +1 | 0.2 | 0.1 | 24,685 | +0.1 | |
| Ind. Conservative | N/A | 8 | 0 | 0 | 0 | 0 | 0.1 | 24,014 | +0.1 | ||
| Democratic Party | Desmond Donnelly | 5 | 0 | 0 | 0 | 0 | 0.1 | 15,292 | N/A | ||
| National Democratic | David Brown | 4 | 0 | 0 | 0 | 0 | 0.1 | 14,276 | N/A | ||
| National Front | John O'Brien | 10 | 0 | 0 | 0 | 0 | 0.0 | 11,449 | N/A | ||
| National Democratic | Gerry Quigley | 2 | 0 | 0 | 0 | 0 | 0.0 | 10,349 | N/A | ||
| Vectis National Party | R. W. Cawdell | 1 | 0 | 0 | 0 | 0 | 0.0 | 1,607 | N/A | ||
| Independent Liberal | N/A | 2 | 0 | 0 | 0 | 0 | 0.0 | 1,456 | 0.0 | ||
| World Government | Gilbert Young | 2 | 0 | 0 | 0 | 0 | 0.0 | 1,016 | N/A | ||
| Mebyon Kernow | Len Truran | 1 | 0 | 0 | 0 | 0 | 0.0 | 960 | N/A | ||
| Ind. Labour Party | Emrys Thomas | 1 | 0 | 0 | 0 | 0 | 0.0 | 847 | 0.0 | ||
| British Movement | Colin Jordan | 1 | 0 | 0 | 0 | 0 | 0.0 | 704 | N/A | ||
| Independent Progressive | 1 | 0 | 0 | 0 | 0 | 0.0 | 658 | N/A | |||
| Socialist (GB) | N/A | 2 | 0 | 0 | 0 | 0 | 0.0 | 376 | 0.0 | ||
| Young Ideas | Screaming Lord Sutch | 1 | 0 | 0 | 0 | 0 | 0.0 | 142 | N/A | ||
| British Commonwealth | 1 | 0 | 0 | 0 | 0 | 0.0 | 117 | N/A | |||
| Government's new majority | 30 |
| Total votes cast | 28,305,534 |
| Turnout | 72% |
Votes summary
Seats summary
Televised declarations
These declarations were covered live by the BBC where the returning officer was heard to say "duly elected".
| Constituency | Winning party 1966 | Constituency result by party | Winning party 1970 | |||||
|---|---|---|---|---|---|---|---|---|
| Con | Lab | Lib | Others | |||||
| Guildford | Conservative | 27,203 | 13,108 | 8,822 | Conservative hold | |||
| Cheltenham | Conservative | 22,823 | 14,213 | 8,431 | Conservative hold | |||
| Salford West | Labour | 14,310 | 16,986 | Labour hold | ||||
| Wolverhampton North East | Labour | 15,358 | 17,251 | 1,592 | Labour hold | |||
| Salford East | Labour | 9,583 | 15,853 | 3,000 | Labour hold | |||
| Wolverhampton South West | Conservative | 26,252 | 11,753 | 2,459 | 318 | Conservative hold | ||
| Newcastle upon Tyne Central | Labour | 4,256 | 13,671 | 1,433 | Labour hold | |||
| Newcastle upon Tyne North | Conservative | 15,978 | 12,518 | Conservative hold | ||||
| Exeter | Labour | 21,680 | 20,409 | 6,672 | Conservative gain | |||
Incumbents defeated
Labour
- Edwin Brooks (Bebington)
- Brian Parkyn (Bedford)
- Gwilym Roberts (South Bedfordshire)
- George Brown (Belper), Deputy Leader of the Labour Party
- Eric Moonman (Billericay)
- Christopher Price (Birmingham Perry Barr)
- Ioan Evans (Birmingham Yardley), Comptroller of the Household
- Robert Howarth (Bolton East)
- Gordon Oakes (Bolton West)
- Woodrow Wyatt (Bosworth)
- Norman Haseldine (Bradford West)
- Colin Jackson (Brighouse and Spenborough)
- Raymond Dobson (Bristol North East), Assistant Whip
- John Ellis (Bristol North West)
- Robert Maxwell (Buckingham)
- David Ensor (Bury and Radcliffe)
- Jennie Lee (Cannock), Minister for the Arts
- Ted Rowlands (Cardiff North)
- Alistair Macdonald (Chislehurst)
- Ednyfed Hudson Davies (Conway)
- David Winnick (Croydon South)
- Sydney Irving (Dartford), Chairman of Ways and Means
- David Ennals (Dover), Minister of State for Social Services
- Stan Newens (Epping)
- Gwyneth Dunwoody (Exeter), Parliamentary Secretary at the Board of Trade
- John Dunwoody (Falmouth and Camborne)
- Terence Boston (Faversham)
- John Diamond (Gloucester), Chief Secretary to the Treasury
- Albert Murray (Gravesend), Parliamentary Secretary to the Ministry of Transport
- Benjamin Whitaker (Hampstead), Parliamentary Secretary to the Minister of Overseas Development
- Roy Roebuck (Harrow East)
- Peter Jackson (High Peak)
- Arnold Shaw (Ilford South)
- Sir Dingle Foot (Ipswich), Solicitor General for England and Wales
- John Binns (Keighley)
- John Page (Kings Lynn)
- Stanley Henig (Lancaster)
- Harold Davies (Leek), Parliamentary Private Secretary to the Prime Minister
- James Dickens (Lewisham West)
- William Howie (Luton), Comptroller of the Household
- Jeremy Bray (Middlesbrough West)
- Dennis Coe (Middleton and Prestwich)
- George Perry (Nottingham South)
- John Horner (Oldbury and Halesowen)
- Evan Luard (Oxford)
- Ronald Atkins (Preston North)
- John Lee (Reading)
- Anne Kerr (Rochester and Chatham)
- Anthony Greenwood (Rossendale), Minister of Housing and Local Government
- Antony Gardner (Rushcliffe)
- Bob Mitchell (Southampton Test)
- Arnold Gregory (Stockport North)
- Ernest Davies (Stretford)
- Gerald Fowler (The Wrekin)
- John Ryan (Uxbridge)
- Malcolm Macmillan (Western Isles)
- Hugh Gray (Yarmouth)
Conservative
Liberal
Ulster Unionist Party
Scottish National Party
Democratic Party
- Desmond Donnelly (Pembrokeshire), former Labour MP
See also
Notes
- ↑ The Conservative figure includes eight Ulster Unionists, and the Labour figure includes seven Northern Ireland Labour Party candidates.
References
- ↑ Keohane, Dan (2000), Security in British Politics 1945–99, p. 183
- ↑ Bell, Stuart; Seldon, Anthony, The Heath Government 1970–74: A Reappraisal
- 1 2 Haines, Joe (2003), Glimmers of Twilight, London: Politico's Publishers
- 1 2 3 1970: Heath's surprise victory, BBC News, 5 April 2005, retrieved 31 May 2018
- 1 2 BBC Election Results Programme, 18–19 July 1970
- ↑ Heath: The victory few predicted, BBC News, retrieved 31 May 2018
- ↑ Heffer, Simon (1999), Like the Roman: The Life of Enoch Powell, London: Phoenix, p. 568
- ↑ Hansen, Randell (2000), Citizenship and Immigration in Post-War Britain, Oxford University Press
- ↑ BBC Election 1970, BBC Parliament, archived from the original on 25 October 2010
- ↑ Abrams, M. (1970), "The Opinion Polls and the 1970 British General Election", The Public Opinion Quarterly, 34 (2): 317–324
Further reading
- Butler, David E.; et al. (1971), The British General Election of 1970, the standard scholarly study
- Craig, F. W. S. (1989), British Electoral Facts: 1832–1987, Dartmouth: Gower, ISBN 0900178302
External links
Manifestos
- A Better Tomorrow, 1970 Conservative Party manifesto
- Now Britain's strong – let's make it great to live in, 1970 Labour Party manifesto
- What a Life!, 1970 Liberal Party manifesto
| General elections |
|
|---|---|
| Local elections |
|
| European elections | |
| Referendums | |
| Premierships | .jpg) | |
|---|---|---|
| General elections | ||
| Party elections | ||
| Constituencies | ||
| Resignation Honours | ||
| Family |
| |
| Related articles | ||
| ||
| Premiership | 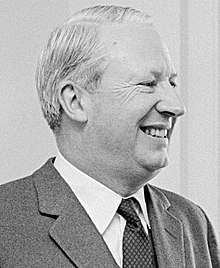 | |
|---|---|---|
| General elections | ||
| Party elections | ||
| Constituencies | ||
| Related articles | ||