Montgomeryshire (UK Parliament constituency)
Coordinates: 52°38′24″N 3°28′08″W / 52.640°N 3.469°W
| Montgomeryshire | |
|---|---|
|
County constituency for the House of Commons | |
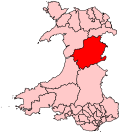 Boundary of Montgomeryshire in Wales. | |
| Preserved county | Powys |
| Electorate | 48,910 (December 2010)[1] |
| Major settlements | Newtown, Welshpool |
| Current constituency | |
| Created | 1542 |
| Member of parliament | Glyn Davies (Conservative) |
| Number of members | One |
| Created from | Montgomery |
| Overlaps | |
| Welsh Assembly | Mid and West Wales |
| European Parliament constituency | Wales |
Montgomeryshire (Welsh: Sir Drefaldwyn) is a constituency represented in the House of Commons of the Parliament of the United Kingdom. Created in 1542, it elects one Member of Parliament (MP), traditionally known as the knight of the shire, by the first-past-the-post system of election.
The Montgomeryshire Welsh Assembly constituency was created with the same boundaries in 1999.
It is the only constituency in Wales never to have elected a Labour MP.
Boundaries
The seat is based on the ancient county of Montgomeryshire, in the principal area of Powys. One of Britain's most rural and isolated constituencies, it has also been one of the small handful of seats that the Liberal Democrats (formerly the Liberal Party) could call safe, before a loss to the Conservatives in the 2010 general election. Montgomeryshire had elected Liberal or Liberal-affiliated candidates since 1880 apart from this and a Conservative victory in the 1979 general election. In the 1983 general election it was only seat in England and Wales where a sitting Conservative MP was unseated, while nationally his party's seat majority increased. The seat was officially known as Montgomery before 1997.
Proposed constituency changes
Under proposed constituency boundary changes announced in September 2016, ahead of the next general election, the seat will be partitioned, the northern half including Welshpool to be merged with Clwyd South to form a new seat of South Clwyd and North Montgomeryshire; most of the southern including Newtown will be merged with the Brecon and Radnor seat to form a seat renamed as Brecon, Radnor and Montgomery,[2] and the wards of Llanidloes and Blaen Hafren merged into the Ceredigion constituency which will form part of a new seat called Ceredigion and North Pembrokeshire.[3]
Members of Parliament
1542–1604
| Parliament | Member |
|---|---|
| 1542 | James Leche[4] |
| 1545 | Humphrey Lloyd[4] |
| 1547 | Humphrey Lloyd[4] |
| 1553 (Mar) | Edward Herbert[4] |
| 1553 (Oct) | Edward Herbert[4] |
| 1554 (Apr) | Edward Herbert[4] |
| 1554 (Nov) | Edward Herbert[4] |
| 1555 | Not known |
| 1558 | Edward Herbert[4] |
| 1559 (Jan) | Edward Herbert I[5] |
| 1562–1563 | Edward Herbert I[5] |
| 1571 | Edward Herbert I[5] |
| 1572 | John Price[5] |
| 1584 (Oct) | Richard Herbert[5] |
| 1586 (Oct) | Oliver Lloyd[5] |
| 1588 (Oct) | Edward Herbert I[5] |
| 1593 | Reginald WIlliams[5] |
| 1597 (Sep) | William Herbert[5] |
| 1601 (Oct) | Edward Herbert[5] |
1604–present
Elections
Elections in the 21st Century
Elections in the 2010s
| Party | Candidate | Votes | % | ± | |
|---|---|---|---|---|---|
| Conservative | Glyn Davies | 18,075 | 51.8 | +6.8 | |
| Liberal Democrat | Jane Dodds | 8,790 | 25.2 | -4.1 | |
| Labour | Iwan Wyn Jones | 5,542 | 15.9 | +10.3 | |
| Plaid Cymru | Aled Morgan Hughes | 1,960 | 5.6 | +0.4 | |
| Green | Richard Chaloner | 524 | 1.5 | -2.2 | |
| Majority | 9,285 | 26.6 | +10.8 | ||
| Turnout | 34,891 | 70.1 | +0.8 | ||
| Registered electors | 50,755 | ||||
| Conservative hold | Swing | +5.5 | |||
| Party | Candidate | Votes | % | ± | |
|---|---|---|---|---|---|
| Conservative | Glyn Davies | 15,204 | 45.0 | +3.7 | |
| Liberal Democrat | Jane Dodds[11] | 9,879 | 29.3 | −8.6 | |
| UKIP | Des Parkinson[12] | 3,769 | 11.2 | +7.8 | |
| Labour | Martyn Singleton[13] | 1,900 | 5.6 | −1.5 | |
| Plaid Cymru | Ann Griffith[14] | 1,745 | 5.2 | −3.1 | |
| Green | Richard Chaloner | 1,260 | 3.7 | N/A | |
| Majority | 5,325 | 15.8 | +12.3 | ||
| Turnout | 33,757 | 69.3 | −0.1 | ||
| Registered electors | 48,690 | ||||
| Conservative hold | Swing | +6.2 | |||
| Party | Candidate | Votes | % | ± | |
|---|---|---|---|---|---|
| Conservative | Glyn Davies | 13,976 | 41.3 | +13.8 | |
| Liberal Democrat | Lembit Öpik | 12,792 | 37.8 | −12.5 | |
| Plaid Cymru | Heledd Fychan | 2,802 | 8.3 | +1.3 | |
| Labour | Nick Colbourne | 2,407 | 7.1 | −5.2 | |
| UKIP | David W. L. Rowlands | 1,128 | 3.3 | +0.4 | |
| National Front | Milton Ellis | 384 | 1.1 | N/A | |
| Independent | Bruce Lawson | 324 | 1.0 | N/A | |
| Majority | 1,184 | 3.5 | N/A | ||
| Turnout | 33,813 | 69.4 | +3.1 | ||
| Registered electors | 48,730 | ||||
| Conservative gain from Liberal Democrat | Swing | +13.2 | |||
note: The David Rowlands who stood here is different from the David Rowlands who stood in Newport East at this election for UKIP.
Elections in the 2000s
| Party | Candidate | Votes | % | ± | |
|---|---|---|---|---|---|
| Liberal Democrat | Lembit Öpik | 15,419 | 51.2 | +1.8 | |
| Conservative | Simon Baynes | 8,246 | 27.4 | −0.5 | |
| Labour | David Tinline | 3,454 | 11.5 | −0.4 | |
| Plaid Cymru | Ellen ap Gwynn | 2,078 | 6.9 | +0.1 | |
| UKIP | Clive Easton | 900 | 3.0 | +0.3 | |
| Majority | 7,173 | 23.8 | +2.3 | ||
| Turnout | 30,097 | 64.4 | −1.1 | ||
| Registered electors | 46,766 | ||||
| Liberal Democrat hold | Swing | +1.2 | |||
| Party | Candidate | Votes | % | ± | |
|---|---|---|---|---|---|
| Liberal Democrat | Lembit Öpik | 14,319 | 49.4 | +3.5 | |
| Conservative | David Jones | 8,085 | 27.9 | +1.8 | |
| Labour | Paul Davies | 3,443 | 11.9 | −7.3 | |
| Plaid Cymru | David Senior | 1,969 | 6.8 | +1.8 | |
| UKIP | David Rowlands | 786 | 2.7 | N/A | |
| ProLife Alliance | Ruth Davies | 210 | 0.7 | N/A | |
| Independent | Reginald Taylor | 171 | 0.6 | N/A | |
| Majority | 6,234 | 21.5 | +1.7 | ||
| Turnout | 28,983 | 65.5 | −9.2 | ||
| Registered electors | 62,200 | ||||
| Liberal Democrat hold | Swing | +0.9 | |||
Elections in the 20th Century
Elections in the 1990s
| Party | Candidate | Votes | % | ± | |
|---|---|---|---|---|---|
| Liberal Democrat | Lembit Öpik | 14,647 | 45.9 | −2.6 | |
| Conservative | Glyn Davies | 8,344 | 26.1 | −6.6 | |
| Labour | Angharad Davies | 6,109 | 19.1 | +6.7 | |
| Plaid Cymru | Helen Mary Jones | 1,608 | 5.0 | +0.3 | |
| Referendum | John Bufton | 879 | 2.8 | N/A | |
| Green | Susan Walker | 338 | 1.1 | −0.4 | |
| Majority | 6,303 | 19.7 | +3.9 | ||
| Turnout | 31,925 | 74.7 | −5.0 | ||
| Registered electors | 60,873 | ||||
| Liberal Democrat hold | Swing | +2.0 | |||
| Party | Candidate | Votes | % | ± | |
|---|---|---|---|---|---|
| Liberal Democrat | Alex Carlile | 16,031 | 48.5 | +1.9 | |
| Conservative | Jeannie France-Hayhurst | 10,822 | 32.7 | −5.8 | |
| Labour | Stephen Wood | 4,115 | 12.4 | +1.9 | |
| Plaid Cymru | Hugh Parsons | 1,581 | 4.8 | +0.3 | |
| Green | Patrick Adams | 508 | 1.5 | N/A | |
| Majority | 5,209 | 15.8 | +7.7 | ||
| Turnout | 33,057 | 79.9 | +0.4 | ||
| Registered electors | 41,386 | ||||
| Liberal Democrat hold | Swing | ||||
Elections in the 1980s
| Party | Candidate | Votes | % | ± | |
|---|---|---|---|---|---|
| Liberal | Alex Carlile | 14,729 | 46.6 | +3.3 | |
| Conservative | David Evans | 12,171 | 38.5 | −2.6 | |
| Labour | Edward Llewellyn-Jones | 3,304 | 10.5 | +1.9 | |
| Plaid Cymru | Carl Clowes | 1,412 | 4.5 | −0.8 | |
| Majority | 2,558 | 8.1 | +5.8 | ||
| Turnout | 31,616 | 79.4 | +0.2 | ||
| Registered electors | 39,808 | ||||
| Liberal hold | Swing | ||||
| Party | Candidate | Votes | % | ± | |
|---|---|---|---|---|---|
| Liberal | Alex Carlile | 12,863 | 43.3 | +8.4 | |
| Conservative | Delwyn Williams | 12,195 | 41.1 | +0.8 | |
| Labour | Joe Wilson | 2,550 | 8.6 | −7.7 | |
| Plaid Cymru | Carl Clowes | 1,585 | 5.3 | −3.2 | |
| Independent | David Rowlands | 487 | 1.6 | N/A | |
| Majority | 668 | 2.3 | N/A | ||
| Turnout | 29,680 | 79.2 | −2.2 | ||
| Registered electors | 37,474 | ||||
| Liberal gain from Conservative | Swing | ||||
In 1983 this was Labour's worst performance in Wales and the only seat where Labour won less than 12.5% and lost their £150 deposit. The threshold for retaining deposits was lowered to 5% in 1985.
Elections in the 1970s
| Party | Candidate | Votes | % | ± | |
|---|---|---|---|---|---|
| Conservative | Delwyn Williams | 11,751 | 40.3 | +11.9 | |
| Liberal | Emlyn Hooson | 10,158 | 34.9 | -8.2 | |
| Labour | J. Price | 4,751 | 16.3 | -2.9 | |
| Plaid Cymru | C. Clowes | 2,474 | 8.5 | -0.8 | |
| Majority | 1,593 | 5.5 | N/A | ||
| Turnout | 29,134 | 81.4 | +1.5 | ||
| Registered electors | 35,786 | ||||
| Conservative gain from Liberal | Swing | ||||
| Party | Candidate | Votes | % | ± | |
|---|---|---|---|---|---|
| Liberal | Emlyn Hooson | 11,280 | 43.1 | -2.3 | |
| Conservative | W. R. C. Williams-Wynne | 7,421 | 28.4 | -0.5 | |
| Labour | P. W. Harris | 5,031 | 19.2 | +1.4 | |
| Plaid Cymru | A. P. Jones | 2,440 | 9.3 | +1.0 | |
| Majority | 3,859 | 14.7 | -2.2 | ||
| Turnout | 26,172 | 77.9 | -4.7 | ||
| Registered electors | 33,583 | ||||
| Liberal hold | Swing | ||||
| Party | Candidate | Votes | % | ± | |
|---|---|---|---|---|---|
| Liberal | Emlyn Hooson | 12,495 | 45.4 | +7.0 | |
| Conservative | W. R. C. Williams-Wynne | 7,844 | 28.5 | -1.2 | |
| Labour | P. W. Harris | 4,888 | 17.8 | -2.3 | |
| Plaid Cymru | A. P. Jones | 2,274 | 8.3 | -3.5 | |
| Majority | 4,651 | 16.9 | +8.2 | ||
| Turnout | 27,501 | 82.6 | +0.3 | ||
| Registered electors | 33,303 | ||||
| Liberal hold | Swing | ||||
| Party | Candidate | Votes | % | ± | |
|---|---|---|---|---|---|
| Liberal | Emlyn Hooson | 10,202 | 38.4 | -3.1 | |
| Conservative | Delwyn Williams | 7,891 | 29.7 | +2.3 | |
| Labour | David W. Thomas | 5,335 | 20.1 | -3.7 | |
| Plaid Cymru | Edward Millward | 3,145 | 11.8 | +4.4 | |
| Majority | 2,311 | 8.7 | -5.4 | ||
| Turnout | 26,573 | 82.3 | -0.5 | ||
| Registered electors | 32,304 | ||||
| Liberal hold | Swing | ||||
Elections in the 1960s
| Party | Candidate | Votes | % | ± | |
|---|---|---|---|---|---|
| Liberal | Emlyn Hooson | 10,278 | 41.5 | -0.8 | |
| Conservative | Jerry Wiggin | 6,784 | 27.4 | +0.7 | |
| Labour | Gwyn M. Evans | 5,891 | 23.8 | +1.3 | |
| Plaid Cymru | Trefor Edwards | 1,841 | 7.4 | -1.1 | |
| Majority | 3,494 | 14.1 | -1.5 | ||
| Turnout | 24,794 | 82.8 | -1.3 | ||
| Registered electors | 29,951 | ||||
| Liberal hold | Swing | ||||
| Party | Candidate | Votes | % | ± | |
|---|---|---|---|---|---|
| Liberal | Emlyn Hooson | 10,738 | 42.3 | +0.3 | |
| Conservative | Jerry Wiggin | 6,768 | 26.7 | -4.7 | |
| Labour | Gwyn M. Evans | 5,696 | 22.5 | -4.1 | |
| Plaid Cymru | Islwyn Ffowc Elis | 2,167 | 8.5 | N/A | |
| Majority | 3,970 | 15.6 | +4.9 | ||
| Turnout | 25,369 | 84.1 | +0.3 | ||
| Registered electors | 30,155 | ||||
| Liberal hold | Swing | ||||
| Party | Candidate | Votes | % | ± | |
|---|---|---|---|---|---|
| Liberal | Emlyn Hooson | 13,181 | 51.3 | +9.2 | |
| Conservative | Robert H. Dawson | 5,632 | 21.9 | -9.4 | |
| Labour | Tudor Davies | 5,299 | 20.6 | -6.0 | |
| Plaid Cymru | Islwyn Ffowc Elis | 1,594 | 6.2 | N/A | |
| Majority | 7,549 | 29.4 | N/A | ||
| Turnout | 25,706 | 85.1 | +1.3 | ||
| Registered electors | 30,202 | ||||
| Liberal hold | Swing | ||||
Elections in the 1950s
| Party | Candidate | Votes | % | ± | |
|---|---|---|---|---|---|
| Liberal | Clement Davies | 10,970 | 42.0 | -26.0 | |
| Conservative | Frank Leslie Morgan | 8,176 | 31.3 | N/A | |
| Labour | David Caradog Jones | 6,950 | 26.6 | -5.4 | |
| Majority | 2,794 | 10.7 | -25.4 | ||
| Turnout | 26,096 | 83.8 | +10.2 | ||
| Registered electors | 31,152 | ||||
| Liberal hold | Swing | ||||
| Party | Candidate | Votes | % | ± | |
|---|---|---|---|---|---|
| Liberal | Clement Davies | 16,021 | 68.0 | -0.5 | |
| Labour | David Caradog Jones | 7,521 | 32.0 | +0.5 | |
| Majority | 8,500 | 36.1 | -0.9 | ||
| Turnout | 23,542 | 73.6 | -3.3 | ||
| Registered electors | 31,983 | ||||
| Liberal hold | Swing | -0.5 | |||
| Party | Candidate | Votes | % | ± | |
|---|---|---|---|---|---|
| Liberal | Clement Davies | 17,075 | 68.5 | +18.5 | |
| Labour | David Caradog Jones | 7,854 | 31.5 | +9.0 | |
| Majority | 9,221 | 37.0 | +13.4 | ||
| Turnout | 24,929 | 76.9 | -12.0 | ||
| Registered electors | 32,423 | ||||
| Liberal hold | Swing | ||||
| Party | Candidate | Votes | % | ± | |
|---|---|---|---|---|---|
| Liberal | Clement Davies | 14,401 | 50.0 | -6.3 | |
| Conservative | Harry West | 7,621 | 26.5 | -17.2 | |
| Labour | John David Williams | 6,760 | 23.5 | N/A | |
| Majority | 6,780 | 23.6 | +8.6 | ||
| Turnout | 28,782 | 88.9 | +11.5 | ||
| Registered electors | 32,372 | ||||
| Liberal hold | Swing | ||||
Elections in the 1940s
| Party | Candidate | Votes | % | ± | |
|---|---|---|---|---|---|
| Liberal | Clement Davies | 14,018 | 56.3 | N/A | |
| Conservative | Philip Owen | 10,895 | 43.7 | N/A | |
| Majority | 3,123 | 15.0 | N/A | ||
| Turnout | 24,913 | 77.4 | N/A | ||
| Registered electors | 32,180 | ||||
| Liberal gain from Liberal National | Swing | N/A | |||
Elections in the 1930s
| Party | Candidate | Votes | % | ± | |
|---|---|---|---|---|---|
| Liberal National | Clement Davies | Unopposed | |||
| Registered electors | 30,943 | ||||
| Liberal National hold | |||||
| Party | Candidate | Votes | % | ± | |
|---|---|---|---|---|---|
| Liberal National | Clement Davies | Unopposed | |||
| Registered electors | 30,120 | ||||
| Liberal National hold | |||||
Elections in the 1920s
| Party | Candidate | Votes | % | ± | |
|---|---|---|---|---|---|
| Liberal | Clement Davies | 12,779 | 46.5 | -30.8 | |
| Unionist | John Murray Naylor | 10,651 | 38.7 | N/A | |
| Labour | John Evans | 4,069 | 14.8 | -7.9 | |
| Majority | 2,128 | 7.8 | -22.9 | ||
| Turnout | 27,499 | 88.3 | +8.9 | ||
| Registered electors | 31,142 | ||||
| Liberal hold | Swing | -11.4 | |||
| Party | Candidate | Votes | % | ± | |
|---|---|---|---|---|---|
| Liberal | David Davies | 14,942 | 77.3 | N/A | |
| Labour | Arthur Davies | 4,384 | 22.7 | N/A | |
| Majority | 10,558 | 54.6 | N/A | ||
| Turnout | 19,326 | 79.4 | N/A | ||
| Registered electors | 24,338 | ||||
| Liberal hold | Swing | N/A | |||
| Party | Candidate | Votes | % | ± | |
|---|---|---|---|---|---|
| Liberal | David Davies | Unopposed | |||
| Registered electors | 24,126 | ||||
| Liberal hold | |||||
| Party | Candidate | Votes | % | ± | |
|---|---|---|---|---|---|
| Liberal | David Davies | Unopposed | |||
| Registered electors | 23,802 | ||||
| Liberal hold | |||||
Elections in the 1910s
| Party | Candidate | Votes | % | ± | |
|---|---|---|---|---|---|
| Liberal | David Davies | Unopposed | |||
| Registered electors | 24,949 | ||||
| Liberal hold | |||||
- Davies was endorsed by the Coalition Government, but refused to accept the coupon.
| Party | Candidate | Votes | % | ± | |
|---|---|---|---|---|---|
| Liberal | David Davies | Unopposed | |||
| Registered electors | 7,928 | ||||
| Liberal hold | |||||
| Party | Candidate | Votes | % | ± | |
|---|---|---|---|---|---|
| Liberal | David Davies | 4,369 | 61.8 | N/A | |
| Conservative | Arthur Williams-Wynn | 2,697 | 38.2 | N/A | |
| Majority | 1,672 | 23.7 | N/A | ||
| Turnout | 7,066 | 89.1 | N/A | ||
| Registered electors | 7,928 | ||||
| Liberal hold | Swing | N/A | |||
Elections in the 1900s
| Party | Candidate | Votes | % | ± | |
|---|---|---|---|---|---|
| Liberal | David Davies | Unopposed | |||
| Registered electors | |||||
| Liberal hold | |||||
| Party | Candidate | Votes | % | ± | |
|---|---|---|---|---|---|
| Liberal | Arthur Humphreys-Owen | 3,482 | 52.0 | +1.8 | |
| Conservative | Watkin Williams-Wynn | 3,218 | 48.0 | -1.8 | |
| Majority | 264 | 4.0 | +3.6 | ||
| Turnout | 6,700 | 84.6 | -1.2 | ||
| Registered electors | 7,915 | ||||
| Liberal hold | Swing | +1.8 | |||
Elections in the 19th Century
Elections in the 1890s
| Party | Candidate | Votes | % | ± | |
|---|---|---|---|---|---|
| Liberal | Arthur Humphreys-Owen | 3,442 | 50.2 | -6.1 | |
| Conservative | Watkin Williams-Wynn | 3,415 | 49.8 | +6.1 | |
| Majority | 27 | 0.4 | -12.2 | ||
| Turnout | 6,857 | 85.8 | +12.5 | ||
| Registered electors | 7,989 | ||||
| Liberal hold | Swing | -6.1 | |||
| Party | Candidate | Votes | % | ± | |
|---|---|---|---|---|---|
| Liberal | Arthur Humphreys-Owen | 3,440 | 51.7 | -4.6 | |
| Conservative | Watkin Williams-Wynn | 3,215 | 48.3 | +4.6 | |
| Majority | 225 | 3.4 | -9.2 | ||
| Turnout | 6,655 | 82.2 | +8.9 | ||
| Registered electors | 8,092 | ||||
| Liberal hold | Swing | -4.6 | |||
- Caused by Rendel's elevation to the peerage.
| Party | Candidate | Votes | % | ± | |
|---|---|---|---|---|---|
| Liberal | Stuart Rendel | 3,662 | 56.3 | +2.2 | |
| Conservative | Devereux Herbert Mytton[25] | 2,847 | 43.7 | -2.2 | |
| Majority | 815 | 12.6 | +4.4 | ||
| Turnout | 6,509 | 73.3 | -5.8 | ||
| Registered electors | 8,880 | ||||
| Liberal hold | Swing | +2.2 | |||
Elections in the 1880s
| Party | Candidate | Votes | % | ± | |
|---|---|---|---|---|---|
| Liberal | Stuart Rendel | 3,799 | 54.1 | -0.3 | |
| Conservative | Devereux Herbert Mytton[25] | 3,220 | 45.9 | +0.3 | |
| Majority | 579 | 8.2 | -0.6 | ||
| Turnout | 7,019 | 79.1 | -4.7 | ||
| Registered electors | 8,870 | ||||
| Liberal hold | Swing | -0.3 | |||
| Party | Candidate | Votes | % | ± | |
|---|---|---|---|---|---|
| Liberal | Stuart Rendel | 4,044 | 54.4 | +2.2 | |
| Conservative | Charles Williams-Wynn | 3,389 | 45.6 | -2.2 | |
| Majority | 655 | 8.8 | +4.3 | ||
| Turnout | 7,433 | 83.8 | +3.0 | ||
| Registered electors | 8,870 | ||||
| Liberal hold | Swing | +2.2 | |||
| Party | Candidate | Votes | % | ± | |
|---|---|---|---|---|---|
| Liberal | Stuart Rendel | 2,232 | 52.2 | N/A | |
| Conservative | Charles Williams-Wynn | 2,041 | 47.8 | N/A | |
| Majority | 191 | 4.5 | N/A | ||
| Turnout | 4,273 | 80.8 | N/A | ||
| Registered electors | 5,291 | ||||
| Liberal gain from Conservative | Swing | N/A | |||
Elections in the 1870s
| Party | Candidate | Votes | % | ± | |
|---|---|---|---|---|---|
| Conservative | Charles Williams-Wynn | Unopposed | |||
| Registered electors | 5,014 | ||||
| Conservative hold | |||||
Elections in the 1860s
| Party | Candidate | Votes | % | ± | |
|---|---|---|---|---|---|
| Conservative | Charles Williams-Wynn | Unopposed | |||
| Registered electors | 4,810 | ||||
| Conservative hold | |||||
| Party | Candidate | Votes | % | ± | |
|---|---|---|---|---|---|
| Conservative | Charles Williams-Wynn | Unopposed | |||
| Registered electors | 3,339 | ||||
| Conservative hold | |||||
| Party | Candidate | Votes | % | ± | |
|---|---|---|---|---|---|
| Conservative | Charles Williams-Wynn | 1,269 | 57.0 | ||
| Liberal | Sudeley Hanbury-Tracy[27] | 959 | 43.0 | ||
| Majority | 310 | 13.9 | |||
| Turnout | 2,228 | 83.3 | |||
| Registered electors | 2,675 | ||||
| Conservative hold | Swing | ||||
- Caused by Williams-Wynn's death.
Elections in the 1850s
| Party | Candidate | Votes | % | ± | |
|---|---|---|---|---|---|
| Conservative | Herbert Watkin Williams-Wynn | Unopposed | |||
| Registered electors | 2,723 | ||||
| Conservative hold | |||||
| Party | Candidate | Votes | % | ± | |
|---|---|---|---|---|---|
| Conservative | Herbert Watkin Williams-Wynn | Unopposed | |||
| Registered electors | 2,872 | ||||
| Conservative hold | |||||
| Party | Candidate | Votes | % | ± | |
|---|---|---|---|---|---|
| Conservative | Herbert Watkin Williams-Wynn | Unopposed | |||
| Registered electors | 2,986 | ||||
| Conservative hold | |||||
| Party | Candidate | Votes | % | ± | |
|---|---|---|---|---|---|
| Conservative | Herbert Watkin Williams-Wynn | Unopposed | |||
| Conservative hold | |||||
- Caused by Williams-Wynn's death.
See also
Notes and references
- ↑ "Beyond 20/20 WDS - Table view". 2011 Electorate Figures. StatsWales. 1 December 2010. Retrieved 13 March 2011.
- ↑ "It's All Change For MPs, Political map to be transformed". Shropshire Star. 13 September 2016. p. 1. Report by Mark Andrews.
- ↑ "Former MP urges re-think on move". Shropshire Star. 17 September 2016. p. 16. Report based on criticism of proposals by former Montgomeryshire MP Delwyn Williams.
- 1 2 3 4 5 6 7 8 "History of Parliament". Retrieved 2011-08-30.
- 1 2 3 4 5 6 7 8 9 10 "History of Parliament". Retrieved 2011-08-30.
- ↑ Leigh Rayment's Historical List of MPs – Constituencies beginning with "M" (part 3)
- ↑ "Statement of Persons Nominated and Notice of Poll" (PDF). Powys County Council. 11 May 2017. Retrieved 6 June 2017.
- ↑ "Montgomeryshire parliamentary constituency - Election 2017". BBC News. Retrieved 9 June 2017.
- ↑ "Election Data 2015". Electoral Calculus. Archived from the original on 17 October 2015. Retrieved 17 October 2015.
- ↑ "Powys election results". 2015 General Election results. Powys County Council. Retrieved 20 September 2015.
- ↑ "Archived copy". Archived from the original on 2014-07-06. Retrieved 2014-07-03.
- ↑ "4587404460". Archived from the original on 12 March 2015. Retrieved 13 February 2015.
- ↑ "Labour reveal Martyn Singleton as candidate". Mywelshpool.co.uk. 2015-03-31. Retrieved 2017-09-19.
- ↑ "Labour reveal Martyn Singleton as candidate". Mywelshpool.co.uk. Retrieved 2017-09-19.
- ↑ "Election Data 2010". Electoral Calculus. Archived from the original on 26 July 2013. Retrieved 17 October 2015.
- ↑ "BBC NEWS – Election 2010 – Montgomeryshire". BBC News.
- ↑ "Election Data 2005". Electoral Calculus. Archived from the original on 15 October 2011. Retrieved 18 October 2015.
- ↑ "Election Data 2001". Electoral Calculus. Archived from the original on 15 October 2011. Retrieved 18 October 2015.
- ↑ "Election Data 1997". Electoral Calculus. Archived from the original on 15 October 2011. Retrieved 18 October 2015.
- ↑ "Election Data 1992". Electoral Calculus. Archived from the original on 15 October 2011. Retrieved 18 October 2015.
- ↑ "Politics Resources". Election 1992. Politics Resources. 9 April 1992. Retrieved 2010-12-06.
- ↑ "Election Data 1987". Electoral Calculus. Archived from the original on 15 October 2011. Retrieved 18 October 2015.
- ↑ "Election Data 1983". Electoral Calculus. Archived from the original on 15 October 2011. Retrieved 18 October 2015.
- 1 2 3 4 5 6 7 Craig, FWS, ed. (1974). British Parliamentary Election Results: 1885-1918. London: Macmillan Press. ISBN 9781349022984.
- 1 2 Lythgoe, Darrin. "Devereux Herbert Mytton". Tathamfamilyhistory. Retrieved 12 November 2017.
- 1 2 3 4 5 6 7 8 Craig, F. W. S., ed. (1977). British Parliamentary Election Results 1832-1885 (e-book)
|format=requires|url=(help) (1st ed.). London: Macmillan Press. ISBN 978-1-349-02349-3. - ↑ "Montgomeryshire". Derby Mercury. 9 July 1862. p. 8. Retrieved 6 March 2018 – via British Newspaper Archive. (Subscription required (help)).
Further reading
- Robert Beatson, A Chronological Register of Both Houses of Parliament (London: Longman, Hurst, Res & Orme, 1807)
- D Brunton & D H Pennington, Members of the Long Parliament (London: George Allen & Unwin, 1954)
- Cobbett's Parliamentary history of England, from the Norman Conquest in 1066 to the year 1803 (London: Thomas Hansard, 1808)
- F W S Craig, British Parliamentary Election Results 1832-1885 (2nd edition, Aldershot: Parliamentary Research Services, 1989)
- Robert Waller, The Almanac of British Politics (1st edition, London: Croom Helm, 1983)
External links
- Politics Resources (Election results from 1922 onwards)
- Electoral Calculus (Election results from 1955 onwards)
- 2017 Election House Of Commons Library 2017 Election report
- A Vision Of Britain Through Time (Constituency elector numbers)