Kensington (UK Parliament constituency)
| Kensington | |
|---|---|
|
Borough constituency for the House of Commons | |
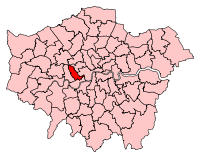 Boundary of Kensington in Greater London. | |
| County | Greater London |
| Electorate | 62,784 (December 2010)[1] |
| Current constituency | |
| Created | 2010 |
| Member of parliament | Emma Dent Coad (Labour) |
| Created from | Kensington and Chelsea |
| 1974–1997 | |
| Replaced by | Kensington and Chelsea |
| Created from | Kensington North & Kensington South |
| Overlaps | |
| European Parliament constituency | London |
Kensington is a constituency[n 1] in Greater London which first existed between 1974 and 1997, and then was recreated in 2010.[n 2] Since 2017, it has been represented in the House of Commons of the UK Parliament by Emma Dent Coad of the Labour Party.
In the snap June 2017 general election Dent Coad gained the seat from incumbent Conservative Victoria Borwick by the slenderest margin in England, 20 votes, and Kensington which had previously existed (in its first creation) between 1974 and 1997 gained its first Labour MP.[2]
Boundaries
The constituency formed for the 2010 election comprises the northern and central parts of the Royal Borough of Kensington and Chelsea in and around Kensington and has electoral wards:
- Abingdon, Brompton, Campden, Colville, Courtfield, Earls Court, Golborne, Holland, Norland, Notting Dale, Pembridge, Queen's Gate, and St Helens[n 3]
From 1974 to 1983 the constituency comprised electoral wards:
- Golborne, Holland, Norland, Pembridge, Queen's Gate and St Charles.
From 1983 to 1997 the constituency comprised electoral wards:
- Avondale, Campden, Colville, Golborne, Holland, Kelfield, Norland, Pembridge, Queen's Gate and St Charles.[3]
History
First creation
The first incarnation of a Kensington constituency in Westminster was for the February 1974 general election, derived from the fairly safe Labour seat of Kensington North, and the overwhelmingly Conservative Kensington South; this was abolished for the 1997 general election. The seat was mostly replaced by Regent's Park and Kensington North which was, until its 2010 abolition, represented by Labour MPs, specifically, won three times during the Blair Ministry, and partially replaced by Kensington and Chelsea which was held by Malcolm Rifkind (Conservative) until his resignation at the 2015 general election.
- Summary of results (first creation)
The old seat returned Conservative MPs from 1974 up to and including its last general election in 1992. At its sole by-election in 1988 the seat was won by its smallest majority, a highly marginal 3.4% – a by-election which saw a majority turnout and a Labour splinter party candidate, for the Social Democratic Party (UK, 1988) achieve fourth place attracting 5% of the vote yet standing in the year of the formal amalgamation of the main SDP splinter group with the Liberal Party to form the Liberal Democrats who stood as the Social and Liberal Democrats and seven years after the formation of the official SDP-Liberal Alliance.
Second creation
The constituency was recreated by adopting the Fifth Periodic Review of Westminster constituencies of the Boundary Commission at the 2010 general election, combining elements of the two constituencies.
- Summary of results (second creation)
The 2015 result was a narrower result than 2010 and gave the seat the 126th most marginal majority of the Conservative Party's 331 seats by percentage of majority.[4] The runner-up party remained the Labour Party and the Liberal Democrats' share of the vote fell by 13.9% to 5.6% of votes cast.
In the June 2017 election, three recounts occurred, the first two producing extremely close results with the latter producing a Labour majority of only 20+ votes. After the two recounts due to fatigue among the staff the counting was suspended to allow them to "rest and recuperate". The third recount gave Labour a majority of 20, the first time the constituency had become a Labour seat since its creation,[5] and makes it the Labour Party's most vulnerable seat.[6]
Constituency profile
Kensington is mostly residential — housing varies between the expensive apartments with manicured gardens squares or terraces of South Kensington, that has some of the most exclusive real estate in the world and, by contrast, North Kensington and Ladbroke Grove have, for the most part, dense social housing, tower blocks in output areas with high rankings in the 2000-compiled Index of Multiple Deprivation.[7] Kensington High Street is an upmarket shopping hub, Kensington Palace is the residence of members of the Royal Family, and Kensington Palace Gardens is the site of many embassies and a few private residences of very affluent homeowners. South Kensington also borders Hyde Park and includes the Science Museum, the Natural History Museum and the Victoria and Albert.
Earls Court, Brompton, Holland Park and Notting Hill have their own characters. Earls Court is less affluent than its neighbours. While it is undergoing rapid gentrification and includes its own areas for the super-rich, there are still old hotels and bedsits around the site of the former Earls Court Exhibition Centre, which extends into the marginal Hammersmith seat. Notting Hill is an affluent, highly cosmopolitan area which hosts the Notting Hill Carnival, led by the area's African-Caribbean community. It fell on hard times in the twentieth century, being associated with low-rent flats and multiple-occupancy homes, but has since been gentrified. Old Victorian private houses in these areas can be as high in price as those in Fulham.[8]
Members of Parliament
| Election | Member[9] | Party | |
|---|---|---|---|
| Feb 1974 | Sir Brandon Rhys-Williams | Conservative | |
| 1988 by-election | Dudley Fishburn | Conservative | |
| 1997 | constituency abolished: see Kensington and Chelsea | ||
| 2010 | Sir Malcolm Rifkind | Conservative | |
| 2015 | Victoria Borwick | Conservative | |
| 2017 | Emma Dent Coad | Labour | |
Election results
Elections in the 2010s
Kensington was the last constituency to be declared in the 2017 general election.[10] The result was extremely close in Kensington, which had been considered a safe Conservative seat. After three counts on 8 and 9 June, which appeared to show Labour majorities of between 36 and 50, counting was suspended due to fatigue.[10] The result was announced later on 9 June.[10]
| Party | Candidate | Votes | % | ± | |
|---|---|---|---|---|---|
| Labour | Emma Dent Coad | 16,333 | 42.2 | +11.1 | |
| Conservative | Victoria Borwick | 16,313 | 42.2 | -10.1 | |
| Liberal Democrat | Annabel Mullin | 4,724 | 12.2 | +6.6 | |
| Green | Jennifer Nadel | 767 | 2.0 | -3.1 | |
| Renew | James Torrance | 393 | 1.0 | N/A | |
| Independent | Peter Marshall | 98 | 0.3 | N/A | |
| Alliance for Green Socialism | John Lloyd | 49 | 0.1 | -0.2 | |
| Majority | 20 | 0.05 | N/A | ||
| Turnout | 38,677 | 63.8 | +6.8 | ||
| Registered electors | 60,588 | ||||
| Labour gain from Conservative | Swing | +10.6 | |||
| Party | Candidate | Votes | % | ± | |
|---|---|---|---|---|---|
| Conservative | Victoria Borwick[14] | 18,199 | 52.3 | +2.2 | |
| Labour | Rod Abouharb | 10,838 | 31.1 | +5.6 | |
| Liberal Democrat | Robin McGhee | 1,962 | 5.6 | −13.9 | |
| Green | Robina Rose | 1,765 | 5.1 | +2.9 | |
| UKIP | Jack Bovill[15] | 1,557 | 4.5 | +2.3 | |
| CISTA | Tony Auguste | 211 | 0.6 | +0.6 | |
| Animal Welfare | Andrew Knight | 158 | 0.5 | +0.5 | |
| Alliance for Green Socialism | Toby Abse | 115 | 0.3 | −0.2 | |
| New Independent Centralists | Roland Courtenay | 23 | 0.1 | +0.1 | |
| Majority | 7,361 | 21.1 | −3.4 | ||
| Turnout | 34,828 | 57.0 | +3.7 | ||
| Registered electors | 61,133 | ||||
| Conservative hold | Swing | −1.7 | |||
| Party | Candidate | Votes | % | ± | |
|---|---|---|---|---|---|
| Conservative | Sir Malcolm Rifkind | 17,595 | 50.1 | N/A | |
| Labour | Sam Gurney | 8,979 | 25.5 | N/A | |
| Liberal Democrat | Robin Meltzer | 6,872 | 19.6 | N/A | |
| UKIP | Caroline Pearson[17] | 754 | 2.1 | N/A | |
| Green | Melan Ebrahimi-Fardouée | 753 | 2.1 | N/A | |
| Alliance for Green Socialism | Eddie Adams | 197 | 0.6 | N/A | |
| Majority | 8,616 | 24.5 | N/A | ||
| Turnout | 35,150 | 53.3 | N/A | ||
| Registered electors | 65,975 | ||||
| Conservative win (new seat) | |||||
Elections in the 1990s
| Party | Candidate | Votes | % | ± | |
|---|---|---|---|---|---|
| Conservative | Dudley Fishburn | 15,540 | 50.3 | +2.8 | |
| Labour | Patricia Holmes | 11,992 | 38.8 | +5.6 | |
| Liberal Democrat | Christopher Shirley | 2,770 | 9.0 | −8.3 | |
| Green | Ajay Burlingham-Johnson | 415 | 1.3 | −1.4 | |
| Natural Law | Anthony W. Hardy | 90 | 0.3 | N/A | |
| Anti-Federalist League | Anne Bulloch | 71 | 0.2 | N/A | |
| Majority | 3,548 | 11.5 | -2.76 | ||
| Turnout | 30,878 | 73.3 | +8.6 | ||
| Registered electors | 42,129 | ||||
| Conservative hold | Swing | −1.4 | |||
Elections in the 1980s
| Party | Candidate | Votes | % | ± | |
|---|---|---|---|---|---|
| Conservative | Dudley Fishburn | 9,829 | 41.59 | −5.9 | |
| Labour | Patricia Holmes | 9,014 | 38.14 | +4.9 | |
| Social and Liberal Democrats | William Goodhart | 2,546 | 10.77 | −6.5 | |
| SDP | John Martin | 1,190 | 5.04 | N/A | |
| Green | Phylip Hobson | 572 | 2.42 | +0.7 | |
| Rainbow Alliance – Payne & Pleasure | Cynthia Payne | 193 | 0.82 | N/A | |
| Monster Raving Loony | Screaming Lord Sutch | 61 | 0.26 | N/A | |
| London Class War Candidate | John Duignan | 60 | 0.25 | N/A | |
| Anti Left-Wing Fascist | Brian Goodier | 31 | 0.13 | N/A | |
| Free Trade Liberal – Europe Out! | Thomas McDermott | 31 | 0.13 | N/A | |
| Fair Wealth & Health | Roy Edey | 30 | 0.13 | N/A | |
| Leveller Party | William Scola | 27 | 0.11 | N/A | |
| Anti-Yuppie | John Crowley | 24 | 0.10 | N/A | |
| Peace – Stop ITN Manipulation | John Connell | 20 | 0.08 | N/A | |
| Independent Janata Party | Kailash Trivedi | 5 | 0.02 | N/A | |
| Majority | 815 | 3.40 | -10.86 | ||
| Turnout | 23,633 | 51.6 | -13.1 | ||
| Registered electors | 45,830 | ||||
| Conservative hold | Swing | -5.40 | |||
| Party | Candidate | Votes | % | ± | |
|---|---|---|---|---|---|
| Conservative | Brandon Rhys-Williams | 14,818 | 47.5 | +1.5 | |
| Labour | Benjamin Bousquet | 10,371 | 33.3 | +3.8 | |
| Social Democratic | William Goodhart | 5,379 | 17.2 | −4.9 | |
| Green | Roger Shorter | 528 | 1.7 | −0.4 | |
| Humanist | Lana Carrick | 65 | 0.2 | N/A | |
| Public Independent Plaintiff Party | Muriel Hughes | 30 | 0.1 | N/A | |
| Majority | 4,447 | 14.26 | -2.14 | ||
| Turnout | 31,191 | 64.7 | +2.4 | ||
| Registered electors | 48,212 | ||||
| Conservative hold | Swing | ||||
| Party | Candidate | Votes | % | ± | |
|---|---|---|---|---|---|
| Conservative | Brandon Rhys-Williams | 14,274 | 46.0 | -5.3 | |
| Labour | Benjamin Bousquet | 9,173 | 29.5 | -5.7 | |
| Social Democratic | William Goodhart | 6,873 | 22.1 | N/A | |
| Ecology | Jonathon Porritt | 649 | 2.1 | +0.0 | |
| Independent | T.F. Knight | 86 | 0.3 | N/A | |
| Majority | 5,101 | 16.4 | +0.3 | ||
| Turnout | 31,055 | 62.3 | -2.3 | ||
| Registered electors | 49,584 | ||||
| Conservative hold | Swing | ||||
Elections in the 1970s
| Party | Candidate | Votes | % | ± | |
|---|---|---|---|---|---|
| Conservative | Brandon Rhys-Williams | 17,361 | 51.3 | +6.1 | |
| Labour | P Holmes | 11,898 | 35.2 | -4.4 | |
| Liberal | B Vincent-Emery | 3,537 | 10.5 | -4.7 | |
| Ecology | Nicholas Albery[22] | 698 | 2.1 | N/A | |
| National Front | C Hopewell | 356 | 1.1 | N/A | |
| Majority | 5,463 | 16.1 | +10.5 | ||
| Turnout | 33,850 | 64.6 | +8.2 | ||
| Registered electors | 52,396 | ||||
| Conservative hold | Swing | ||||
| Party | Candidate | Votes | % | ± | |
|---|---|---|---|---|---|
| Conservative | Brandon Rhys-Williams | 15,562 | 45.2 | −0.9 | |
| Labour | John Tilley | 13,645 | 39.6 | +6.4 | |
| Liberal | R. Cohen | 5,236 | 15.2 | −5.5 | |
| Majority | 1,917 | 5.6 | -7.2 | ||
| Turnout | 34,443 | 56.4 | −9.4 | ||
| Registered electors | 61,105 | ||||
| Conservative hold | Swing | ||||
| Party | Candidate | Votes | % | ± | |
|---|---|---|---|---|---|
| Conservative | Brandon Rhys-Williams | 18,425 | 46.1 | N/A | |
| Labour | John Tilley | 13,293 | 33.2 | N/A | |
| Liberal | Robert LeFever[23] | 8,270 | 20.7 | N/A | |
| Majority | 5,132 | 12.8 | N/A | ||
| Turnout | 39,988 | 65.8 | N/A | ||
| Registered electors | 60,818 | ||||
| Conservative win (new seat) | |||||
See also
Notes and references
- Notes
- ↑ A borough constituency (for the purposes of election expenses and type of returning officer)
- ↑ As with all constituencies, the constituency elects one Member of Parliament (MP) by the first past the post system of election at least every five years.
- ↑ The remaining electoral wards in the Royal Borough involved: Cremorne, Hans Town, Redcliffe, Royal Hospital, and Stanley were lost to the cross-borough Chelsea and Fulham.
- References
- ↑ "Electorate Figures – Boundary Commission for England". 2011 Electorate Figures. Boundary Commission for England. 4 March 2011. Archived from the original on 6 November 2010. Retrieved 13 March 2011.
- ↑ "Labour wins Kensington seat for first time ever". The Independent. 9 June 2017. Retrieved 9 June 2017.
- ↑ Crewe, Ivor (1983). British Parliament Constituencies – a statistical compendium. faber and faber. ISBN 0-571-13236-7.
- ↑ List of Conservative MPs elected in 2015 by % majority UK Political.info. Retrieved 29 January 2017
- ↑ "The end of the election has been delayed". 9 June 2017.
- ↑ "Labour Target Seats 2022". Election Polling. Retrieved 14 June 2017.
- ↑ "Local statistics – Office for National Statistics". neighbourhood.statistics.gov.uk.
- ↑ "Area and Property Guide for W14". mouseprice.com.
- ↑ Leigh Rayment's Historical List of MPs – Constituencies beginning with "K" (part 1)
- 1 2 3 4 "Kensington parliamentary constituency". BBC News. BBC. Retrieved 10 August 2017.
- ↑ http://researchbriefings.files.parliament.uk/documents/CBP-7979/CBP-7979.pdf
- ↑ "Election Data 2015". Electoral Calculus. Archived from the original on 17 October 2015. Retrieved 17 October 2015.
- ↑ "General Election May 2015 – Kensington constituency". rbkc.gov.uk.
- ↑ Rawlinson, Kevin (13 March 2015). "Victoria Borwick selected as Conservative candidate for Kensington" – via The Guardian.
- ↑ "Jack Bovill for Hammersmith in the 2017 General Election". Who Can I Vote For? by Democracy Club.
- ↑ "Election Data 2010". Electoral Calculus. Archived from the original on 26 July 2013. Retrieved 17 October 2015.
- ↑ Move over Sarah and SamCam ... step up Lady Caroline of UKIP Daily Mail, 14 April 2010
- ↑ "Election Data 1992". Electoral Calculus. Archived from the original on 15 October 2011. Retrieved 18 October 2015.
- ↑ Boothroyd, David. "Results of Byelections in the 1983-87 Parliament". United Kingdom Election Results. Retrieved 2015-09-19.
- ↑ "Election Data 1987". Electoral Calculus. Archived from the original on 15 October 2011. Retrieved 18 October 2015.
- ↑ "Election Data 1983". Electoral Calculus. Archived from the original on 15 October 2011. Retrieved 18 October 2015.
- ↑ "Obituary: Nicholas Albery". The Daily Telegraph. 13 June 2001. Retrieved 9 June 2014.
- ↑ "Election leaflet for Robert Lefever, Liberal candidate for Kensington, February 1974 general election". University of Warwick. Retrieved 9 June 2014.
External links
- Politics Resources (Election results from 1922 onwards)
- Electoral Calculus (Election results from 1955 onwards)