Exeter (UK Parliament constituency)
Coordinates: 50°43′19″N 3°32′02″W / 50.722°N 3.534°W
| Exeter | |
|---|---|
|
Borough constituency for the House of Commons | |
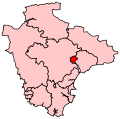 Boundary of Exeter in Devon. | |
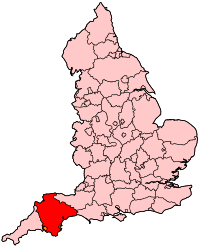 Location of Devon within England. | |
| County | Devon |
| Electorate | 76,796 (December 2010)[1] |
| Major settlements | Exeter |
| Current constituency | |
| Created | 1295 |
| Member of parliament | Ben Bradshaw (Labour) |
| Number of members |
1295–1885: Two 1885–present: One |
| Overlaps | |
| European Parliament constituency | South West England |
Exeter /ˈɛksətər/ is a constituency[n 1] composed of the cathedral city and county town of Devon represented in the House of Commons of the UK Parliament. [n 2] The constituency has had a history of representatives from 1900 of Conservative, Liberal Party, Independent and Labour representation and has been represented since 1997 by Ben Bradshaw of the Labour Party, who served in government as a Health Minister and as Secretary of State for Culture, Media and Sport (2009–2010).
Boundaries
1918-1950: The County Borough of Exeter.
1950-1974: As prior but with redrawn boundaries.
1974-1983: As prior but with redrawn boundaries.
1983-2010: The City of Exeter.
2010-present: The City of Exeter wards of Alphington, Cowick, Duryard, Exwick, Heavitree, Mincinglake, Newtown, Pennsylvania, Pinhoe, Polsloe, Priory, St David’s, St James, St Leonard’s, St Thomas, and Whipton and Barton.
The constituency covers most of the city of Exeter in Devon. Following a review of parliamentary representation in Devon by the Boundary Commission for England, which has increased the number of seats in the county from 11 to 12, two wards of the City of Exeter (St Loyes and Topsham) have been transferred to the neighbouring East Devon constituency.[2]
Members of Parliament
MPs 1295–1660
MPs 1660–1885
Two members
MPs since 1885
Elections
Elections in the 2010s
| Party | Candidate | Votes | % | ± | |
|---|---|---|---|---|---|
| Labour | Ben Bradshaw | 34,336 | 62.0 | +15.6 | |
| Conservative | James Taghdissian | 18,219 | 32.9 | −0.2 | |
| Liberal Democrat | Vanessa Newcombe | 1,562 | 2.8 | −1.5 | |
| Green | Joe Levy | 1,027 | 1.9 | −4.6 | |
| Independent | Jonathan West | 212 | 0.4 | N/A | |
| Independent | Jonathan Bishop | 67 | 0.1 | N/A | |
| Majority | 16,117 | 29.1 | +15.8 | ||
| Turnout | 55,423 | 71.7 | +1.5 | ||
| Labour hold | Swing | +7.9 | |||
| Party | Candidate | Votes | % | ± | |
|---|---|---|---|---|---|
| Labour | Ben Bradshaw | 25,062 | 46.4 | +8.2 | |
| Conservative | Dom Morris | 17,879 | 33.1 | +0.1 | |
| UKIP | Keith Crawford | 5,075 | 9.4 | +5.7 | |
| Green | Diana Moore | 3,491 | 6.5 | +4.9 | |
| Liberal Democrat | Joel Mason | 2,321 | 4.3 | −16.2 | |
| TUSC | Ed Potts | 190 | 0.4 | N/A | |
| Majority | 7,183 | 13.3 | +8.1 | ||
| Turnout | 54,018 | 70.2 | +2.5 | ||
| Labour hold | Swing | +4.0 | |||
| Party | Candidate | Votes | % | ± | |
|---|---|---|---|---|---|
| Labour | Ben Bradshaw | 19,942 | 38.2 | −4.0 | |
| Conservative | Hannah Foster | 17,221 | 33.0 | +8.1 | |
| Liberal Democrat | Graham Oakes | 10,581 | 20.3 | −0.7 | |
| UKIP | Keith Crawford | 1,930 | 3.7 | +0.3 | |
| Liberal | Chris Gale | 1,108 | 2.1 | −2.3 | |
| Green | Paula Black | 792 | 1.5 | −2.3 | |
| BNP | Robert Farmer | 673 | 1.3 | +1.3 | |
| Majority | 2,721 | 5.2 | |||
| Turnout | 52,247 | 67.7 | +3.4 | ||
| Labour hold | Swing | −6.0 | |||
Elections in the 2000s
| Party | Candidate | Votes | % | ± | |
|---|---|---|---|---|---|
| Labour | Ben Bradshaw | 22,619 | 41.1 | −8.7 | |
| Conservative | Peter Cox | 14,954 | 27.2 | −0.2 | |
| Liberal Democrat | Jon Underwood | 11,340 | 20.6 | +8.2 | |
| Liberal | Margaret Danks | 2,214 | 4.0 | −0.9 | |
| Green | Tim Brenan | 1,896 | 3.4 | +1.0 | |
| UKIP | Mark Fitzgeorge-Parker | 1,854 | 3.4 | +1.3 | |
| Independent | John Stuart | 191 | 0.3 | +0.3 | |
| Majority | 7,665 | 13.9 | |||
| Turnout | 55,068 | 64.8 | 0.6 | ||
| Labour hold | Swing | −4.2 | |||
| Party | Candidate | Votes | % | ± | |
|---|---|---|---|---|---|
| Labour | Ben Bradshaw | 26,194 | 49.8 | +2.3 | |
| Conservative | Anne Jobson | 14,435 | 27.4 | −1.2 | |
| Liberal Democrat | Richard Copus | 6,512 | 12.4 | −5.6 | |
| Liberal | David J Morrish | 2,596 | 4.9 | +1.6 | |
| Green | Paul Edwards | 1,240 | 2.4 | +1.3 | |
| UKIP | John Stuart | 1,109 | 2.1 | +1.1 | |
| Socialist Alliance | Francis Choules | 530 | 1.0 | N/A | |
| Majority | 11,759 | 22.4 | |||
| Turnout | 52,616 | 64.2 | -13.7 | ||
| Labour hold | Swing | ||||
Elections in the 1990s
| Party | Candidate | Votes | % | ± | |
|---|---|---|---|---|---|
| Labour | Ben Bradshaw | 29,398 | 47.5 | +11.8 | |
| Conservative | Adrian Rogers | 17,693 | 28.6 | −13.5 | |
| Liberal Democrat | Dennis Brewer | 11,148 | 18.0 | −1.1 | |
| Liberal | David Morrish | 2,062 | 3.3 | +1.5 | |
| Green | Paul Edwards | 643 | 1.0 | +0.2 | |
| Independent | Corrine Haynes | 638 | 1.0 | N/A | |
| Independent | James Meakin | 282 | 0.5 | N/A | |
| Majority | 11,705 | 18.9 | |||
| Turnout | 61,864 | 78.2 | −4.0 | ||
| Labour gain from Conservative | Swing | +12.5 | |||
| Party | Candidate | Votes | % | ± | |
|---|---|---|---|---|---|
| Conservative | John Hannam | 25,543 | 41.1 | −3.3 | |
| Labour | John N. Lloyd | 22,498 | 36.2 | +13.7 | |
| Liberal Democrat | Graham J. Oakes | 12,059 | 19.4 | −12.3 | |
| Liberal | Alison C. Micklem | 1,119 | 1.8 | +1.8 | |
| Green | Tim J.R. Brenan | 764 | 1.2 | +0.2 | |
| Natural Law | Michael J. Turnbull | 98 | 0.2 | N/A | |
| Majority | 3,045 | 4.9 | −7.7 | ||
| Turnout | 62,081 | 80.5 | −0.1 | ||
| Conservative hold | Swing | −8.5 | |||
Elections in the 1980s
| Party | Candidate | Votes | % | ± | |
|---|---|---|---|---|---|
| Conservative | John Hannam | 26,922 | 44.40 | -2.12 | |
| Social Democratic | Mike Thomas | 19,266 | 31.77 | +2.49 | |
| Labour | John Vincent | 13,643 | 22.50 | -0.34 | |
| Green | Raymond Vail | 597 | 0.98 | -0.38 | |
| L.A.P.P | Nigel Byles | 209 | 0.34 | ||
| Majority | 7,656 | 12.63 | |||
| Turnout | 60,637 | 80.63 | |||
| Conservative hold | Swing | ||||
| Party | Candidate | Votes | % | ± | |
|---|---|---|---|---|---|
| Conservative | John Hannam | 26,660 | 46.52 | -1.89 | |
| Social Democratic | Stuart Mennell | 16,780 | 29.28 | +13.68 | |
| Labour | Richard Evans | 13,088 | 22.84 | -11.27 | |
| Ecology | Peter Frings | 779 | 1.36 | -0.52 | |
| Majority | 9,880 | 17.24 | |||
| Turnout | 57,307 | 78.03 | |||
| Conservative hold | Swing | ||||
Elections in the 1970s
| Party | Candidate | Votes | % | ± | |
|---|---|---|---|---|---|
| Conservative | John Hannam | 27,173 | 48.41 | ||
| Labour | G.W. Hobbs | 19,146 | 34.11 | ||
| Liberal | H. Marsh | 8,756 | 15.60 | ||
| Ecology | Peter Frings | 1,053 | 1.88 | ||
| Majority | 8,027 | 14.30 | |||
| Turnout | 56,128 | 81.55 | |||
| Conservative hold | Swing | ||||
| Party | Candidate | Votes | % | ± | |
|---|---|---|---|---|---|
| Conservative | John Hannam | 21,970 | 40.73 | ||
| Labour | F Keith Taylor | 19,622 | 36.38 | ||
| Liberal | David J Morrish | 12,342 | 22.88 | ||
| Majority | 2,348 | 4.35 | |||
| Turnout | 53,934 | 80.28 | |||
| Conservative hold | Swing | ||||
| Party | Candidate | Votes | % | ± | |
|---|---|---|---|---|---|
| Conservative | John Hannam | 22,762 | 40.10 | ||
| Labour | G. Powell | 17,686 | 31.15 | ||
| Liberal | David J Morrish | 16,322 | 28.75 | ||
| Majority | 5,076 | 8.94 | |||
| Turnout | 56,770 | 85.28 | |||
| Conservative hold | Swing | ||||
| Party | Candidate | Votes | % | ± | |
|---|---|---|---|---|---|
| Conservative | John Hannam | 21,680 | 45.02 | ||
| Labour | Gwyneth Dunwoody | 20,409 | 42.38 | ||
| Liberal | David J Morrish | 6,672 | 13.61 | ||
| Majority | 1,271 | 2.64 | |||
| Turnout | 48,761 | 81.05 | |||
| Conservative gain from Labour | Swing | ||||
Elections in the 1960s
| Party | Candidate | Votes | % | ± | |
|---|---|---|---|---|---|
| Labour | Gwyneth Dunwoody | 22,199 | 48.60 | +10.29 | |
| Conservative | Rolf Dudley-Williams | 18,613 | 40.75 | -0.69 | |
| Liberal | Ronald Cuthbert Thompson | 4,869 | 10.66 | -9.59 | |
| Majority | 3,586 | 7.85 | |||
| Turnout | 45,681 | 83.63 | |||
| Labour gain from Conservative | Swing | ||||
| Party | Candidate | Votes | % | ± | |
|---|---|---|---|---|---|
| Conservative | Rolf Dudley-Williams | 18,035 | 41.44 | -7.22 | |
| Labour | Gwyneth Dunwoody | 16,673 | 38.31 | +2.42 | |
| Liberal | Ronald Cuthbert Thompson | 8,815 | 20.25 | +4.8 | |
| Majority | 1,362 | 3.13 | |||
| Turnout | 43,523 | 80.34 | |||
| Conservative hold | Swing | ||||
Elections in the 1950s
| Party | Candidate | Votes | % | ± | |
|---|---|---|---|---|---|
| Conservative | Rolf Dudley-Williams | 21,579 | 48.66 | ||
| Labour | Albert John Rogers | 15,918 | 35.89 | ||
| Liberal | Gordon Taylor | 6,852 | 15.45 | ||
| Majority | 5,661 | 12.76 | |||
| Turnout | 44,349 | 82.00 | |||
| Conservative hold | Swing | ||||
| Party | Candidate | Votes | % | ± | |
|---|---|---|---|---|---|
| Conservative | Rolf Dudley-Williams | 24,147 | 56.28 | ||
| Labour | Leslie C. Merrion | 18,759 | 43.72 | ||
| Majority | 5,388 | 12.56 | |||
| Turnout | 42,906 | 79.31 | |||
| Conservative hold | Swing | ||||
| Party | Candidate | Votes | % | ± | |
|---|---|---|---|---|---|
| Conservative | Rolf Dudley-Williams | 23,218 | 50.80 | ||
| Labour | Edward S.D. Bishop | 18,576 | 40.65 | ||
| Liberal | Ellen E Tinkham | 3,908 | 8.55 | ||
| Majority | 4,642 | 10.16 | |||
| Turnout | 45,702 | 84.13 | |||
| Conservative hold | Swing | ||||
| Party | Candidate | Votes | % | ± | |
|---|---|---|---|---|---|
| Conservative | John Maude | 24,339 | 53.52 | ||
| Labour | Tom Horabin | 21,135 | 46.48 | ||
| Majority | 3,204 | 7.05 | |||
| Turnout | 45,474 | 86.00 | |||
| Conservative hold | Swing | ||||
Election in the 1940s
| Party | Candidate | Votes | % | ± | |
|---|---|---|---|---|---|
| Conservative | John Maude | 16,420 | 43.34 | -17.44 | |
| Labour | Reginald J Travess | 15,245 | 40.24 | +1.02 | |
| Liberal | Freda Evelyn Griffith Morgan | 6,220 | 16.42 | +16.42 | |
| Majority | 1,175 | 3.10 | |||
| Turnout | 37,885 | 74.46 | |||
| Conservative hold | Swing | ||||
Elections in the 1930s
General Election 1939/40: Another General Election was required to take place before the end of 1940. The political parties had been making preparations for an election to take place and by the Autumn of 1939, the following candidates had been selected;
- Conservative: Arthur Reed
- Labour: W R Robins[24]
- Liberal: Henry Gebhardt
- British Union: Rafe Temple Cotton
| Party | Candidate | Votes | % | ± | |
|---|---|---|---|---|---|
| Conservative | Arthur Reed | 21,192 | 60.78 | +5.59 | |
| Labour | John Stafford Cripps | 13,674 | 39.22 | +17.65 | |
| Majority | 7,518 | 21.56 | |||
| Turnout | 34,866 | 75.86 | |||
| Conservative hold | Swing | ||||
| Party | Candidate | Votes | % | ± | |
|---|---|---|---|---|---|
| Conservative | Arthur Reed | 20,360 | 55.19 | +32.49 | |
| Liberal | Eleanor Acland | 8,571 | 23.23 | +23.23 | |
| Labour | James Viner Delahaye | 7,958 | 21.57 | -6.23 | |
| Majority | 11,789 | 31.96 | |||
| Turnout | 36,889 | 84.77 | |||
| Conservative hold | Swing | ||||
Elections in the 1920s
| Party | Candidate | Votes | % | ± | |
|---|---|---|---|---|---|
| Independent Unionist | Robert Newman | 16,642 | 49.5 | -8.0 | |
| Labour | J. Lloyd Jones | 9,361 | 27.8 | +2.6 | |
| Unionist | Geoffrey Dorling Roberts | 7,622 | 22.7 | n/a | |
| Majority | 7,281 | 21.7 | -10.6 | ||
| Turnout | 81.9 | -0.2 | |||
| Independent Unionist gain from Unionist | Swing | n/a | |||
| Party | Candidate | Votes | % | ± | |
|---|---|---|---|---|---|
| Unionist | Robert Newman | 14,522 | 57.5 | -10.2 | |
| Labour | A J Penny | 6,359 | 25.2 | -7.1 | |
| Liberal | Thomas Fairchild Day | 4,359 | 17.3 | n/a | |
| Majority | 8,163 | 32.3 | -3.1 | ||
| Turnout | 82.1 | +9.5 | |||
| Unionist hold | Swing | -1.5 | |||
| Party | Candidate | Votes | % | ± | |
|---|---|---|---|---|---|
| Unionist | Robert Newman | 14,908 | 67.7 | +11.0 | |
| Labour | Lothian Small | 7,123 | 32.3 | n/a | |
| Majority | 7,785 | 35.4 | +22.0 | ||
| Turnout | 72.6 | -13.0 | |||
| Unionist hold | Swing | n/a | |||
| Party | Candidate | Votes | % | ± | |
|---|---|---|---|---|---|
| Unionist | Robert Newman | 14,326 | 56.7 | -2.0 | |
| Liberal | Leonard Costello | 10,920 | 43.3 | +2.0 | |
| Majority | 13.4 | -4.0 | |||
| Turnout | 85.6 | +17.4 | |||
| Unionist hold | Swing | -2.0 | |||
Election results 1885-1918
Elections in the 1880s
| Party | Candidate | Votes | % | ± | |
|---|---|---|---|---|---|
| Conservative | Henry Northcote | 3,315 | 51.9 | −10.9 | |
| Liberal | Edward Johnson | 3,074 | 48.1 | +10.9 | |
| Majority | 241 | 3.8 | N/A | ||
| Turnout | 6,389 | 91.8 | +15.3 (est) | ||
| Registered electors | 6,963 | ||||
| Conservative win | |||||
| Party | Candidate | Votes | % | ± | |
|---|---|---|---|---|---|
| Conservative | Henry Northcote | 3,222 | 52.8 | +0.9 | |
| Liberal | Edward Johnson | 2,879 | 47.2 | -0.9 | |
| Majority | 343 | 5.6 | +1.8 | ||
| Turnout | 6,101 | 87.6 | -4.2 | ||
| Registered electors | 6,963 | ||||
| Conservative hold | Swing | +0.9 | |||
Elections in the 1890s

| Party | Candidate | Votes | % | ± | |
|---|---|---|---|---|---|
| Conservative | Henry Northcote | 3,884 | 53.8 | +1.0 | |
| Liberal | Albert Dunn | 3,329 | 46.2 | −1.0 | |
| Majority | 555 | 7.6 | +2.0 | ||
| Turnout | 7,213 | 90.5 | +2.9 | ||
| Registered electors | 7,972 | ||||
| Conservative hold | Swing | +1.0 | |||
| Party | Candidate | Votes | % | ± | |
|---|---|---|---|---|---|
| Conservative | Henry Northcote | 3,857 | 53.4 | -0.4 | |
| Liberal | Adam Spencer Hogg | 3,363 | 46.6 | +0.4 | |
| Majority | 494 | 6.8 | -0.8 | ||
| Turnout | 7,220 | 88.1 | -2.4 | ||
| Registered electors | 8,198 | ||||
| Conservative hold | Swing | -0.4 | |||
| Party | Candidate | Votes | % | ± | |
|---|---|---|---|---|---|
| Conservative | Edgar Vincent | 4,030 | 54.5 | +0.7 | |
| Liberal | Allan Bright | 3,371 | 45.5 | −0.7 | |
| Majority | 659 | 9.0 | +1.4 | ||
| Turnout | 7,401 | 86.1 | −4.4 | ||
| Registered electors | 8,595 | ||||
| Conservative hold | Swing | +0.7 | |||
Elections in the 1900s
| Party | Candidate | Votes | % | ± | |
|---|---|---|---|---|---|
| Conservative | Edgar Vincent | 4,001 | 54.1 | +0.7 | |
| Liberal | Allan Bright | 3,388 | 45.9 | −0.7 | |
| Majority | 613 | 8.2 | +1.4 | ||
| Turnout | 7,389 | 84.9 | −3.2 | ||
| Registered electors | 8,708 | ||||
| Conservative hold | Swing | +0.7 | |||
| Party | Candidate | Votes | % | ± | |
|---|---|---|---|---|---|
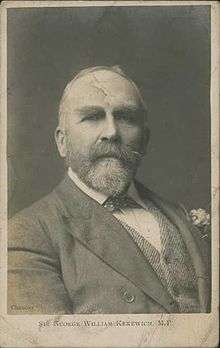
| Liberal | George Kekewich | 4,469 | 50.5 | +4.6 | |
| Conservative | Edgar Vincent | 4,384 | 49.5 | −4.6 | |
| Majority | 85 | 1.0 | N/A | ||
| Turnout | 8,853 | 92.5 | +7.6 | ||
| Registered electors | 9,567 | ||||
| Liberal gain from Conservative | Swing | +4.6 | |||
Elections in the 1910s
| Party | Candidate | Votes | % | ± | |
|---|---|---|---|---|---|
| Conservative | Henry Duke | 4,902 | 50.1 | +0.6 | |
| Liberal | Harold St. Maur | 4,876 | 49.9 | -0.6 | |
| Majority | 26 | 0.2 | N/A | ||
| Turnout | 9,778 | 94.2 | +1.7 | ||
| Registered electors | 10,383 | ||||
| Conservative gain from Liberal | Swing | +0.6 | |||

| Party | Candidate | Votes | % | ± | |
|---|---|---|---|---|---|
| Conservative | Henry Duke | 4,777 | 50.0 | -0.1 | |
| Liberal | Harold St. Maur | 4,776 | 50.0 | +0.1 | |
| Majority | 1 | 0.0 | -0.2 | ||
| Turnout | 9,553 | 92.0 | -2.2 | ||
| Registered electors | 10,383 | ||||
| Conservative hold | Swing | -0.1 | |||
Upon petition, this election was subject to a recount due to the closeness of the results. On the first count, St. Maur led with 4,786 votes to Duke's 4,782. On a second count, St. Maur again led with 4,782 votes to Duke's 4,778. Closer scrutiny led to the above count, allowing Duke to retain the seat.
General Election 1914/15:
Another General Election was required to take place before the end of 1915. The political parties had been making preparations for an election to take place and by the July 1914, the following candidates had been selected;
- Unionist: Henry Duke
- Liberal:
Duke is appointed Chief Secretary to the Lord Lieutenant of Ireland, prompting a by-election.
| Party | Candidate | Votes | % | ± | |
|---|---|---|---|---|---|
| Unionist | Henry Duke | Unopposed | |||
| Unionist hold | |||||
Duke is appointed Lord Justice of Appeal and resigns, prompting a by-election.
| Party | Candidate | Votes | % | ± | |
|---|---|---|---|---|---|
| Unionist | Robert Newman | Unopposed | |||
| Unionist hold | |||||
| Party | Candidate | Votes | % | ± | |
|---|---|---|---|---|---|
| C | Unionist | Robert Newman | 12,524 | 58.7 | +8.7 |
| Liberal | Leonard Costello | 8,806 | 41.3 | −8.7 | |
| Majority | 3,718 | 17.4 | +17.4 | ||
| Turnout | 21,330 | 68.2 | −23.8 | ||
| Unionist hold | Swing | +8.7 | |||
| C indicates candidate endorsed by the coalition government. | |||||
Election results 1868-1880
Elections in the 1860s
| Party | Candidate | Votes | % | ± | |
|---|---|---|---|---|---|
| Conservative | Edward Courtenay | Unopposed | |||
| Liberal | John Coleridge | Unopposed | |||
| Registered electors | 3,088 | ||||
| Conservative hold | |||||
| Liberal hold | |||||
| Party | Candidate | Votes | % | ± | |
|---|---|---|---|---|---|
| Liberal | John Coleridge | 2,317 | 25.8 | N/A | |
| Liberal | Edgar Alfred Bowring | 2,247 | 25.0 | N/A | |
| Conservative | John Burgess Karslake | 2,218 | 24.7 | N/A | |
| Conservative | Arthur Mills | 2,206 | 24.5 | N/A | |
| Majority | 29 | 0.3 | N/A | ||
| Turnout | 4,494 (est) | 73.0 (est) | N/A | ||
| Registered electors | 6,156 | ||||
| Liberal hold | Swing | ||||
| Liberal gain from Conservative | Swing | ||||
Coleridge was appointed Solicitor General for England and Wales, requiring a by-election.
| Party | Candidate | Votes | % | ± | |
|---|---|---|---|---|---|
| Liberal | John Coleridge | Unopposed | |||
| Liberal hold | |||||
Elections in the 1870s
Coleridge resigned after being appointed Chief Justice of the Court of Common Pleas
| Party | Candidate | Votes | % | ± | |
|---|---|---|---|---|---|
| Conservative | Arthur Mills | 2,346 | 53.7 | +4.5 | |
| Liberal | Edward Watkin[32] | 2,025 | 46.3 | −4.5 | |
| Majority | 321 | 7.3 | N/A | ||
| Turnout | 4,371 | 70.4 | −2.6 | ||
| Registered electors | 6,206 | ||||
| Conservative gain from Liberal | Swing | +4.5 | |||
| Party | Candidate | Votes | % | ± | |
|---|---|---|---|---|---|
| Conservative | Arthur Mills | 2,523 | 27.5 | +3.0 | |
| Conservative | John George Johnson | 2,330 | 25.4 | +0.7 | |
| Liberal | Edgar Alfred Bowring | 2,264 | 24.7 | −0.3 | |
| Liberal | Edward Johnson | 2,053 | 22.4 | −3.4 | |
| Majority | 66 | 0.7 | N/A | ||
| Turnout | 4,585 (est) | 72.4 (est) | −0.6 | ||
| Registered electors | 6,337 | ||||
| Conservative gain from Liberal | Swing | +1.7 | |||
| Conservative gain from Liberal | Swing | +2.1 | |||
Elections in the 1880s
| Party | Candidate | Votes | % | ± | |
|---|---|---|---|---|---|
| Liberal | Edward Johnson | 3,038 | 37.2 | −9.9 | |
| Conservative | Henry Northcote | 2,590 | 31.7 | +6.3 | |
| Conservative | Arthur Mills | 2,545 | 31.1 | +3.6 | |
| Majority | 448 | 5.5 | N/A | ||
| Turnout | 5,628 (est) | 76.5 (est) | +4.1 | ||
| Registered electors | 7,361 | ||||
| Liberal gain from Conservative | Swing | +5.6 | |||
| Conservative hold | Swing | +4.0 | |||
Election results 1832-1868
Elections in the 1850s
| Party | Candidate | Votes | % | ± | |
|---|---|---|---|---|---|
| Conservative | John Duckworth | 1,210 | 34.5 | N/A | |
| Radical | Edward Divett | 1,191 | 33.9 | N/A | |
| Conservative | George Buck[33] | 1,111 | 31.6 | N/A | |
| Turnout | 2,352 (est) | 94.0 (est) | N/A | ||
| Registered electors | 2,501 | ||||
| Majority | 19 | 0.5 | N/A | ||
| Conservative hold | Swing | N/A | |||
| Majority | 80 | 2.3 | N/A | ||
| Radical hold | Swing | N/A | |||
| Party | Candidate | Votes | % | ± | |
|---|---|---|---|---|---|
| Conservative | Richard Gard | Unopposed | |||
| Radical | Edward Divett | Unopposed | |||
| Registered electors | 3,162 | ||||
| Conservative hold | |||||
| Radical hold | |||||
| Party | Candidate | Votes | % | ± | |
|---|---|---|---|---|---|
| Conservative | Richard Gard | Unopposed | |||
| Liberal | Edward Divett | Unopposed | |||
| Registered electors | 3,216 | ||||
| Conservative hold | |||||
| Liberal hold | |||||
Elections in the 1860s
Divett's death caused a by-election.
| Party | Candidate | Votes | % | ± | |
|---|---|---|---|---|---|
| Conservative | Edward Courtenay | 1,096 | 50.6 | N/A | |
| Liberal | John Coleridge | 1,070 | 49.4 | N/A | |
| Majority | 26 | 1.2 | N/A | ||
| Turnout | 2,166 | 84.5 | N/A | ||
| Registered electors | 2,564 | ||||
| Conservative gain from Liberal | Swing | N/A | |||
See also
Notes and references
- Notes
- ↑ A borough constituency (for the purposes of election expenses and type of returning officer)
- ↑ As with all constituencies, Exeter elects one Member of Parliament (MP) by the first past the post system of election at least every five years.
- References
- ↑ "Electorate Figures - Boundary Commission for England". 2011 Electorate Figures. Boundary Commission for England. 4 March 2011. Archived from the original on 6 November 2010. Retrieved 13 March 2011.
- ↑ "Final recommendations for Parliamentary constituencies in the counties of Devon, Plymouth and Torbay". Boundary Commission for England. 2004-11-24. Archived from the original on 2009-11-02. Retrieved 2010-04-25.
- 1 2 3 4 "PRESCOTT, John (c.1327-1412), of Prescott, Rake and Exeter, Devon". History of Parliament Online. Retrieved 11 May 2013.
- 1 2 3 4 5 6 7 8 9 10 11 12 13 14 15 16 17 18 19 20 21 22 23 24 25 26 27 28 29 30 31 "History of Parliament". History of Parliament Trust. Retrieved 2011-10-24.
- 1 2 3 4 5 6 7 8 9 10 11 12 13 14 15 16 17 "History of Parliament". History of Parliament Trust. Retrieved 2011-10-24.
- 1 2 3 4 5 6 7 8 9 10 "History of Parliament". History of Parliament Trust. Retrieved 2011-10-24.
- 1 2 3 Leigh Rayment's Historical List of MPs – Constituencies beginning with "E" (part 2)
- ↑ Churton, Edward (1836). The Assembled Commons or Parliamentary Biographer: 1836. p. 72. Retrieved 7 May 2018.
- ↑ Dod, Charles Roger; Dod, Robert Phipps (1847). Dod's Parliamentary Companion, Volume 15. Dod's Parliamentary Companion. p. 156. Retrieved 7 May 2018.
- 1 2 At the December 1910 election, Harold St Maur was declared the winner by 4 votes, and the same majority was recorded after a recount. However a electoral petition was heard in April 1911, at which Henry Duke was declared the winner by 1 vote.
- ↑ "2017 General Election candidates in Devon". Devon Live. 11 May 2017.
- ↑ "Election Data 2015". Electoral Calculus. Archived from the original on 18 May 2015. Retrieved 17 October 2015.
- ↑ "Election Data 2010". Electoral Calculus. Archived from the original on 26 July 2013. Retrieved 17 October 2015.
- ↑ Bostock, Philip (20 April 2010). "Statement of Persons Nominated and Notice of Poll" (PDF). Acting Returning Officer, Exeter City Council. Retrieved 21 April 2010.
- ↑ "Election Data 2005". Electoral Calculus. Archived from the original on 15 October 2011. Retrieved 18 October 2015.
- ↑ "Election Data 2001". Electoral Calculus. Archived from the original on 15 October 2011. Retrieved 18 October 2015.
- ↑ "Election Data 1997". Electoral Calculus. Archived from the original on 15 October 2011. Retrieved 18 October 2015.
- ↑ "Exeter: Constituency". The Guardian. Retrieved 7 May 2010.
- ↑ Morgan, Bryn (29 March 2001). "General Election results, 1 May 1997" (PDF). Social & General Statistics Section, House of Commons Library. Archived from the original (PDF) on 4 December 2008. Retrieved 7 May 2010.
- ↑ "Election Data 1992". Electoral Calculus. Archived from the original on 15 October 2011. Retrieved 18 October 2015.
- ↑ "Politics Resources". Election 1992. Politics Resources. 9 April 1992. Retrieved 2010-12-06.
- ↑ "Election Data 1987". Electoral Calculus. Archived from the original on 15 October 2011. Retrieved 18 October 2015.
- ↑ "Election Data 1983". Electoral Calculus. Archived from the original on 15 October 2011. Retrieved 18 October 2015.
- ↑ Report of the Annual Conference of the Labour Party, 1939
- 1 2 3 4 5 Craig, F. W. S. (1983). British parliamentary election results 1918-1949 (3 ed.). Chichester: Parliamentary Research Services. ISBN 0-900178-06-X.
- 1 2 3 4 5 6 7 8 9 10 11 British Parliamentary Election Results 1885-1918, FWS Craig
- 1 2 3 4 5 6 7 The Liberal Year Book, 1907
- ↑ Debrett's House of Commons & Judicial Bench, 1886
- 1 2 3 Debrett's House of Commons & Judicial Bench, 1901
- ↑ Debrett's House of Commons & Judicial Bench, 1916
- 1 2 3 4 5 6 7 8 9 10 Craig, F. W. S., ed. (1977). British Parliamentary Election Results 1832-1885 (1st ed.). London: Macmillan Press. ISBN 978-1-349-02349-3.
- ↑ "Exeter Representation". Western Times. 10 November 1873. pp. 3–4. Retrieved 29 December 2017 – via British Newspaper Archive. (Subscription required (help)).
- ↑ "Exeter Election". Exeter and Plymouth Gazette. 10 July 1852. pp. 4, 7. Retrieved 7 May 2018 – via British Newspaper Archive. (Subscription required (help)).