Birmingham Hall Green (UK Parliament constituency)
Coordinates: 52°26′N 1°50′W / 52.43°N 1.84°W
| Birmingham Hall Green | |
|---|---|
|
Borough constituency for the House of Commons | |
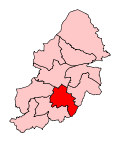 Boundary of Birmingham Hall Green in Birmingham. | |
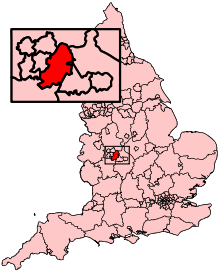 Location of Birmingham within England. | |
| County | West Midlands |
| Population | 115,904 (2011 census)[1] |
| Electorate | 77,157 (December 2010)[2] |
| Current constituency | |
| Created | 1950 |
| Member of parliament | Roger Godsiff (Labour) |
| Number of members | One |
| Created from | Birmingham Acock's Green and Birmingham Moseley |
| Overlaps | |
| European Parliament constituency | West Midlands |
Birmingham Hall Green is a parliamentary constituency[n 1] in city of Birmingham, which has been represented in the House of Commons of the UK Parliament since 2010 by Roger Godsiff of the Labour Party.[n 2]
It is generally considered a Labour safe seat, having the twelfth-largest majority in the UK (by percentage) with a vote share for Labour of 77.6% and majority of 62.5%, as of 2017. [3]
Members of Parliament
| Election | Member[4] | Party | Notes | |
|---|---|---|---|---|
| 1950 | Aubrey Jones | Conservative | Resigned 1965 | |
| 1965 by-election | Reginald Eyre | Conservative | ||
| 1987 | Andrew Hargreaves | Conservative | ||
| 1997 | Steve McCabe | Labour | ||
| 2010 | Roger Godsiff | Labour | ||
Boundaries and constituency profile
2010–present: The City of Birmingham wards of Hall Green, Moseley and King's Heath, Sparkbrook, and Springfield.
1983–2010: The City of Birmingham wards of Billesley, Brandwood, and Hall Green.
1974–1983: The County Borough of Birmingham wards of Billesley, Brandwood, and Hall Green.
1955–1974: The County Borough of Birmingham wards of Brandwood, Hall Green, and Springfield.
1950–1955: The County Borough of Birmingham wards of Hall Green, Sparkhill and Springfield.[5]
The constituency is a suburban seat on the fringes city centre to its south and bordering Solihull in the east. The number of non-whites (9.3%) is low compared to the rest of the city, as is the proportion of social housing (25.7%), figures higher than the national average. The area is home to a high number of public parks, open space and numerous tree-lined streets.[6][7]
A famous landmark is Sarehole Mill, where J. R. R. Tolkien spent his boyhood, and which provided the inspiration for The Hobbit and The Lord of the Rings.
Many constituents were employed in the car industry – notably Rover's nearby factories which have now closed down.
Following the Fifth Periodic Review of Westminster constituencies, the Boundary Commission for England created a modified version of the Hall Green seat which contains a third of the constituency which existed for the 1997 general election and new additions – the retained former ward is Hall Green itself – and additional wards include two from the Birmingham, Sparkbrook and Small Heath which was abolished at the 2010 general glection.
History
- Summary of results
The 2015 result made the seat the 28th safest of Labour's 232 seats by percentage of majority.[8]
The 2017 result made it the 12th safest seat in the UK, with a majority of 62.5% of the vote.[3]
Hall Green, on various boundaries, elected a Conservative MP throughout the period from 1950 to 1997 and formed with Birmingham, Edgbaston the last of the Birmingham seats during the 1979–1997 Conservative Governments lost to Labour, in 1997. This was the first time a Labour candidate had won the seat as it was created in 1950. The 2015 result saw a +26.9% swing to the Labour Party and a correspondingly much greater than national average swing away from the Liberal Democrat candidate.
- Turnout
Turnout has ranged from 83.1% in 1950 to 57.5% in 2001.
Elections
Elections in the 2010s
| Party | Candidate | Votes | % | ± | |
|---|---|---|---|---|---|
| Labour | Roger Godsiff | 42,143 | 77.6 | ||
| Conservative | Reena Ranger | 8,199 | 15.1 | ||
| Liberal Democrat | Jerry Evans | 3,137 | 5.8 | ||
| Green | Patrick Cox | 831 | 1.5 | ||
| Majority | 33,944 | 62.5 | |||
| Turnout | 54,310 | 69.4 | |||
| Labour hold | Swing | ||||
| Party | Candidate | Votes | % | ± | |
|---|---|---|---|---|---|
| Labour | Roger Godsiff | 28,147 | 59.8 | ||
| Conservative | James Bird | 8,329 | 17.7 | ||
| Liberal Democrat | Jerry Evans | 5,459 | 11.6 | ||
| Green | Elly Stanton | 2,200 | 4.7 | N/A | |
| UKIP | Rashpal Mondair | 2,131 | 4.5 | ||
| Respect | Shiraz Peer | 780 | 1.7 | ||
| Majority | 19,818 | 42.1 | |||
| Turnout | 47,046 | 61.6 | |||
| Labour hold | Swing | ||||
| Party | Candidate | Votes | % | ± | |
|---|---|---|---|---|---|
| Labour | Roger Godsiff | 16,039 | 32.9 | ||
| Respect | Salma Yaqoob | 12,240 | 25.1 | ||
| Liberal Democrat | Jerry Evans | 11,988 | 24.6 | ||
| Conservative | Jo Barker | 7,320 | 15.0 | ||
| UKIP | Alan Blumenthal | 950 | 1.9 | ||
| Independent | Andrew Gardner | 190 | 0.4 | ||
| Majority | 3,799 | 7.8 | |||
| Turnout | 48,727 | 63.6 | |||
| Labour hold | Swing | 11.7 | |||
Elections in the 2000s
| Party | Candidate | Votes | % | ± | |
|---|---|---|---|---|---|
| Labour | Steve McCabe | 16,304 | 47.2 | ||
| Conservative | Eddie Hughes | 10,590 | 30.7 | ||
| Liberal Democrat | Roger Harmer | 6,682 | 19.3 | ||
| UKIP | David Melhuish | 960 | 2.8 | ||
| Majority | 5,714 | 16.5 | |||
| Turnout | 34,536 | 60.4 | |||
| Labour hold | Swing | ||||
| Party | Candidate | Votes | % | ± | |
|---|---|---|---|---|---|
| Labour | Steve McCabe | 18,049 | 54.6 | ||
| Conservative | Chris White | 11,401 | 34.5 | ||
| Liberal Democrat | Punjab Singh | 2,926 | 8.8 | ||
| UKIP | Peter Johnson | 708 | 2.1 | N/A | |
| Majority | 6,648 | 20.1 | |||
| Turnout | 33,084 | 57.5 | |||
| Labour hold | Swing | ||||
Elections in the 1990s
| Party | Candidate | Votes | % | ± | |
|---|---|---|---|---|---|
| Labour | Steve McCabe | 22,372 | 53.5 | ||
| Conservative | Andrew Hargreaves | 13,952 | 33.4 | ||
| Liberal Democrat | Alastair Dow | 4,034 | 9.6 | ||
| Referendum | Paul Bennett | 1,461 | 3.5 | N/A | |
| Majority | 8,420 | 20.1 | |||
| Turnout | 41,819 | 71.2 | |||
| Labour gain from Conservative | Swing | ||||
| Party | Candidate | Votes | % | ± | |
|---|---|---|---|---|---|
| Conservative | Andrew Hargreaves | 21,649 | 46.1 | ||
| Labour | Jane Slowey | 17,984 | 38.3 | ||
| Liberal Democrat | David McGrath | 7,342 | 15.6 | ||
| Majority | 3,665 | 7.8 | |||
| Turnout | 46,975 | 78.2 | |||
| Conservative hold | Swing | ||||
Elections in the 1980s
| Party | Candidate | Votes | % | ± | |
|---|---|---|---|---|---|
| Conservative | Andrew Hargreaves | 20,478 | 44.9 | ||
| Labour | Frances Brook | 12,857 | 28.2 | ||
| Social Democratic | Francis Wilkes | 12,323 | 27.0 | ||
| Majority | 7,621 | 16.7 | |||
| Turnout | 45,658 | 74.7 | |||
| Conservative hold | Swing | ||||
| Party | Candidate | Votes | % | ± | |
|---|---|---|---|---|---|
| Conservative | Reginald Eyre | 21,142 | 49.1 | ||
| Labour | Martin Willis | 11,769 | 27.3 | ||
| Liberal | John Hemming | 10,175 | 23.6 | ||
| Majority | 9,373 | 21.8 | |||
| Turnout | 43,086 | 70.6 | |||
| Conservative hold | Swing | ||||
Elections in the 1970s
| Party | Candidate | Votes | % | ± | |
|---|---|---|---|---|---|
| Conservative | Reginald Eyre | 27,072 | 54.5 | ||
| Labour | T.J. Stewart | 17,508 | 35.3 | ||
| Liberal | P.M. Lockyer | 4,440 | 9.0 | ||
| National Front | R Maylin | 615 | 1.2 | ||
| Majority | 9,564 | 19.3 | |||
| Turnout | 73.3 | ||||
| Conservative hold | Swing | ||||
| Party | Candidate | Votes | % | ± | |
|---|---|---|---|---|---|
| Conservative | Reginald Eyre | 20,569 | 43.7 | ||
| Labour | T.J. Stewart | 17,945 | 38.1 | ||
| Liberal | I. Powney | 8,532 | 18.1 | ||
| Majority | 2,624 | 5.6 | |||
| Turnout | 70.2 | ||||
| Conservative hold | Swing | ||||
| Party | Candidate | Votes | % | ± | |
|---|---|---|---|---|---|
| Conservative | Reginald Eyre | 27,280 | 56.5 | ||
| Labour | David Jamieson | 21,036 | 43.5 | ||
| Majority | 6,244 | 12.9 | |||
| Turnout | 72.6 | ||||
| Conservative hold | Swing | ||||
| Party | Candidate | Votes | % | ± | |
|---|---|---|---|---|---|
| Conservative | Reginald Eyre | 27,319 | 60.4 | ||
| Labour | T.L. Keene | 17,930 | 39.6 | ||
| Majority | 9,389 | 20.7 | |||
| Turnout | 67.7 | ||||
| Conservative hold | Swing | ||||
Elections in the 1960s
| Party | Candidate | Votes | % | ± | |
|---|---|---|---|---|---|
| Conservative | Reginald Eyre | 20,628 | 47.4 | ||
| Labour | George S Jonas | 17,295 | 39.7 | ||
| Liberal | John Green | 5,617 | 12.9 | ||
| Majority | 3,333 | 7.6 | |||
| Turnout | 73.6 | ||||
| Conservative hold | Swing | ||||
| Party | Candidate | Votes | % | ± | |
|---|---|---|---|---|---|
| Conservative | Reginald Eyre | 17,130 | 54.8 | ||
| Labour | David Mumford | 8,980 | 28.8 | ||
| Liberal | Penelope Jessel | 5,122 | 16.4 | ||
| Majority | 8,150 | 26.0 | |||
| Conservative hold | Swing | ||||
| Party | Candidate | Votes | % | ± | |
|---|---|---|---|---|---|
| Conservative | Aubrey Jones | 23,879 | 52.5 | ||
| Labour | Graham S Rea | 14,477 | 31.8 | ||
| Liberal | Penelope Jessel | 7,113 | 15.6 | ||
| Majority | 9,402 | 20.7 | |||
| Turnout | 75.8 | ||||
| Conservative hold | Swing | ||||
Elections in the 1950s
| Party | Candidate | Votes | % | ± | |
|---|---|---|---|---|---|
| Conservative | Aubrey Jones | 29,148 | 62.6 | ||
| Labour | Deryck HV Fereday | 15,431 | 33.2 | ||
| Ind. Conservative | Harry W Maynard | 1,955 | 4.2 | ||
| Majority | 13,717 | 29.5 | |||
| Turnout | 76.2 | ||||
| Conservative hold | Swing | ||||
| Party | Candidate | Votes | % | ± | |
|---|---|---|---|---|---|
| Conservative | Aubrey Jones | 28,543 | 61.5 | ||
| Labour | William JS Pringle | 17,846 | 38.5 | ||
| Majority | 10,697 | 23.1 | |||
| Turnout | 75.3 | ||||
| Conservative hold | Swing | ||||
| Party | Candidate | Votes | % | ± | |
|---|---|---|---|---|---|
| Conservative | Aubrey Jones | 27,289 | 56.7 | ||
| Labour | Thomas Crehan | 20,874 | 43.3 | ||
| Majority | 6,415 | 13.3 | |||
| Turnout | 82.9 | ||||
| Conservative hold | Swing | ||||
| Party | Candidate | Votes | % | ± | |
|---|---|---|---|---|---|
| Conservative | Aubrey Jones | 24,444 | 50.2 | ||
| Labour | Thomas Crehan | 20,591 | 42.2 | ||
| Liberal | GL Roy | 3,703 | 7.6 | ||
| Majority | 5,472 | 11.4 | |||
| Turnout | 83.1 | ||||
| Conservative hold | Swing | ||||
See also
Notes and references
- Notes
- ↑ A borough constituency (for the purposes of election expenses and type of returning officer)
- ↑ As with all constituencies, the constituency elects one Member of Parliament (MP) by the first past the post system of election at least every five years.
- References
- ↑ "Birmingham, Hall Green: Usual Resident Population, 2011". Neighbourhood Statistics. Office for National Statistics. Retrieved 30 January 2015.
- ↑ "Electorate Figures – Boundary Commission for England". 2011 Electorate Figures. Boundary Commission for England. 4 March 2011. Archived from the original on 6 November 2010. Retrieved 13 March 2011.
- 1 2 "Constituencies A-Z - Election 2017". BBC News. Retrieved 2017-06-10.
- ↑ Leigh Rayment's Historical List of MPs – Constituencies beginning with "H" (part 1)
- ↑ Craig, F.W.S., ed. (1972). Boundaries of parliamentary constituencies 1985-1972. Chichester, Sussex: Political Reference Publications. ISBN 0-900178-09-4.
- ↑ Ordnance survey website
- ↑ Google Maps street views
- ↑ List of Labour MPs elected in 2015 by % majority UK Political.info. Retrieved 2017-01-29
- ↑ "Statement of Persons Nominated and notice of poll". Birmingham City Council. Retrieved 11 May 2017.
- ↑ "Birmingham Hall Green results". BBC News. Retrieved 9 June 2017.
- ↑ "Election Data 2015". Electoral Calculus. Archived from the original on 17 October 2015. Retrieved 17 October 2015.
- ↑ "Election Data 2010". Electoral Calculus. Archived from the original on 26 July 2013. Retrieved 17 October 2015.
- ↑ Birmingham City Council: General Election 2010 Archived 8 May 2010 at the Wayback Machine.
- ↑ "Election Data 2005". Electoral Calculus. Archived from the original on 15 October 2011. Retrieved 18 October 2015.
- ↑ "Election Data 2001". Electoral Calculus. Archived from the original on 15 October 2011. Retrieved 18 October 2015.
- ↑ "Election Data 1997". Electoral Calculus. Archived from the original on 15 October 2011. Retrieved 18 October 2015.
- ↑ "Election Data 1992". Electoral Calculus. Archived from the original on 15 October 2011. Retrieved 18 October 2015.
- ↑ "UK General Election results April 1992". Richard Kimber's Political Science Resources. Politics Resources. 9 April 1992. Retrieved 6 December 2010.
- ↑ "Election Data 1987". Electoral Calculus. Archived from the original on 15 October 2011. Retrieved 18 October 2015.
- ↑ "UK General Election results April 1992". Richard Kimber's Political Science Resources. Politics Resources. 11 June 1987. Retrieved 17 September 2010.
- ↑ "Election Data 1983". Electoral Calculus. Archived from the original on 15 October 2011. Retrieved 18 October 2015.
- ↑ "UK General Election results April 1983". Richard Kimber's Political Science Resources. Politics Resources. 9 April 1992. Retrieved 6 December 2010.
- ↑ "UK General Election results May 1979". Richard Kimber's Political Science Resources. Politics Resources. 28 May 1979. Retrieved 27 December 2012.
- ↑ "UK General Election results October 1974". Richard Kimber's Political Science Resources. Politics Resources. 10 October 1974. Retrieved 27 December 2012.
- ↑ "UK General Election results February 1974". Richard Kimber's Political Science Resources. Politics Resources. 28 February 1974. Retrieved 27 December 2012.
- ↑ "UK General Election results June 1970". Richard Kimber's Political Science Resources. Politics Resources. 18 June 1970. Retrieved 27 December 2012.
- ↑ "UK General Election results March 1966". Richard Kimber's Political Science Resources. Politics Resources. 31 March 1966. Retrieved 27 December 2012.
- ↑
- ↑ "UK General Election results October 1964". Richard Kimber's Political Science Resources. Politics Resources. 15 October 1964. Retrieved 27 December 2012.
- ↑
- ↑ "UK General Election results October 1959". Richard Kimber's Political Science Resources. Politics Resources. 8 October 1959. Retrieved 27 December 2012.
- ↑
- ↑ "UK General Election results May 1955". Richard Kimber's Political Science Resources. Politics Resources. 26 May 1955. Retrieved 27 December 2012.
- ↑
- ↑ "UK General Election results October 1951". Richard Kimber's Political Science Resources. Politics Resources. 25 October 1951. Retrieved 27 December 2012.
- ↑
- ↑ "UK General Election results March 1966". Richard Kimber's Political Science Resources. Politics Resources. 31 March 1966. Retrieved 27 December 2012.