United Kingdom general election, 1886
|
| |||||||||||||||||||||||||||||||||||||||||||||
| |||||||||||||||||||||||||||||||||||||||||||||
All 670 seats in the House of Commons 336 seats needed for a majority | |||||||||||||||||||||||||||||||||||||||||||||
|---|---|---|---|---|---|---|---|---|---|---|---|---|---|---|---|---|---|---|---|---|---|---|---|---|---|---|---|---|---|---|---|---|---|---|---|---|---|---|---|---|---|---|---|---|---|
| |||||||||||||||||||||||||||||||||||||||||||||
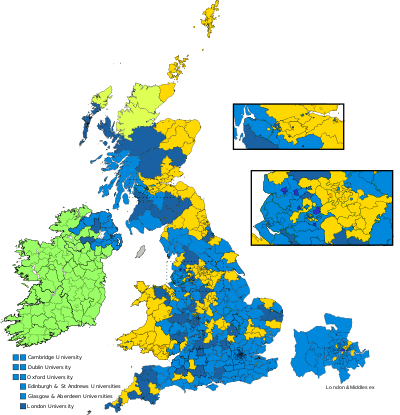 Colours denote the winning party | |||||||||||||||||||||||||||||||||||||||||||||
| |||||||||||||||||||||||||||||||||||||||||||||
_(14781959884).jpg)
.jpg)
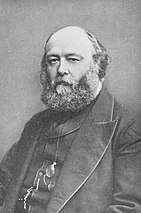
The 1886 United Kingdom general election took place from 1 July to 27 July 1886. It resulted in a major reversal of the results of the 1885 election as the Conservatives, led by Lord Salisbury in an electoral pact with the breakaway Unionist wing of the Liberals led by Lord Hartington (later the Duke of Devonshire) and Joseph Chamberlain. The new Liberal Unionist party gave the Conservatives their parliamentary majority but did not join them in a formal coalition.
William Ewart Gladstone's Liberals, who supported Irish Home Rule, and their sometimes allies, the Irish Parliamentary Party led by Charles Stewart Parnell, placed a distant second. This ended the period of Liberal dominance—they had held power for 18 of the 27 years since 1859 and won five of the six elections held during that time, but would only be in power for three of the next nineteen years. This was also the first election since the 1841 election that the Conservatives won a plurality or majority of the popular vote.
Results
| UK General Election 1886 | |||||||||||||||
|---|---|---|---|---|---|---|---|---|---|---|---|---|---|---|---|
| Party | Candidates | Votes | |||||||||||||
| Stood | Elected | Gained | Unseated | Net | % of total | % | № | Net % | |||||||
| Conservative & Lib. Unionist | 563 | 393 | 161 | 14 | +146 | 58.66 | 51.40 | 1,417,627 | +8.7 | ||||||
| Liberal | 449 | 192 | 24 | 152 | −127 | 28.66 | 45.13 | 1,244,683 | −2.2 | ||||||
| Irish Parliamentary | 100 | 85 | 1 | 2 | −1 | 12.69 | 3.41 | 94,050 | −3.4 | ||||||
| Independent Liberal | 1 | 0 | 0 | 0 | 0 | 0 | 0.05 | 1,247 | |||||||
| Ind. Liberal Unionist | 2 | 0 | 0 | 0 | 0 | 0 | 0.02 | 544 | |||||||
Vote summary
Seats summary
See also
References
- Craig, F. W. S. (1989), British Electoral Facts: 1832–1987, Dartmouth: Gower, ISBN 0900178302
- Rallings, Colin; Thrasher, Michael, eds. (2000), British Electoral Facts 1832–1999, Ashgate Publishing Ltd
Further reading
External links
- Spartacus: Political Parties and Election Results
- United Kingdom election results—summary results 1885–1979
| General elections |
|
|---|---|
| Local elections |
|
| European elections | |
| Referendums | |