Sheffield Hallam (UK Parliament constituency)

Coordinates: 53°21′18″N 1°31′23″W / 53.355°N 1.523°W / 53.355; -1.523

Sheffield, Hallam
County constituency
for the House of Commons
Outline map
Boundary of Sheffield, Hallam in South Yorkshire.
Outline map
Location of South Yorkshire within England.
County South Yorkshire
Population 84,912[1]
Electorate 70,032 (December 2010)
Current constituency
Created 1885
Member of parliament Jared O'Mara (Independent)
Created from Sheffield
Overlaps
European Parliament constituency Yorkshire and the Humber

Sheffield Hallam is a constituency[n 1] represented in the House of Commons of the UK Parliament since 2017 by Jared O'Mara.[2]

The seat has been relative to others a marginal seat since 2010 as its winner's majority has not exceeded 4.2% of the vote since the 29.9% majority won in that year. The seat has changed hands once since that year.

Constituency profile

It has returned a Labour MP for the first time since its first election in 1885 and, apart from a brief period between 1916 and 1918, was held by the Conservatives from 1885 until 1997, when the Liberal Democrats won it. This long period of Conservative dominance included all 3 elections under Margaret Thatcher's premiership, starkly contrasting with the consensus within most seats in the county and the other county which Sheffield Hallam borders, Derbyshire.

In a 2013 survey by The Campaign to End Child Poverty, Sheffield Hallam was found to be the constituency with the lowest level of child poverty in the UK, at under 5%.[3]

On income-based 2004 statistics, this is the most affluent constituency one place below the top ten seats of the 650, which were spread across the South East of England (including London), with almost 12% of residents earning over £60,000 a year.[4] This measure placed Sheffield Hallam above Windsor and Twickenham.

Based on 2011–12 income and tax statistics from HMRC,[5] Sheffield Hallam has the 70th highest median income of the 650 parliamentary constituencies, with those above it almost exclusively in London and the South East, and placing it above Tunbridge Wells (76th), The Cotswolds (92nd), Cambridge (97th), Hemel Hempstead (103rd), and David Cameron's former Witney constituency (121st).

The 2001 Census showed Hallam to have the highest number of people classified as professionals of any of the UK constituencies.[6] Furthermore, 60% of working age residents hold a degree,[7] 7th highest and exceeding Cambridge.[n 2]

Prior to the 1997 general election, the constituency was a safe Conservative seat, and was the only Conservative seat in South Yorkshire in the three previous elections to that. From 2005 to 2017, it was represented in the House of Commons by Nick Clegg, who was leader of the Liberal Democrats from 2007 to 2015 and Deputy Prime Minister from 2010 to 2015.

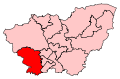
Hallam constituency extends from Stannington and Loxley in the north to Dore in the south and includes small parts of the city centre in the east. It includes the wards of Crookes, Dore and Totley, Ecclesall, Fulwood and Stannington.

The majority of Hallam is rural, spreading in the west into the Peak District National Park. It also contains some of the least deprived wards in the country, has low unemployment (1.5% jobseekers claimants in November 2012)[8] and a high rate of owner occupancy with few occupants who rent their home.[9] Since the 2010 boundary changes, neither of Sheffield's universities have a campus in the constituency[10] but it still includes areas where many students live.

In the 2017 general election, the Labour party candidate, Jared O'Mara, won the seat from Clegg.[2] This was the first time in the seat's history that it has returned a Labour MP.

From 25 October 2017 until 3 July 2018, O'Mara had the whip withdrawn as a Labour MP and sat as an independent. It was later restored but he quit the Labour Party shortly afterwards.[11] but resigned from the party nine days later. He now sits as an independent MP.[12]

Boundaries

1885-1918: The Borough of Sheffield wards of Nether and Upper Hallam, and parts of the wards of Ecclesall and St George's.

1918-1950: The County Borough of Sheffield wards of Crookesmoor and Hallam, and part of Broomhill ward.

1950-1955: The County Borough of Sheffield wards of Broomhill, Ecclesall, and Hallam.

1955-1974: The County Borough of Sheffield wards of Broomhill, Crookesmoor, Ecclesall, and Hallam.

1974-1983: The County Borough of Sheffield wards of Broomhill, Dore, Ecclesall, Hallam, and Nether Edge.

1983-1997: The City of Sheffield wards of Broomhill, Dore, Ecclesall, Hallam, and Nether Edge.

1997-2010: The City of Sheffield wards of Broomhill, Dore, Ecclesall, and Hallam.

2010-present: The City of Sheffield wards of Crookes and Crosspool, Dore and Totley, Ecclesall, Fulwood, and Stannington.

Hallam[n 3] borders High Peak, North East Derbyshire, Penistone and Stocksbridge, Sheffield Central, Sheffield Heeley and Sheffield Brightside and Hillsborough.

History

Prior to its creation Hallam was a part of the larger Sheffield Borough constituency, which was represented by two Members of Parliament (MPs). In 1885 the Redistribution of Seats Act, which sought to eliminate constituencies with more than one MP and for the first time allow approximately equal representation of the people, led to the break-up of the constituency into five divisions: each represented by a single MP, as today. Hallam was one of these new divisions. Its first MP, the Conservative Charles Stuart-Wortley, had previously been an MP in the Sheffield constituency, elected for the first time in 1880.

Hallam was regarded in 2004 as the wealthiest constituency in the north of England[4] and was held by the Conservative Party for all but two years from 1885 to 1997. At the 1997 general election Richard Allan of the Liberal Democrats took the seat with an 18.5% swing, becoming only the second non-Tory ever to win it. He handed the seat to fellow Lib Dem Nick Clegg in 2005, who held it until his defeat by Labor's Jared O'Mara in 2017.

At the 2017 General Election the constituency recorded its highest turnout since 1951, with 77.8% of voters going to the polls.

Constituency polls during the 2010–2015 Parliament

Due in part to the high profile of the constituency's then-MP Nick Clegg, who served as Deputy Prime Minister during the 2010–15 Parliament, Sheffield Hallam is unusual in having had seven constituency-specific opinion polls conducted between 2010 and 2015. Each of these polls suggested significant changes in the vote share compared to 2010 general election. The first poll, in October 2010, suggested a drop in the Lib Dem lead in the seat to just 2%, from nearly 30% at the general election five months earlier. Five of the six remaining polls, which appeared between May 2014 and May 2015, suggested that Labour was in the lead in the seat by this time, with the Labour lead fluctuating to between 1% and 10%, and one put the Lib Dems in the lead. On average across all seven opinion polls, Labour had a lead over the Lib Dems of 2.5%. The Conservatives came second in one poll, and third in the other six polls. It should be noted that the May 2015 ICM poll scores displayed are those of the constituency voting intention question. The same poll also carried the standard voting intention question, which showed a Labour lead.[13][14][15][16][17][18][19]

Date(s)
conducted
Polling organisation/clientSample sizeLabConLDUKIPGreenOthersLead
7 May 2015General Election Result55,48135.8%13.6%40.0%6.4%3.2%0.9%4.2% over Lab
1–3 May 2015ICM/Guardian50135%12%42%7%3%2%7% over Lab
22–28 Apr 2015Lord Ashcroft1,00037%15%36%7%4%1%1% over LD
22–28 Mar 2015Lord Ashcroft1,00136%16%34%7%6%1%2% over LD
22–29 Jan 2015Survation/Unite1,01133%22%23%9%12%<0.5%10% over LD
20–22 Nov 2014Survation/Lord Ashcroft96230%19%27%[20]13%10%1%3% over LD
29 Apr–4 May 2014ICM/Lord Oakeshott50033%24%23%10%8%1%9% over Con
1–4 Oct 2010Populus/Lord Ashcroft1,00031%28%33%N/AN/A8%2% over Lab
6 May 2010General Election Result51,13516.1%23.5%53.4%2.3%1.8%2.7%29.9% over Con

Members of Parliament

The current Member of Parliament is Jared O'Mara. He won the seat in the 2017 General Election as a Labour candidate, but now serves as an independent after having the Labour whip withdrawn in October 2017.

ElectionMemberPartyNotes
1885Charles Stuart-WortleyConservativeBaron Stuart of Wortley
1916 bH. A. L. FisherLiberal
1918Douglas VickersConservative
1922Frederick Sykes[n 4]ConservativeMP for Nottingham Central (1940–45)
1928 bLouis SmithConservativeDied in office
1939 bRoland JenningsConservativeContested elections as a "Conservative and Liberal"
1959John OsbornConservative
1987Irvine PatnickConservative
1997Richard AllanLiberal DemocratBaron Allan of Hallam
2005Nick CleggLiberal DemocratLeader of the Lib Dems, 2007–2015. Deputy Prime Minister, 2010–2015
2017 Jared O'Mara Labour
2017 Independent Labour whip withdrawn on 25 October 2017
2018 Labour Whip reinstated on 3 July 2018 [21]
2018 Independent Resigned party whip on 12 July

Elections

Election results for Sheffield Hallam

Elections in the 2010s

General Election 2017: Sheffield Hallam[22][23]
Party Candidate Votes % ±
Labour Jared O'Mara 21,881 38.4 +2.6
Liberal Democrat Nick Clegg 19,756 34.6 -5.4
Conservative Ian Walker 13,561 23.8 +10.2
UKIP John Thurley 929 1.6 -4.8
Green Logan Robin 823 1.4 -1.8
SDP Steven Winstone 70 0.1 N/A
Majority 2,125 3.8
Turnout 57,020 77.8 +2.5
Labour gain from Liberal Democrat Swing +4.0
General Election 2015: Sheffield Hallam[24][25]
Party Candidate Votes % ±
Liberal Democrat Nick Clegg 22,215 40.0 −13.4
Labour Oliver Coppard 19,862 35.8 +19.7
Conservative Ian Walker 7,544 13.6 −9.9
UKIP Joe Jenkins 3,575 6.4 +4.1
Green Peter Garbutt 1,772 3.2 +1.4
Independent Carlton Reeve 249 0.4 N/A
English Democrat Steve Clegg 167 0.3 −0.8
Independent Jim Stop the Fiasco Wild 97 0.2 N/A
Majority 2,353 4.2 -25.7
Turnout 55,481 75.3 +1.6
Liberal Democrat hold Swing -16.55
General Election 2010: Sheffield Hallam[26][27]
Party Candidate Votes % ±
Liberal Democrat Nick Clegg 27,324 53.4 +7.1
Conservative Nicola Bates 12,040 23.5 −6.6
Labour Jack Scott 8,228 16.1 -1.7
UKIP Nigel James 1,195 2.3 +1.0
Green Steve Barnard 919 1.8 −0.8
English Democrat David Wildgoose 586 1.1 N/A
Independent Martin Fitzpatrick 429 0.8 N/A
Christian Ray Green 250 0.5 N/A
Monster Raving Loony Mark Adshead 164 0.3 N/A
Majority 15,284 29.9 +8.5
Turnout 51,135 73.7 +11.5
Liberal Democrat hold Swing +6.9

In 2010, Sheffield Hallam was one of a number of constituencies which experienced problems on polling day leading to some people being unable to cast their vote. In this case, voters at the Ranmoor polling station were subjected to long queues and some voters were turned away when polls closed at 10 pm, with Liberal Democrat candidate Nick Clegg apologising to those voters affected. Acting Returning Officer John Mothersole said that staff had been "caught out" by a high turnout, and the Electoral Commission instigated a review of procedures in Hallam and other constituencies where similar problems had occurred.[28]

Elections in the 2000s

General Election 2005: Sheffield Hallam[29]
Party Candidate Votes % ±
Liberal Democrat Nick Clegg 20,710 51.1 −4.3
Conservative Spencer Pitfield 12,028 29.7 −1.3
Labour Mahroof Hussain 5,110 12.6 +0.2
Green Rob Cole 1,331 3.3 N/A
Christian Peoples Sidney Cordle 441 1.1 N/A
UKIP Nigel James 438 1.1 0.0
BNP Ian Senior 369 0.9 N/A
Majority 8,682 21.4 −3.0
Turnout 40,527 62.2 −2.6
Liberal Democrat hold Swing -1.5
General Election 2001: Sheffield Hallam[30]
Party Candidate Votes % ±
Liberal Democrat Richard Allan 21,203 55.4 +4.1
Conservative John Harthman 11,856 31.0 −2.1
Labour Gillian Furniss 4,758 12.4 −1.1
UKIP Leslie Arnott 429 1.1 N/A
Majority 9,347 24.4 +6.2
Turnout 38,246 64.8 −7.5
Liberal Democrat hold Swing +3.1

Elections in the 1990s

General Election 1997:[n 5] Sheffield Hallam[31][32]
Party Candidate Votes % ±
Liberal Democrat Richard Allan 23,345 51.3 +18.2
Conservative Irvine Patnick 15,074 33.1 −12.4
Labour Stephen G. Conquest 6,147 13.5 −6.6
Referendum Ian S. Davidson 788 1.7 N/A
Independent Philip Booler 125 0.3 N/A
Majority 8,271 18.2 N/A
Turnout 45,479 72.4 +1.6
Liberal Democrat gain from Conservative Swing 15.3
General Election 1992: Sheffield Hallam[33]
Party Candidate Votes % ±
Conservative Irvine Patnick 24,693 45.5 −0.8
Liberal Democrat Peter J. Gold 17,952 33.1 +0.6
Labour Veronica Hardstaff 10,930 20.1 −0.3
Green Mallen Baker 473 0.9 +0.1
Natural Law Richard E. Hurtford 101 0.2 N/A
Revolutionary Communist Theresa M. Clifford 99 0.2 N/A
Majority 6,741 12.4 −1.4
Turnout 54,248 70.8 −3.9
Conservative hold Swing -0.7

Elections in the 1980s

General Election 1987: Sheffield Hallam[34]
Party Candidate Votes % ±
Conservative Irvine Patnick[n 6] 25,649 46.3 −4.3
Liberal Peter Gold 18,012 32.5 +4.1
Labour Mukesh Savani 11,290 20.4 +0.7
Green Leela Spencer 459 0.8 N/A
Majority 7,637 13.8 −2.4
Turnout 55,410 74.7 +1.9
Conservative hold Swing -4.2
General Election 1983: Sheffield Hallam[35]
Party Candidate Votes % ±
Conservative John Osborn 26,851 50.6 −4.3
Liberal Malcolm S. Johnson 15,077 28.4 +12.7
Labour Jean McCrindle 10,463 19.7 −9.1
Ind. Conservative Philip Booler 656 1.2 N/A
Majority 11,774 22.2 −3.9
Turnout 53,047 72.8 +0.3
Conservative hold Swing -8.5

Elections in the 1970s

General Election 1979: Sheffield Hallam
Party Candidate Votes % ±
Conservative John Osborn 31,436 54.9 +5.9
Labour Mike Bower 16,502 28.8 −0.2
Liberal Kenneth Salt 8,982 15.7 −6.3
National Front G. F. Smith 300 0.5 N/A
Majority 14,934 26.1 +6.1
Turnout 57,220 72.5 +2.7
Conservative hold Swing +3.05
General Election October 1974: Sheffield Hallam
Party Candidate Votes % ±
Conservative John Osborn 26,083 49.0 +0.1
Labour Clive Betts[n 7] 15,419 29.0 +1.8
Liberal Malcolm Johnson 11,724 22.0 −1.9
Majority 10,664 20.0 −1.8
Turnout 53226 68.8 −8.4
Conservative hold Swing -0.85
General Election February 1974: Sheffield Hallam
Party Candidate Votes % ±
Conservative John Osborn 29,062 48.9 −12.4
Labour David Blunkett[n 8] 16,149 27.2 −4.2
Liberal Malcolm Johnson 14,160 23.9 +16.6
Majority 12,913 21.8 −8.1[n 9]
Turnout 59,371 77.2 +7.4
Conservative hold Swing -4.1
General Election 1970: Sheffield Hallam
Party Candidate Votes % ±
Conservative John Osborn 25,134 61.3 +10
Labour Alan Broadley 12,884 31.4 -1.1
Liberal Preetam Singh 2,972 7.3 -8.9
Majority 12,250 29.9 +11
Turnout 40,990 69.8 -5.2
Conservative hold Swing +5.55

Elections in the 1960s

General Election 1966: Sheffield Hallam
Party Candidate Votes % ±
Conservative John Osborn 21,593 51.3
Labour Peter Hardy 13,663 32.5
Liberal Denis Lloyd 6,799 16.2
Majority 7,930 18.9
Turnout 75.0
Conservative hold Swing
General Election 1964: Sheffield Hallam
Party Candidate Votes % ±
Conservative John Osborn 23,719 55.0
Labour Arthur Kingscott 11,635 27.0
Liberal George Manley 7,807 18.1
Majority 12,084 28.0
Turnout 74.1
Conservative hold Swing

Elections in the 1950s

General Election 1959: Sheffield Hallam[36]
Party Candidate Votes % ±
Conservative and National Liberal John Osborn 28,747 62.8
Labour Solomon Sachs 11,938 26.1
Liberal Bernard Roseby 5,119 11.2
Majority 16,809 36.7
Turnout 76.1
Conservative and National Liberal hold Swing
General Election 1955: Sheffield Hallam[37]
Party Candidate Votes % ±
Conservative and National Liberal Roland Jennings 30,069 66.2
Labour James Marsden 15,330 33.8
Majority 14,739 32.5
Turnout 74.1
Conservative and National Liberal hold Swing
General Election 1951: Sheffield Hallam[38]
Party Candidate Votes % ±
Conservative and National Liberal Roland Jennings 29,016 70.8
Labour Frederick Beaton 11,988 29.2
Majority 17,028 41.5
Turnout 82.0
Conservative and National Liberal hold Swing
General Election 1950: Sheffield Hallam[39]
Party Candidate Votes % ±
Conservative and National Liberal Roland Jennings 28,159 65.1
Labour H. C. Spears 11,444 26.5
Liberal Alfred E Jones 3,641 8.4
Majority 16,715 38.6
Turnout 86.4
Conservative and National Liberal hold Swing

Elections in the 1940s

General Election 1945: Sheffield Hallam[n 10]
Party Candidate Votes % ±
Conservative Roland Jennings 15,874 47.1 -20.2
Labour John Frederick Drabble 13,009 38.5 +5.8
Liberal Gerald Abrahams 2,614 7.7 +7.7
Communist Gordon Cree 2,253 6.7 +6.7
Majority 2,865 8.6 -24.0
Turnout 33,750 75.7 +4.0
Conservative hold Swing -13.0

Elections in the 1930s

Sheffield Hallam by-election, 1939[n 11]
Party Candidate Votes % ±
Conservative Roland Jennings 16,033 61.7 -5.6
Labour C. S. Darvill 9,939 38.3 +5.6
Majority 6,094 23.4 -11.2
Turnout 25,972 57.8 -13.9
Conservative hold Swing +5.6
General Election 1935: Sheffield Hallam
Party Candidate Votes % ±
Conservative Louis Smith 21,298 67.3 -10.2
Labour Grace Colman 10,346 32.7 +10.2
Majority 10,952 34.6 -20.4
Turnout 31,644 71.7 -8.6
Conservative hold Swing +10.2
General Election 1931: Sheffield Hallam
Party Candidate Votes % ±
Conservative Louis Smith 26,857 77.5 +16.6
Labour Henry McGhee 7,807 22.5 -16.6
Majority 19,050 55.0 +23.2
Turnout 34,664 80.3 +7.1
Conservative hold Swing +16.6

Elections in the 1920s

General Election 1929: Sheffield Hallam
Party Candidate Votes % ±
Unionist Louis Smith 18,920 60.9
Labour Basil Rawson 12,133 39.1
Majority 6,787 21.8
Turnout 73.2
Unionist hold Swing
Sheffield Hallam by-election, 1928[n 12]
Party Candidate Votes % ±
Unionist Louis Smith 9,417 53.7
Labour Charles Flynn 5,393 30.8
Liberal Joseph Burton Hobman 2,715 15.5
Majority 4,024 22.9
Turnout 54.7
Unionist hold Swing
General Election 1924: Sheffield Hallam
Party Candidate Votes % ±
Unionist Frederick Sykes 15,446 63.7
Labour Edward Snelgrove 8,807 36.3
Majority 6,639 27.4
Turnout 77.8
Unionist hold Swing
General Election 1923: Sheffield Hallam
Party Candidate Votes % ±
Unionist Frederick Sykes 12,119 57.7 -1.7
Labour Arnold Freeman 5,506 23.9 n/a
Liberal Cuthbert Snowball Rewcastle 5,383 23.4 -17.2
Majority 6,613 28.8 +10.0
Turnout 75.0 +1.3
Unionist hold Swing n/a
General Election 1922: Sheffield Hallam
Party Candidate Votes % ±
Unionist Frederick Sykes 13,405 59.4
Liberal Cuthbert Snowball Rewcastle 9,173 40.6
Majority 4,232 18.8
Turnout 73.7
Unionist hold Swing

Elections in the 1910s

General Election 1918: Sheffield Hallam
Party Candidate Votes % ±
C Unionist Douglas Vickers Unopposed
Unionist hold
C indicates candidate endorsed by the coalition government.
1916 by-election

This followed the resignation of Charles Stuart-Wortley on 16 December. Herbert Fisher of the Liberal Party was elected unopposed, becoming Hallam's first non-Unionist MP.

Sheffield Hallam by-election, 1916[40]
Party Candidate Votes % ±
Liberal H. A. L. Fisher Unopposed
Liberal gain from Unionist
Arthur Neal
General Election December 1910: Sheffield Hallam[40]
Party Candidate Votes % ±
Conservative Charles Stuart-Wortley 5,788 50.9 +0.0
Liberal Arthur Neal 5,593 49.1 +0.0
Majority 195 1.8 +0.0
Turnout 11,381 84.1 5.7
Registered electors 13,527
Conservative hold Swing +0.0
General Election January 1910: Sheffield Hallam[40]
Party Candidate Votes % ±
Conservative Charles Stuart-Wortley 6,181 50.9 +0.5
Liberal Arthur Neal 5,965 49.1 0.5
Majority 216 1.8 +1.0
Turnout 12,146 89.8 +4.8
Registered electors 13,527
Conservative hold Swing +0.5

Elections in the 1900s

General Election 1906: Sheffield Hallam[40]
Party Candidate Votes % ±
Conservative Charles Stuart-Wortley 5,546 50.4 N/A
Liberal A. Grant 5,465 49.6 N/A
Majority 81 0.8 N/A
Turnout 11,011 85.0 N/A
Registered electors 12,956
Conservative hold Swing N/A
General Election 1900: Sheffield Hallam[40]
Party Candidate Votes % ±
Conservative Charles Stuart-Wortley Unopposed
Conservative hold

Elections in the 1890s

General Election 1895: Sheffield Hallam[40]
Party Candidate Votes % ±
Conservative Charles Stuart-Wortley Unopposed
Conservative hold
General Election 1892: Sheffield Hallam[40]
Party Candidate Votes % ±
Conservative Charles Stuart-Wortley 4,057 54.3 3.5
Liberal Robert Hammond 3,414 45.7 +3.5
Majority 643 8.6 7.0
Turnout 7,471 87.3 +8.4
Registered electors 8,561
Conservative hold Swing 3.5

Elections in the 1880s

General Election 1886: Sheffield Hallam[40]
Party Candidate Votes % ±
Conservative Charles Stuart-Wortley 3,581 57.8 +3.4
Lib-Lab T. R. Threlfall 2,612 42.2 3.4
Majority 969 15.6 +6.8
Turnout 6,193 78.9 9.3
Registered electors 7,846
Conservative hold Swing +3.4
General Election 1885: Sheffield Hallam[40]
Party Candidate Votes % ±
Conservative Charles Stuart-Wortley 3,764 54.4 N/A
Liberal Charles Warren 3,155 45.6 N/A
Majority 609 8.8 N/A
Turnout 6,919 88.2 N/A
Registered electors 7,846
Conservative win (new seat)

See also

Notes

  1. A county constituency (for the purposes of election expenses and type of returning officer)
  2. Also above Cities of London and Westminster and Hammersmith and Fulham.
  3. The constituency should not be confused with the former Hallamshire constituency.
  4. Knighted in 1928 and appointed Governor of Bombay
  5. At the 1997 general election the seat saw an unprecedented 18.2% one-party swing from the other parties, particularly the large Conservative vote, towards the Liberal Democrat winning candidate.
  6. After 28 years as MP for the seat, John Osborn stood down at the 1987 general election. His replacement as the Conservative Party candidate, local businessman Irvine Patnick, held the seat for the Conservatives with a slightly reduced majority.
  7. Clive Betts, the losing Labour candidate at the October 1974 general election, won the Sheffield Attercliffe seat in 1992.
  8. David Blunkett, the losing February 1974 Labour candidate, won the Sheffield Brightside seat in 1987 enabling his later positions in government as Secretary of State (1997–2005).
  9. The constituency boundaries were redrawn prior to the February 1974 general election, perhaps accounting for the reduced majority of the incumbent, John Osborn.
  10. "Conservative and Liberal"
  11. "Conservative and Liberal"
  12. The 1928 by-election followed the resignation of Frederick Sykes on 26 June to take up an appointment as Governor of Bombay.

References

  1. Sheffield Hallam UK Polling Report
  2. 1 2 "Former Liberal Democrat leader Nick Clegg loses seat amid Labour surge". The Telegraph. Retrieved 9 June 2017.
  3. The Campaign to End Child Poverty Daily Mail
  4. 1 2 Wealth hotspots 'outside London' BBC News
  5. Income and tax by Parliamentary constituency HMRC
  6. Sheffield – a city of class division The Guardian
  7. UCU – University and College Union – National ranking – degree level and above University and College Union
  8. Unemployment claimants by constituency The Guardian
  9. "2011 Census Interactive – ONS". ons.gov.uk. Archived from the original on 29 January 2016.
  10. "OpenStreetMap". openstreetmap.org.
  11. Elgot, Jessica (24 August 2018). "Labour reinstates suspended MP Jared O'Mara". the Guardian. Retrieved 3 July 2018.
  12. "Reinstated MP quits Labour Party". BBC News. 12 July 2018. Retrieved 24 August 2018.
  13. "Populus/Lord Ashcroft opinion poll of Sheffield Hallam, 1–4 October 2010, full data charts" (PDF).
  14. "ICM/Lord Oakeshott opinion poll of Sheffield Hallam, 29 April-4 May 2014, full data charts" (PDF). Archived from the original (PDF) on 24 September 2015.
  15. "Survation/Lord Ashcroft opinion poll of Sheffield Hallam, 20–22 November 2014, full data charts" (PDF).
  16. "Survation/Unite opinion poll of Sheffield Hallam, 22–29 January 2015, full data charts" (PDF).
  17. "Lord Ashcroft opinion poll of Sheffield Hallam, 22–28 March 2015, full data charts" (PDF).
  18. "Lord Ashcroft opinion poll of Sheffield Hallam, 22–28 April 2015, full data charts" (PDF).
  19. Clark, Tom (4 May 2015). "'Breathtaking' surge of Tory tactical votes to save Nick Clegg in Hallam – poll" via The Guardian.
  20. This poll originally, erroneously, showed a small lead for the LDs: see http://lordashcroftpolls.com/2015/02/sheffield-hallam-doncaster-north-thanet-south/#more-7536
  21. Elgot, Jessica (2018-07-03). "Labour reinstates suspended MP Jared O'Mara". The Guardian. Retrieved 2018-07-04.
  22. "Statement of persons nominated: Sheffield Hallam". Sheffield City Council. 12 May 2017. Retrieved 5 June 2017.
  23. "Sheffield Hallam Result 2017". BBC News. Retrieved 11 June 2017.
  24. "Election Data 2015". Electoral Calculus. Archived from the original on 17 October 2015. Retrieved 17 October 2015.
  25. "Sheffield Hallam". BBC News. Retrieved 14 May 2015.
  26. "Election Data 2010". Electoral Calculus. Archived from the original on 26 July 2013. Retrieved 17 October 2015.
  27. "Sheffield Hallam". Election 2010. BBC News. 7 May 2010. Retrieved 11 May 2010.
  28. "Nick Clegg apologises to voters in polling queues". BBC News. 7 May 2010. Retrieved 11 May 2010.
  29. "Election Data 2005". Electoral Calculus. Archived from the original on 15 October 2011. Retrieved 18 October 2015.
  30. "Election Data 2001". Electoral Calculus. Archived from the original on 15 October 2011. Retrieved 18 October 2015.
  31. "Election Data 1997". Electoral Calculus. Archived from the original on 15 October 2011. Retrieved 18 October 2015.
  32. "Sheffield Hallam". ElectionWeb Project. Cognitive Computing Limited. Retrieved 20 May 2016.
  33. "Election Data 1992". Electoral Calculus. Archived from the original on 15 October 2011. Retrieved 18 October 2015.
  34. "Election Data 1987". Electoral Calculus. Archived from the original on 15 October 2011. Retrieved 18 October 2015.
  35. "Election Data 1983". Electoral Calculus. Archived from the original on 15 October 2011. Retrieved 18 October 2015.
  36. 1 2 3 4 5 6 7 8 9 Craig, FWS, ed. (1974). British Parliamentary Election Results: 1885-1918. London: Macmillan Press. ISBN 9781349022984.

External sources

This article is issued from Wikipedia. The text is licensed under Creative Commons - Attribution - Sharealike. Additional terms may apply for the media files.