Bury North (UK Parliament constituency)
Coordinates: 53°36′25″N 2°17′56″W / 53.607°N 2.299°W
| Bury North | |
|---|---|
|
Borough constituency for the House of Commons | |
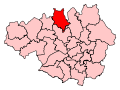 Boundary of Bury North in Greater Manchester. | |
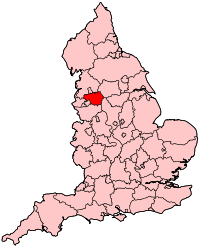 Location of Greater Manchester within England. | |
| County | Greater Manchester |
| Population | 87,218 (2011 UK Census)[1] |
| Electorate | 67,911 (December 2010)[2] |
| Current constituency | |
| Created | 1983 |
| Member of parliament | James Frith (Labour) |
| Number of members | One |
| Created from |
Rossendale (part) Bury & Radcliffe (part) |
| Overlaps | |
| European Parliament constituency | North West England |
Bury North is a borough constituency in Greater Manchester, created in 1983 and represented in the House of Commons of the UK Parliament. As with all extant seats its electorate elects one Member of Parliament (MP) by the first past the post system at least every five years. Since the snap election on 8 June 2017, its MP has been James Frith of the Labour Party who gained the seat from a Conservative.[3][4] Bury North is one of 23 seats won (held or gained) by a Labour candidate in 2017 from a total of 27 covering its county. Frith's 2017 win was one of 30 net gains of the Labour Party.
History
- Summary of results
Bury North is a marginal seat between Labour and the Conservatives, and a bellwether constituency throughout its existence — the winner of the seat has tended to win the general election. In forerunner seats, the town of Bury did not have a Labour MP until 1964, since when Bury North has become reported on as an important marginal seat.
The 2010 gain was the Conservative Party's sole gain in Greater Manchester . The 2015 result was narrower, which produced the 5th most marginal majority of the Conservative Party's 331 seats by percentage of majority.[5]
Boundaries
1983-2010: The Metropolitan Borough of Bury wards of Church, East, Elton, Moorside, Ramsbottom, Redvales, Tottington, and Unsworth.
2010–present: The Metropolitan Borough of Bury wards of Church, East, Elton, Moorside, North Manor, Ramsbottom, Redvales, and Tottington.
The constituency of Bury North covers the towns of Ramsbottom, Tottington and Bury. It was created in 1983 from parts of the former seats of Rossendale and Bury and Radcliffe. In those boundary changes Ramsbottom was transferred from Rossendale to Bury North, while with the loss of Ramsbottom, Rossendale was linked with Darwen.
Constituency profile
Despite its name Bury North includes the entirety of the town of Bury. A traditional Labour-Conservative marginal, Ramsbottom and Tottington are mostly Conservative, whereas the town of Bury itself (particularly the Bury East ward) is generally more favourable to Labour, but not always overwhelmingly so. The wards surrounding the town centre includes some terraced and social housing and is more diverse. The Bury town centre itself features two large sixth form colleges, the 'World Famous' market famed for Black Pudding as well as newer shopping and leisure developments such as The Rock. Tourist attractions include the East Lancashire Heritage Railway and Fusiliers Museum. North of Bury the seat takes a more rural feel in the provincial towns of Tottington and Ramsbottom, which are becoming increasingly desirable for Manchester commuters looking for quieter housing overlooking the West Pennines. Ramsbottom features Peel Monument, a tower on Holcombe Hill dedicated to former Conservative Prime Minister Robert Peel who was born in Bury. The tower is occasionally opened by volunteers, which offers views across Greater Manchester and as far out as Cheshire.
Members of Parliament
| Election | Member[6][7] | Party | |
|---|---|---|---|
| 1983 | Alistair Burt | Conservative | |
| 1997 | David Chaytor | Labour | |
| 2010 | David Nuttall | Conservative | |
| 2017 | James Frith | Labour | |
Elections
Elections in the 2010s
| Party | Candidate | Votes | % | ± | |
|---|---|---|---|---|---|
| Labour | James Frith | 25,683 | 53.6 | +12.5 | |
| Conservative | David Nuttall | 21,308 | 44.5 | +2.5 | |
| Liberal Democrat | Richard Baum | 912 | 1.9 | -0.2 | |
| Majority | 4,375 | 9.1 | |||
| Turnout | 47,903 | 70.9 | +4.0 | ||
| Labour gain from Conservative | Swing | +5.0 | |||
| Party | Candidate | Votes | % | ± | |
|---|---|---|---|---|---|
| Conservative | David Nuttall | 18,970 | 41.9 | +1.8 | |
| Labour | James Frith | 18,592 | 41.1 | +5.9 | |
| UKIP | Ian Henderson | 5,595 | 12.4 | +9.5 | |
| Green | John Southworth | 1,141 | 2.5 | +2.5 | |
| Liberal Democrat | Richard Baum | 932 | 2.1 | −14.9 | |
| Majority | 378 | 0.8 | −4.2 | ||
| Turnout | 45,230 | 66.9 | −0.4 | ||
| Conservative hold | Swing | −2.1 | |||
| Party | Candidate | Votes | % | ± | |
|---|---|---|---|---|---|
| Conservative | David Nuttall | 18,070 | 40.2 | +3.7 | |
| Labour | Maryam Khan | 15,827 | 35.2 | −7.8 | |
| Liberal Democrat | Richard Baum | 7,645 | 17.0 | +1.9 | |
| BNP | John Maude | 1,825 | 4.1 | +0.1 | |
| UKIP | Stephen M. Evans | 1,282 | 2.9 | +1.8 | |
| Independent | Bill Brison | 181 | 0.4 | N/A | |
| Pirate | Graeme P. Lambert | 131 | 0.3 | N/A | |
| Majority | 2,243 | 5.0 | +10.0 | ||
| Turnout | 44,961 | 67.3 | +5.7 | ||
| Conservative gain from Labour | Swing | +5.8 | |||
Elections in the 2000s
| Party | Candidate | Votes | % | ± | |
|---|---|---|---|---|---|
| Labour | David Chaytor | 19,130 | 43.0 | −8.2 | |
| Conservative | David Nuttall | 16,204 | 36.5 | −0.2 | |
| Liberal Democrat | Wilfred Davison | 6,514 | 14.7 | +2.5 | |
| BNP | Stewart Clough | 1,790 | 4.0 | N/A | |
| UKIP | Philip Silver | 476 | 1.1 | N/A | |
| Socialist Labour | Ryan O'Neill | 172 | 0.4 | N/A | |
| Veritas | Ian Upton | 153 | 0.3 | N/A | |
| Majority | 2,926 | 6.6 | −8.0 | ||
| Turnout | 44,439 | 61.5 | −1.5 | ||
| Labour hold | Swing | −4.0 | |||
| Party | Candidate | Votes | % | ± | |
|---|---|---|---|---|---|
| Labour | David Chaytor | 22,945 | 51.2 | −0.6 | |
| Conservative | John Walsh | 16,413 | 36.6 | −0.9 | |
| Liberal Democrat | Bryn Hackley | 5,430 | 12.1 | +3.9 | |
| Majority | 6,532 | 14.6 | +0.3 | ||
| Turnout | 44,788 | 63.0 | −14.9 | ||
| Labour hold | Swing | +0.1 | |||
Elections in the 1990s
| Party | Candidate | Votes | % | ± | |
|---|---|---|---|---|---|
| Labour | David Chaytor | 28,523 | 51.8 | +10.2 | |
| Conservative | Alistair Burt | 20,657 | 37.5 | −12.1 | |
| Liberal Democrat | Neville Kenyon | 4,536 | 8.2 | −0.3 | |
| Referendum | Richard Hallewell | 1,337 | 2.4 | N/A | |
| Majority | 7,866 | 14.3 | +6.2 | ||
| Turnout | 55,053 | 77.8 | −6.9 | ||
| Labour gain from Conservative | Swing | +11.2 | |||
| Party | Candidate | Votes | % | ± | |
|---|---|---|---|---|---|
| Conservative | Alistair Burt | 29,266 | 49.7 | −0.4 | |
| Labour | Jim Dobbin | 24,502 | 41.6 | +3.8 | |
| Liberal Democrat | Colin McGrath | 5,010 | 8.5 | −3.6 | |
| Natural Law | Michael Sullivan | 163 | 0.3 | N/A | |
| Majority | 4,764 | 8.1 | −4.2 | ||
| Turnout | 58,941 | 84.8 | +2.2 | ||
| Conservative hold | Swing | −2.1 | |||
Elections in the 1980s
| Party | Candidate | Votes | % | ± | |
|---|---|---|---|---|---|
| Conservative | Alistair Burt | 28,097 | 50.1 | +4.6 | |
| Labour | David Crausby | 21,186 | 37.8 | −2.4 | |
| Liberal | David Vasmer | 6,804 | 12.1 | −2.2 | |
| Majority | 6,911 | 12.3 | +7.0 | ||
| Turnout | 56,087 | 82.5 | +2.9 | ||
| Conservative hold | Swing | +3.5 | |||
| Party | Candidate | Votes | % | ± | |
|---|---|---|---|---|---|
| Conservative | Alistair Burt | 23,923 | 45.5 | N/A | |
| Labour | Frank White | 21,131 | 40.2 | N/A | |
| Liberal | Elisabeth Wilson | 7,550 | 14.4 | N/A | |
| Majority | 2,792 | 5.3 | N/A | ||
| Turnout | 52,604 | 79.6 | N/A | ||
| Conservative win (new seat) | |||||
See also
Notes and references
- ↑ "Bury North: Usual Resident Population, 2011". Neighbourhood Statistics. Office for National Statistics. Retrieved 7 February 2015.
- ↑ "Electorate Figures - Boundary Commission for England". 2011 Electorate Figures. Boundary Commission for England. 4 March 2011. Archived from the original on 6 November 2010. Retrieved 13 March 2011.
- 1 2 "Election Data 2015". Electoral Calculus. Archived from the original on 17 October 2015. Retrieved 17 October 2015.
- 1 2 "Bury North". BBC News. Retrieved 11 May 2015.
- ↑ List of Conservative MPs elected in 2015 by % majority UK Political.info. Retrieved 2017-01-29
- ↑ "Bury North 1983-". Hansard 1803-2005. UK Parliament. Retrieved 7 February 2015.
- ↑ Leigh Rayment's Historical List of MPs – Constituencies beginning with "B" (part 5)
- ↑ "Bury North parliamentary constituency". BBC News.
- ↑ "Election Data 2010". Electoral Calculus. Archived from the original on 26 July 2013. Retrieved 17 October 2015.
- ↑ "General Election Results 2010". Bury Council. 5 December 2005. Archived from the original on May 12, 2010. Retrieved 7 June 2010.
- ↑ "Election 2010 - Bury North". BBC News. Retrieved 7 May 2010.
- ↑ "Election Data 2005". Electoral Calculus. Archived from the original on 15 October 2011. Retrieved 18 October 2015.
- ↑ "Election Data 2001". Electoral Calculus. Archived from the original on 15 October 2011. Retrieved 18 October 2015.
- ↑ "Election Data 1997". Electoral Calculus. Archived from the original on 15 October 2011. Retrieved 18 October 2015.
- ↑ "Politics Resources". Election 1997. Politics Resources. 1 May 1997. Retrieved 2011-01-10.
- ↑ C. Rallings & M. Thrasher, The Media Guide to the New Parliamentary Constituencies, p.45 (Plymouth: LGC Elections Centre, 1995)
- ↑ "Election Data 1992". Electoral Calculus. Archived from the original on 15 October 2011. Retrieved 18 October 2015.
- ↑ "Politics Resources". Election 1992. Politics Resources. 9 April 1992. Retrieved 2010-12-06.
- ↑ "Election Data 1987". Electoral Calculus. Archived from the original on 15 October 2011. Retrieved 18 October 2015.
- ↑ "Election Data 1983". Electoral Calculus. Archived from the original on 15 October 2011. Retrieved 18 October 2015.
External links
- nomis Constituency Profile for Bury North — presenting data from the ONS annual population survey and other official statistics.