Edinburgh West (UK Parliament constituency)
| Edinburgh West | |
|---|---|
|
Burgh constituency for the House of Commons | |
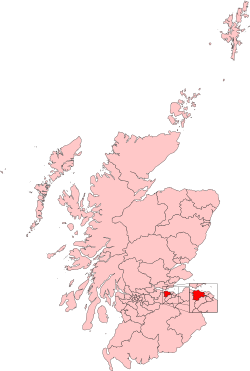 Boundary of Edinburgh West in . | |
| Subdivisions of Scotland | City of Edinburgh |
| Current constituency | |
| Created | 1885 |
| Member of parliament | Christine Jardine (Liberal Democrat) |
| Created from | Edinburgh |
| Overlaps | |
| European Parliament constituency | Scotland |

Edinburgh West is a burgh constituency of the House of Commons of the Parliament of the United Kingdom, first used at the 1885 general election.[n 1]
Before the 2005 general election, the boundaries were the same as the Scottish Parliament constituency with the same name, which had been created in 1999. See Edinburgh West (Scottish Parliament constituency).
This commuter belt seat, distinctively in the city, was safely Unionist/Conservative for over 65 years, from the 1931 general election until the 1997 general election, after which the seat was held by the Liberal Democrats until the 2015 general election. The MP between the 2015 and 2017 general elections was Michelle Thomson, who was elected for the SNP in May 2015. In September 2015, she resigned the party whip and sat as an Independent. At the 2017 general election, Christine Jardine of the Liberal Democrats gained the seat with a majority of 2,988 votes. Thomson chose to neither seek re-election for the SNP, or as an Independent candidate and stood down.[1]
The seat has been relative to others a marginal seat since 2005, as the winner's majority has not exceeded 8.2% of the vote since the 30% majority won in that year. The seat has changed hands twice electorally since that year and once through resigning the party whip.
Boundaries
The seat was created when the Edinburgh constituency was abolished, in 1885, replaced by four seats: Edinburgh East, Edinburgh Central, Edinburgh South and Edinburgh West. The Central constituency was abolished in 2005. The East constituency was abolished in 1997, but a new Edinburgh East was created in 2005. The South and West constituencies have been in continuous use (with alterations to boundaries) since 1885.
The Redistribution of Seats Act 1885 provided that the seat was to consist of the Municipal Wards of St. Andrew, St. Stephen, St. Bernard, and St. Luke.[2]
In 1918 the seat legally consisted of the Dalry, Gorgie, Haymarket and St. Bernard's Municipal Wards of Edinburgh.
Before the 2005 general election, the seat was one of six covering the City of Edinburgh council area. Five were entirely within the city council area. One, Edinburgh East and Musselburgh, straddled the boundary with the East Lothian council area to take in Musselburgh.
Constituency boundaries were revised for the 2005 election: Edinburgh West was enlarged, to include an area formerly within Edinburgh Central, and became one of five seats covering the city area.[3]
The seat now covers a north western portion of the city area. It is mostly suburban, but takes in rural areas within the city area, to the west of central Edinburgh. In terms of wards used in elections to the City of Edinburgh Council, 1999 to 2007, the seat comprises:-
- Cramond, Dalmeny and Kirkliston, Davidson's Mains, East Craigs, Gyle, Muirhouse and Drylaw, Murrayfield, North East Corstorphine, Queensferry, South East Corstorphine and Stenhouse.
These wards were replaced with new wards in 2007, as a result of the Local Governance (Scotland) Act 2004, and none of the new wards were wholly within the constituency. Almond and Constorphine/Murrayfield are almost entirely within it except for a small corner of each one. The constituency also includes a majority of Drum Brae/Gyle, a minority of Pentland Hills and small sections of Forth, Inverleith, City Centre and Sighthill/Gorgie.
Members of Parliament
Election results
Elections in the 2010s
| Party | Candidate | Votes | % | ± | |
|---|---|---|---|---|---|
| Liberal Democrats | Christine Jardine | 18,108 | 34.3 | +1.2 | |
| SNP | Toni Giugliano | 15,120 | 28.6 | -10.3 | |
| Conservative | Sandy Batho | 11,559 | 21.9 | +9.6 | |
| Labour | Mandy Telford | 7,876 | 14.9 | +3.2 | |
| Scotland's Independence Referendum Party | Mark Whittet | 132 | 0.3 | N/A | |
| Majority | 2,988 | 5.7 | N/A | ||
| Turnout | 52,795 | 73.8 | -2.7 | ||
| Liberal Democrats gain from SNP | Swing | +5.8 | |||
| Party | Candidate | Votes | % | ± | |
|---|---|---|---|---|---|
| SNP | Michelle Thomson | 21,378 | 39.0 | +25.8 | |
| Liberal Democrats | Mike Crockart | 18,168 | 33.1 | −2.8 | |
| Conservative | Lindsay Paterson | 6,732 | 12.3 | −10.9 | |
| Labour | Cameron Day | 6,425 | 11.7 | −16.0 | |
| Scottish Green | Pat Black | 1,140 | 2.1 | N/A | |
| UKIP | Otto Inglis | 1,015 | 1.9 | N/A | |
| Majority | 3,210 | 5.9 | N/A | ||
| Turnout | 54,858 | 76.5 | +5.2 | ||
| SNP gain from Liberal Democrats | Swing | +14.3 | |||
| Party | Candidate | Votes | % | ± | |
|---|---|---|---|---|---|
| Liberal Democrats | Mike Crockart | 16,684 | 35.9 | −13.6 | |
| Labour | Cameron Day | 12,881 | 27.7 | +9.1 | |
| Conservative | Stewart Geddes | 10,767 | 23.2 | +3.7 | |
| SNP | Sheena M. Cleland | 6,115 | 13.2 | +4.1 | |
| Majority | 3,803 | 8.2 | −29.8 | ||
| Turnout | 46,447 | 71.3 | +3.0 | ||
| Liberal Democrats hold | Swing | −11.4 | |||
Elections in the 2000s
| Party | Candidate | Votes | % | ± | |
|---|---|---|---|---|---|
| Liberal Democrats | John Barrett | 22,417 | 49.5 | +11.2 | |
| Conservative | David A. Brogan | 8,817 | 19.5 | −2.2 | |
| Labour | Navraj Singh Ghaleigh | 8,433 | 18.6 | −7.9 | |
| SNP | Sheena M. Cleland | 4,124 | 9.1 | −1.6 | |
| Scottish Green | Ailsa Spindler | 964 | 2.1 | +2.1 | |
| Scottish Socialist | Gary P. Clark | 510 | 1.1 | −1.0 | |
| Majority | 13,600 | 30.0 | |||
| Turnout | 45,265 | 68.9 | +5.4 | ||
| Liberal Democrats hold | Swing | +6.7 | |||
| Party | Candidate | Votes | % | ± | |
|---|---|---|---|---|---|
| Liberal Democrats | John Barrett | 16,719 | 42.4 | −0.9 | |
| Labour | Elspeth Alexandra | 9,130 | 23.1 | +4.3 | |
| Conservative | Iain Whyte | 8,894 | 22.5 | −5.4 | |
| SNP | Alyn Smith | 4,047 | 10.3 | +1.4 | |
| Scottish Socialist | Bill Scott | 688 | 1.7 | N/A | |
| Majority | 7,589 | +19.3 | |||
| Turnout | 39,478 | 63.2 | −14.8 | ||
| Liberal Democrats hold | Swing | +2.6 | |||
Elections in the 1990s
| Party | Candidate | Votes | % | ± | |
|---|---|---|---|---|---|
| Liberal Democrats | Donald Gorrie | 20,578 | 43.2 | +13.3 | |
| Conservative | James Douglas-Hamilton | 13,325 | 28.0 | −10.2 | |
| Labour | Lesley Hinds | 8,948 | 18.8 | +1.4 | |
| SNP | Graham D. Sutherland | 4,210 | 8.8 | +0.4 | |
| Referendum | Stephen C. Elphick | 277 | 0.6 | N/A | |
| Liberal | Paul N. Coombes | 263 | 0.5 | −0.1 | |
| Independent | Antony C.O. Jack | 30 | 0.1 | N/A | |
| Majority | 7,253 | 15.2 | |||
| Turnout | 47,631 | 77.9 | |||
| Liberal Democrat gain from Conservative | Swing | +11.8 | |||
| Party | Candidate | Votes | % | ± | |
|---|---|---|---|---|---|
| Conservative | James Douglas-Hamilton | 18,071 | 37.0 | −0.3 | |
| Liberal Democrat | Donald Gorrie | 17,192 | 35.2 | +0.4 | |
| Labour | Irene A. Kitson | 8,759 | 18.0 | −4.2 | |
| SNP | Graham D. Sutherland | 4,117 | 8.4 | +2.8 | |
| Liberal | Alan R. Fleming | 272 | 0.6 | N/A | |
| Scottish Green | Linda Hendry | 234 | 0.5 | N/A | |
| BNP | David J. Bruce | 133 | 0.3 | N/A | |
| Majority | 879 | 1.8 | −0.7 | ||
| Turnout | 48,778 | 82.6 | +3.2 | ||
| Conservative hold | Swing | −0.3 | |||
Elections in the 1980s
| Party | Candidate | Votes | % | ± | |
|---|---|---|---|---|---|
| Conservative | James Douglas-Hamilton | 18,450 | 37.35 | ||
| Liberal | Derek King | 17,216 | 34.85 | ||
| Labour | Michael McGregor | 10,957 | 22.18 | ||
| SNP | Norman Irons | 2,774 | 5.62 | ||
| Majority | 1,234 | 2.50 | |||
| Turnout | 79.40 | ||||
| Conservative hold | Swing | ||||
| Party | Candidate | Votes | % | ± | |
|---|---|---|---|---|---|
| Conservative | James Douglas-Hamilton | 17,646 | 38.17 | ||
| Liberal | DG King | 17,148 | 37.09 | ||
| Labour | Alec Wood | 9,313 | 20.14 | ||
| SNP | J Nicoll | 2,126 | 4.60 | ||
| Majority | 498 | 1.08 | |||
| Turnout | 75.73 | ||||
| Conservative hold | Swing | ||||
Elections in the 1970s
| Party | Candidate | Votes | % | ± | |
|---|---|---|---|---|---|
| Conservative | James Douglas-Hamilton | 19,360 | 45.44 | ||
| Labour | MCB McGregor | 12,009 | 28.19 | ||
| Liberal | R Callendar | 7,330 | 17.21 | ||
| SNP | C Bell | 3,904 | 9.16 | ||
| Majority | 7,351 | 17.25 | |||
| Turnout | 77.85 | ||||
| Conservative hold | Swing | ||||
| Party | Candidate | Votes | % | ± | |
|---|---|---|---|---|---|
| Conservative | James Douglas-Hamilton | 15,354 | 38.15 | ||
| Labour | WJ Taylor | 10,152 | 25.22 | ||
| SNP | CM Moore | 8,135 | 20.21 | ||
| Liberal | Donald Gorrie | 6,606 | 16.41 | ||
| Majority | 5,202 | 12.93 | |||
| Turnout | 76.56 | ||||
| Conservative hold | Swing | ||||
| Party | Candidate | Votes | % | ± | |
|---|---|---|---|---|---|
| Conservative | Anthony Stodart | 18,908 | 44.21 | ||
| Labour | WJ Taylor | 10,431 | 24.39 | ||
| Liberal | Donald Gorrie | 9,189 | 21.49 | ||
| SNP | R Moore | 4,241 | 9.92 | ||
| Majority | 8,477 | 19.82 | |||
| Turnout | 82.18 | ||||
| Conservative hold | Swing | ||||
| Party | Candidate | Votes | % | ± | |
|---|---|---|---|---|---|
| Conservative | Anthony Stodart | 26,864 | 49.23 | ||
| Labour | George Foulkes | 19,523 | 35.78 | ||
| Liberal | Donald Gorrie | 4,467 | 8.19 | ||
| SNP | Muriel Gibson | 3,711 | 6.80 | ||
| Majority | 7,341 | 13.45 | |||
| Turnout | 74.95 | ||||
| Conservative hold | Swing | ||||
Elections in the 1960s
| Party | Candidate | Votes | % | ± | |
|---|---|---|---|---|---|
| Conservative | Anthony Stodart | 24,882 | 48.29 | ||
| Labour | Dick Douglas | 20,073 | 38.96 | ||
| Liberal | James R Telfer | 6,571 | 12.75 | ||
| Majority | 4,809 | 9.33 | |||
| Turnout | 78.66 | ||||
| Conservative hold | Swing | ||||
| Party | Candidate | Votes | % | ± | |
|---|---|---|---|---|---|
| Unionist | Anthony Stodart | 26,298 | 50.56 | ||
| Labour | James K Stocks | 18,359 | 35.30 | ||
| Liberal | James R Telfer | 7,352 | 14.14 | ||
| Majority | 7,939 | 15.26 | |||
| Turnout | 80.91 | ||||
| Unionist hold | Swing | ||||
Elections in the 1950s
| Party | Candidate | Votes | % | ± | |
|---|---|---|---|---|---|
| Unionist | Anthony Stodart | 25,976 | 56.49 | ||
| Labour | James K Stocks | 14,044 | 30.54 | ||
| Liberal | Donald Leach | 5,962 | 12.97 | ||
| Majority | 11,932 | 25.95 | |||
| Turnout | 80.26 | ||||
| Unionist hold | Swing | ||||
| Party | Candidate | Votes | % | ± | |
|---|---|---|---|---|---|
| Unionist | Ian Clark Hutchison | 26,000 | 67.04 | ||
| Labour | James Alexander Cuthburt Thomson | 12,784 | 32.96 | ||
| Majority | 13,216 | 34.08 | |||
| Turnout | 75.67 | ||||
| Unionist hold | Swing | ||||
| Party | Candidate | Votes | % | ± | |
|---|---|---|---|---|---|
| Unionist | Ian Clark Hutchison | 30,232 | 65.95 | ||
| Labour | Harry S Wilson | 15,607 | 34.05 | ||
| Majority | 14,625 | 31.91 | |||
| Turnout | 83.12 | ||||
| Unionist hold | Swing | ||||
| Party | Candidate | Votes | % | ± | |
|---|---|---|---|---|---|
| Unionist | Ian Clark Hutchison | 26,978 | 60.03 | ||
| Labour Co-op | C Morgan | 14,377 | 31.99 | ||
| Liberal | E. Walker | 3,586 | 7.98 | ||
| Majority | 12,601 | 28.04 | |||
| Turnout | 82.79 | ||||
| Unionist hold | Swing | ||||
Elections in the 1940s
| Party | Candidate | Votes | % | ± | |
|---|---|---|---|---|---|
| Unionist | Ian Clark Hutchison | 19,894 | 47.38 | ||
| Labour | Gordon Stott | 18,840 | 44.87 | ||
| Liberal | John Gibson Thomson | 3,256 | 7.75 | ||
| Majority | 1,054 | 2.51 | |||
| Turnout | 67.68 | ||||
| Unionist hold | Swing | ||||
| Party | Candidate | Votes | % | ± | |
|---|---|---|---|---|---|
| Unionist | Ian Clark Hutchison | unopposed | n/a | n/a | |
Elections in the 1930s
| Party | Candidate | Votes | % | ± | |
|---|---|---|---|---|---|
| Unionist | Thomas Cooper | 28,023 | 67.01 | ||
| Labour | James C. Welsh | 13,794 | 32.99 | ||
| Majority | 14,229 | 34.03 | |||
| Turnout | 69.10 | ||||
| Unionist hold | Swing | ||||
| Party | Candidate | Votes | % | ± | |
|---|---|---|---|---|---|
| Unionist | Thomas Cooper | 16,373 | 53.0 | ||
| Labour | W McAdam | 10,462 | 33.9 | ||
| Liberal | George Paish | 4,059 | 13.1 | n/a | |
| Majority | 5,911 | ||||
| Turnout | 51.2 | ||||
| Unionist hold | Swing | ||||
| Party | Candidate | Votes | % | ± | |
|---|---|---|---|---|---|
| Unionist | Wilfrid Normand | 31,407 | 71.20 | ||
| Labour | George Mathers | 12,704 | 28.80 | ||
| Majority | 18,703 | 42.40 | |||
| Turnout | 79.18 | ||||
| Unionist gain from Labour | Swing | ||||
Elections in the 1920s
| Party | Candidate | Votes | % | ± | |
|---|---|---|---|---|---|
| Labour | George Mathers | 15,795 | 38.6 | +5.5 | |
| Unionist | Wilfrid Normand | 12,966 | 31.7 | −4.9 | |
| Liberal | Vivian Phillipps | 12,126 | 29.7 | −0.6 | |
| Majority | 2,829 | 6.9 | N/A | ||
| Turnout | 40,887 | 74.8 | −4.5 | ||
| Registered electors | 54,695 | ||||
| Labour gain from Unionist | Swing | +5.2 | |||
| Party | Candidate | Votes | % | ± | |
|---|---|---|---|---|---|
| Unionist | Ian Macintyre | 10,628 | 36.6 | +3.6 | |
| Labour | George Mathers | 9,603 | 33.1 | +7.4 | |
| Liberal | Vivian Phillipps | 8,790 | 30.3 | −11.0 | |
| Majority | 1,025 | 3.5 | N/A | ||
| Turnout | 29,021 | 79.3 | +4.9 | ||
| Registered electors | 36,618 | ||||
| Unionist gain from Liberal | Swing | −1.9 | |||
| Party | Candidate | Votes | % | ± | |
|---|---|---|---|---|---|
| Liberal | Vivian Phillipps | 11,010 | 41.3 | −10.1 | |
| Unionist | Ian Macintyre | 8,778 | 33.0 | −15.6 | |
| Labour | George Mathers | 6,836 | 25.7 | N/A | |
| Majority | 2,232 | 8.3 | +5.5 | ||
| Turnout | 26,624 | 74.4 | +5.5 | ||
| Registered electors | 35,809 | ||||
| Liberal hold | Swing | +2.8 | |||
| Party | Candidate | Votes | % | ± | |
|---|---|---|---|---|---|
| Liberal | Vivian Phillipps | 12,355 | 51.4 | +16.9 | |
| Unionist | John Gordon Jameson | 11,689 | 48.6 | −2.2 | |
| Majority | 666 | 2.8 | N/A | ||
| Turnout | 24,044 | 68.9 | +15.6 | ||
| Registered electors | 34,899 | ||||
| Liberal gain from Unionist | Swing | +9.6 | |||
Elections in the 1910s
| Party | Candidate | Votes | % | ± | |
|---|---|---|---|---|---|
| C | Unionist | John Gordon Jameson | 9,172 | 50.8 | −3.0 |
| Liberal | Edward Parrott | 6,220 | 34.5 | −11.7 | |
| Labour | John Alexander Young | 2,642 | 14.7 | N/A | |
| Majority | 2,952 | 16.3 | +8.7 | ||
| Turnout | 18,034 | 53.3 | −37.1 | ||
| Registered electors | 33,835 | ||||
| Unionist hold | Swing | +4.4 | |||
| C indicates candidate endorsed by the coalition government. | |||||
| Party | Candidate | Votes | % | ± | |
|---|---|---|---|---|---|
| Liberal Unionist | James Avon Clyde | 4,952 | 53.8 | +1.3 | |
| Liberal | J.H. Morgan | 4,252 | 46.2 | −1.3 | |
| Majority | 700 | 7.6 | +2.6 | ||
| Turnout | 9,204 | 90.4 | −1.0 | ||
| Registered electors | 10,179 | ||||
| Liberal Unionist hold | Swing | +1.3 | |||
| Party | Candidate | Votes | % | ± | |
|---|---|---|---|---|---|
| Liberal Unionist | James Avon Clyde | 4,683 | 52.5 | +0.5 | |
| Liberal | Charles Henry Lyell | 4,233 | 47.5 | −0.5 | |
| Majority | 450 | 5.0 | +1.0 | ||
| Turnout | 8,916 | 91.4 | +6.4 | ||
| Registered electors | 9,758 | ||||
| Liberal Unionist hold | Swing | +0.5 | |||
Elections in the 1900s
| Party | Candidate | Votes | % | ± | |
|---|---|---|---|---|---|
| Liberal Unionist | James Avon Clyde | Unopposed | |||
| Liberal Unionist hold | |||||

| Party | Candidate | Votes | % | ± | |
|---|---|---|---|---|---|
| Liberal Unionist | Lewis McIver | 3,949 | 52.0 | −9.2 | |
| Liberal | Leonard Courtney | 3,643 | 48.0 | +9.2 | |
| Majority | 306 | 4.0 | −18.4 | ||
| Turnout | 7,592 | 85.0 | +8.5 | ||
| Registered electors | 8,930 | ||||
| Liberal Unionist hold | Swing | +9.2 | |||
| Party | Candidate | Votes | % | ± | |
|---|---|---|---|---|---|
| Liberal Unionist | Lewis McIver | 4,180 | 61.2 | N/A | |
| Liberal | E. Adam | 2,645 | 38.8 | N/A | |
| Majority | 1,535 | 22.4 | N/A | ||
| Turnout | 6,825 | 76.5 | N/A | ||
| Registered electors | 8,926 | ||||
| Liberal Unionist hold | Swing | N/A | |||
Elections in the 1890s
| Party | Candidate | Votes | % | ± | |
|---|---|---|---|---|---|
| Liberal Unionist | Lewis McIver | Unopposed | |||
| Liberal Unionist hold | |||||
| Party | Candidate | Votes | % | ± | |
|---|---|---|---|---|---|
| Liberal Unionist | Lewis McIver | 3,783 | 55.2 | +1.5 | |
| Liberal | Alexander Murray | 3,075 | 44.8 | −1.5 | |
| Majority | 708 | 10.4 | +3.0 | ||
| Turnout | 6,858 | 81.1 | −3.2 | ||
| Registered electors | 8,452 | ||||
| Liberal Unionist hold | Swing | +1.5 | |||
| Party | Candidate | Votes | % | ± | |
|---|---|---|---|---|---|
| Liberal Unionist | William Palmer | 3,728 | 53.7 | −2.6 | |
| Liberal | Thomas Buchanan | 3,216 | 46.3 | +2.6 | |
| Majority | 512 | 7.4 | −5.2 | ||
| Turnout | 6,944 | 84.3 | +11.9 | ||
| Registered electors | 8,236 | ||||
| Liberal Unionist hold | Swing | −2.6 | |||
Elections in the 1880s
| Party | Candidate | Votes | % | ± | |
|---|---|---|---|---|---|
| Liberal | Thomas Buchanan | 3,294 | 50.4 | +6.7 | |
| Liberal Unionist | Thomas Raleigh | 3,248 | 49.6 | −6.7 | |
| Majority | 46 | 0.8 | N/A | ||
| Turnout | 6,542 | 84.4 | +12.0 | ||
| Registered electors | 7,749 | ||||
| Liberal gain from Liberal Unionist | Swing | +6.7 | |||
- Caused by Buchanan's resignation to seek re-election as a Liberal candidate.
| Party | Candidate | Votes | % | ± | |
|---|---|---|---|---|---|
| Liberal Unionist | Thomas Buchanan | 3,083 | 56.3 | +15.4 | |
| Liberal | Robert Wallace | 2,393 | 43.7 | −15.4 | |
| Majority | 690 | 12.6 | N/A | ||
| Turnout | 5,476 | 72.4 | −12.5 | ||
| Registered electors | 7,565 | ||||
| Liberal Unionist gain from Liberal | Swing | +15.4 | |||
| Party | Candidate | Votes | % | ± | |
|---|---|---|---|---|---|
| Liberal | Thomas Buchanan | 3,800 | 59.1 | N/A | |
| Conservative | George Auldjo Jamieson | 2,625 | 40.9 | N/A | |
| Majority | 1,175 | 18.2 | N/A | ||
| Turnout | 6,425 | 84.9 | N/A | ||
| Registered electors | 7,565 | ||||
| Liberal win (new seat) | |||||
See also
Notes and references
- References
- 1 2 "Nicola Sturgeon learned of SNP MP allegations from Sunday newspaper". BBC News. Retrieved 1 October 2015.
- ↑ Redistribution of Seats Act 1885, Sixth Schedule
- ↑ Fifth Periodical Review, Boundary Commission for Scotland Archived 21 September 2007 at the Wayback Machine.
- ↑ Leigh Rayment's Historical List of MPs – Constituencies beginning with "E" (part 1)
- ↑ http://www.edinburgh.gov.uk/info/20033/elections_and_voting/1585/who_you_can_vote_for
- ↑ "Election Data 2015". Electoral Calculus. Archived from the original on 17 October 2015. Retrieved 17 October 2015.
- ↑ Council, The City of Edinburgh. "The City of Edinburgh Council download - UK Parliamentary election results 2015 - Council and democracy - Elections and voting - Election results". www.edinburgh.gov.uk.
- ↑ "Election Data 2010". Electoral Calculus. Archived from the original on 26 July 2013. Retrieved 17 October 2015.
- ↑ "Lib Dems' Barrett to quit as MP". BBC News. 2009-07-25. Retrieved 2010-05-01.
- ↑ "BBC NEWS – Election 2010 – Edinburgh West". BBC News.
- ↑ "Election Data 2005". Electoral Calculus. Archived from the original on 15 October 2011. Retrieved 18 October 2015.
- ↑ "Election Data 2001". Electoral Calculus. Archived from the original on 15 October 2011. Retrieved 18 October 2015.
- ↑ "Election Data 1997". Electoral Calculus. Archived from the original on 15 October 2011. Retrieved 18 October 2015.
- ↑ "Political Science Resources: links to UK and US politics". www.psr.keele.ac.uk.
- ↑ "Election Data 1992". Electoral Calculus. Archived from the original on 15 October 2011. Retrieved 18 October 2015.
- ↑ "Politics Resources". Election 1992. Politics Resources. 9 April 1992. Retrieved 6 Dec 2010.
- ↑ "Election Data 1987". Electoral Calculus. Archived from the original on 15 October 2011. Retrieved 18 October 2015.
- ↑ "Election Data 1983". Electoral Calculus. Archived from the original on 15 October 2011. Retrieved 18 October 2015.
- ↑ The Times' Guide to the House of Commons. 1950.
- ↑ Whitaker's Almanack, 1944
- ↑ Whitaker's Almanack, 1939
- ↑ The Times House of Commons, 1935
- ↑ Whitaker's Almanack, 1934
- 1 2 3 4 5 British Parliamentary Election Results 1885-1918, FWS Craig
- ↑ Oliver and Boyd's Edinburgh Almanack, 1927
- ↑ British Parliamentary Election Results 1918-1949, FWS Craig
- ↑ Whitaker's Almanack, 1920
- 1 2 Debrett's House of Commons and the Judicial Bench, 1916
- 1 2 3 4 5 6 7 8 Craig, FWS, ed. (1974). British Parliamentary Election Results: 1885-1918. London: Macmillan Press. ISBN 9781349022984.
- 1 2 3 Whitaker's Almanack, 1907
- ↑ Whitaker's Almanack, 1893
- 1 2 3 Debrett's House of Commons and Judicial Bench, 1889
- Notes
- ↑ As with all extant examples of constituencies nationwide (since 1955) it elects one Member of Parliament (MP) by the first past the post system of election.