Birmingham Northfield (UK Parliament constituency)
Coordinates: 52°24′N 1°59′W / 52.40°N 1.98°W
| Birmingham, Northfield | |
|---|---|
|
Borough constituency for the House of Commons | |
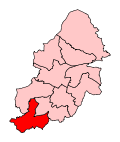 Boundary of Birmingham, Northfield in Birmingham. | |
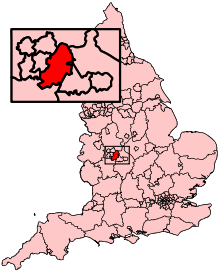 Location of Birmingham within England. | |
| County | West Midlands |
| Population | 101,422 (2011 census)[1] |
| Electorate | 72,190 (December 2010)[2] |
| Current constituency | |
| Created | 1950 |
| Member of parliament | Richard Burden (Labour) |
| Number of members | One |
| Created from | Birmingham King's Norton |
| Overlaps | |
| European Parliament constituency | West Midlands |
Birmingham, Northfield is a constituency[n 1] created in 1950 represented in the House of Commons of the UK Parliament since 1992 by Richard Burden of the Labour Party.[n 2] It represents the southernmost part of the city of Birmingham.
Members of Parliament
Constituency profile
Among the area's largest features are the closed MG Rover Group factory that was formerly a major employer in the constituency and closed down in the run up to the 2005 general election, a large hospital and the North Worcestershire Golf Course.[4] The Labour MP Richard Burden was nonetheless returned, albeit with a majority reduced by 5.6%. He was re-elected, with a majority reduced by 14.1%,[n 3] in 2010. In 2015, Burden was re-elected with a majority of 2,509 votes and a vote share of 41.6%, which made Northfield the most marginal seat in Birmingham, as the margin in nearby Birmingham Edgbaston, traditionally Labour's weakest seat in the city, rose to be 197 votes more than Northfield. Two years later at the 2017 snap election, Burden had increased his majority to 4,667 votes and his vote share to 53.2% on an overall turnout of 44,348 voters; despite this, due to the Labour majority in Edgbaston rising to almost 7,000 votes, Northfield is now Labour's weakest seat in Birmingham by a considerable margin.
Boundaries
1950-1955: The County Borough of Birmingham Wards of Northfield, Selly Oak, and Weoley.[5]
1955-1974: The County Borough of Birmingham wards of King's Norton, Northfield, and Weoley.
1974-1983: As above less King's Norton, plus Longbridge
1983-1997: The City of Birmingham wards of Bartley Green, Longbridge, Northfield, and Weoley.
1997-2010: As above less Bartley Green
2010–present: As above plus King's Norton
Following the review of parliamentary representation in Birmingham and the West Midlands,[6] the Boundary Commission for England created a modified Northfield seat which gained the ward of Kings Norton (previously in the Selly Oak constituency).
History
- Summary of results
The 2015 result gave the seat the 26th-smallest majority of Labour's 232 seats by percentage of majority.[7]
Since creation in 1950, Labour Party MPs have been elected and served the seat with the exception of the period from 1979 to 1992 while the Conservative Party were in government, with a one-year gap caused by a Labour win in a by-election, in 1982. From 1979 to 1982 the MP was a member of the influential and large Cadbury family, Jocelyn Cadbury.
- Opposition parties
The Conservative candidate for 2015, MacLean, came within 5.9% of winning the seat. UKIP's swing nationally was +9.5% in 2015; here it was 13.5%, enabling a third place, having been fifth-placed in the previous election. The other two candidates standing, for parties other than Labour on the left wing, narrowly forfeited their deposits
- Turnout
Turnout has ranged between 84.7% in 1950 and 52.8% in 2001 (which was below the percentage of the by-election, in 1982).
Elections
Elections in the 2010s
| Party | Candidate | Votes | % | ± | |
|---|---|---|---|---|---|
| Labour | Richard Burden | 23,596 | 53.2 | ||
| Conservative | Meg Powell-Chandler | 18,929 | 42.7 | ||
| Liberal Democrat | Roger Harmer | 959 | 2.2 | ||
| Green | Eleanor Masters | 864 | 1.9 | ||
| Majority | 4,667 | 10.5 | |||
| Turnout | 44,348 | 61.3 | |||
| Labour hold | Swing | ||||
| Party | Candidate | Votes | % | ± | |
|---|---|---|---|---|---|
| Labour | Richard Burden | 17,673 | 41.6 | ||
| Conservative | Rachel Maclean | 15,164 | 35.7 | ||
| UKIP | Keith Rowe | 7,106 | 16.7 | ||
| Liberal Democrat | Steve Haynes | 1,349 | 3.2 | ||
| Green | Anna Masters[10] | 1,169 | 2.8 | ||
| Majority | 2,509 | 5.9 | |||
| Turnout | 42,461 | 59.4 | |||
| Labour hold | Swing | ||||
Going into the 2015 general election, this was the 121st most marginal constituency in Great Britain, the Conservatives requiring a swing from Labour of 3.3% to take the seat (based on the result of the 2010 general election).[11]
| Party | Candidate | Votes | % | ± | |
|---|---|---|---|---|---|
| Labour | Richard Burden | 16,841 | 40.3 | ||
| Conservative | Keely Huxtable | 14,059 | 33.6 | ||
| Liberal Democrat | Mike Dixon | 6,550 | 15.7 | ||
| BNP | Les Orton | 2,290 | 5.5 | ||
| UKIP | John Borthwick | 1,363 | 3.3 | ||
| Green | Susan Pearce | 406 | 1.0 | N/A | |
| Common Good | Dick Rodgers | 305 | 0.7 | ||
| Majority | 2,782 | 6.7 | |||
| Turnout | 41,814 | 58.6 | |||
| Labour hold | Swing | ||||
Elections in the 2000s
| Party | Candidate | Votes | % | ± | |
|---|---|---|---|---|---|
| Labour | Richard Burden | 15,419 | 49.6 | ||
| Conservative | Vicky Ford | 8,965 | 28.9 | ||
| Liberal Democrat | Trevor Sword | 4,171 | 13.4 | +2.2 | |
| BNP | Mark Cattell | 1,278 | 4.1 | N/A | |
| UKIP | Gillian Chant | 641 | 2.1 | ||
| Common Good | Richard Rogers | 428 | 1.4 | N/A | |
| Socialist Alternative | Louise Houdley | 120 | 0.4 | N/A | |
| Workers Revolutionary | Frank Sweeney | 34 | 0.1 | N/A | |
| Majority | 6,454 | 20.8 | |||
| Turnout | 31,056 | 56.6 | |||
| Labour hold | Swing | ||||
| Party | Candidate | Votes | % | ± | |
|---|---|---|---|---|---|
| Labour | Richard Burden | 16,528 | 56.0 | ||
| Conservative | Nils Purser | 8,730 | 29.6 | ||
| Liberal Democrat | Trevor Sword | 3,322 | 11.2 | ||
| UKIP | Stephen Rogers | 550 | 1.9 | N/A | |
| Socialist Alliance | Clive Walder | 193 | 0.7 | N/A | |
| Socialist Labour | Zane Carpenter | 151 | 0.5 | N/A | |
| Communist | Andrew Chaffer | 60 | 0.2 | N/A | |
| Majority | 7,798 | 26.4 | |||
| Turnout | 29,534 | 52.8 | |||
| Labour hold | Swing | ||||
Elections in the 1990s
| Party | Candidate | Votes | % | ± | |
|---|---|---|---|---|---|
| Labour | Richard Burden | 22,316 | 57.4 | ||
| Conservative | Alan C. Blumenthal | 10,873 | 28.0 | ||
| Liberal Democrat | Micheal R. Ashell | 4,078 | 10.5 | ||
| Referendum | David Gent | 1,243 | 3.2 | N/A | |
| BNP | Keith A. Axon | 337 | 0.9 | N/A | |
| Majority | 11,443 | 29.5 | |||
| Turnout | 38,847 | 68.3 | |||
| Labour hold | Swing | ||||
| Party | Candidate | Votes | % | ± | |
|---|---|---|---|---|---|
| Labour | Richard Burden | 24,443 | 45.5 | ||
| Conservative | Roger King | 23,803 | 44.4 | ||
| Liberal Democrat | David L. Cropp | 5,431 | 10.1 | ||
| Majority | 630 | 1.1 | |||
| Turnout | 53,667 | 76.1 | |||
| Labour gain from Conservative | Swing | ||||
Election in the 1980s
| Party | Candidate | Votes | % | ± | |
|---|---|---|---|---|---|
| Conservative | Roger King | 24,024 | 45.1 | ||
| Labour | John Spellar | 20,889 | 39.2 | ||
| Social Democratic | John Gordon | 8,319 | 15.6 | ||
| Majority | 3,135 | 5.9 | |||
| Turnout | 53,232 | 72.6 | |||
| Conservative hold | Swing | ||||
| Party | Candidate | Votes | % | ± | |
|---|---|---|---|---|---|
| Conservative | Roger King | 22,596 | 42.7 | ||
| Labour | John Spellar | 19,836 | 37.5 | ||
| Liberal | David Webb | 10,045 | 19.0 | ||
| Communist | Peter Sheppard | 420 | 0.8 | N/A | |
| Majority | 2,760 | 5.2 | |||
| Turnout | 52,897 | 71.2 | |||
| Conservative gain from Labour | Swing | ||||
| Party | Candidate | Votes | % | ± | |
|---|---|---|---|---|---|
| Labour | John Spellar | 15,904 | 36.3 | ||
| Conservative | Roger Gale | 15,615 | 35.6 | ||
| Liberal | Stephen Ridley | 11,453 | 26.1 | ||
| National Front | Ian Anderson | 411 | 0.9 | ||
| Communist | Peter Sheppard | 349 | 0.8 | N/A | |
| People's Progressive Party | Ronald Taylor | 63 | 0.2 | N/A | |
| Democratic Monarchist, Public Safety, White Resident | Bill Boaks | 60 | 0.1 | N/A | |
| Majority | 289 | 0.7 | |||
| Turnout | 43,855 | 55.0 | |||
| Labour gain from Conservative | Swing | ||||
Elections in the 1970s
| Party | Candidate | Votes | % | ± | |
|---|---|---|---|---|---|
| Conservative | Jocelyn Cadbury | 25,304 | 45.4 | ||
| Labour | Raymond Carter | 25,100 | 45.1 | ||
| Liberal | Roy Lewthwaite | 4,538 | 8.2 | ||
| National Front | R.A. Newman | 614 | 1.1 | N/A | |
| Workers Revolutionary | J.E. Beale | 144 | 0.3 | N/A | |
| Majority | 204 | 0.4 | |||
| Turnout | 55,700 | 70.6 | |||
| Conservative gain from Labour | Swing | ||||
| Party | Candidate | Votes | % | ± | |
|---|---|---|---|---|---|
| Labour | Raymond Carter | 27,435 | 52.1 | ||
| Conservative | Jocelyn Cadbury | 16,838 | 32.0 | ||
| Liberal | David Hains | 7,851 | 14.9 | N/A | |
| PEOPLE | Elizabeth A. Davenport | 359 | 0.7 | N/A | |
| Communist | Derek Robinson | 180 | 0.3 | ||
| Majority | 10,597 | 20.1 | |||
| Turnout | 52,663 | 67.9 | |||
| Labour hold | Swing | ||||
| Party | Candidate | Votes | % | ± | |
|---|---|---|---|---|---|
| Labour | Raymond Carter | 31,704 | 56.1 | ||
| Conservative | John Butcher | 23,175 | 41.0 | ||
| Independent | M. Newman | 1,237 | 2.2 | N/A | |
| Communist | Derek Robinson | 368 | 0.7 | ||
| Majority | 8,529 | 15.1 | |||
| Turnout | 56,484 | 73.5 | |||
| Labour hold | Swing | ||||
| Party | Candidate | Votes | % | ± | |
|---|---|---|---|---|---|
| Labour | Raymond Carter | 33,364 | 50.5 | ||
| Conservative | David W. Bell | 32,148 | 48.6 | ||
| Communist | Derek Robinson | 605 | 0.9 | ||
| Majority | 1,216 | 1.8 | |||
| Turnout | 66,117 | 68.3 | |||
| Labour hold | Swing | ||||
Elections in the 1960s
| Party | Candidate | Votes | % | ± | |
|---|---|---|---|---|---|
| Labour | Donald Chapman | 36,801 | 58.7 | ||
| Conservative | Christopher Cromwell Chalker | 24,899 | 39.7 | ||
| Communist | Derek Robinson | 1,029 | 1.6 | N/A | |
| Majority | 11,902 | 19.0 | |||
| Turnout | 62,729 | 75.1 | |||
| Labour hold | Swing | ||||
| Party | Candidate | Votes | % | ± | |
|---|---|---|---|---|---|
| Labour | Donald Chapman | 29,301 | 47.2 | ||
| Conservative | Herbert Banner Adkins | 25,063 | 40.4 | ||
| Liberal | Roy Lewthwaite | 7,682 | 12.4 | N/A | |
| Majority | 4,238 | 6.8 | |||
| Turnout | 62,046 | 77.2 | |||
| Labour hold | Swing | ||||
Election in the 1950s
| Party | Candidate | Votes | % | ± | |
|---|---|---|---|---|---|
| Labour | Donald Chapman | 29,587 | 50.8 | ||
| Conservative | Reginald Eyre | 28,647 | 49.2 | ||
| Majority | 940 | 1.6 | |||
| Turnout | 58,234 | 78.5 | |||
| Labour hold | Swing | ||||
| Party | Candidate | Votes | % | ± | |
|---|---|---|---|---|---|
| Labour | Donald Chapman | 27,072 | 52.8 | ||
| Conservative | Clement Sweet | 24,188 | 47.2 | ||
| Majority | 2,884 | 5.6 | |||
| Turnout | 51,260 | 78.6 | |||
| Labour hold | Swing | ||||
| Party | Candidate | Votes | % | ± | |
|---|---|---|---|---|---|
| Labour | Donald Chapman | 26,580 | 52.8 | ||
| Conservative | Maurice Chandler | 23,730 | 47.2 | ||
| Majority | 2,850 | 5.7 | |||
| Turnout | 50,310 | 83.4 | |||
| Labour hold | Swing | ||||
| Party | Candidate | Votes | % | ± | |
|---|---|---|---|---|---|
| Labour | Raymond Blackburn | 26,714 | 53.0 | N/A | |
| Conservative | Tom Iremonger | 19,974 | 39.6 | N/A | |
| Liberal | Evan Laurence Frederick Richards | 3,280 | 6.5 | N/A | |
| Communist | Richard Albert Etheridge | 479 | 1.0 | N/A | |
| Majority | 6,740 | 13.4 | N/A | ||
| Turnout | 50,447 | 84.7 | N/A | ||
| Labour win (new seat) | |||||
See also
Notes and references
- Notes
- ↑ A borough constituency (for the purposes of election expenses and type of returning officer)
- ↑ As with all constituencies, the constituency elects one Member of Parliament (MP) by the first past the post system of election at least every five years.
- ↑ Which leaves the incumbent MP with a majority of 6.7%
- References
- ↑ "Birmingham, Northfield: Usual Resident Population, 2011". Neighbourhood Statistics. Office for National Statistics. Retrieved 30 January 2015.
- ↑ "Electorate Figures - Boundary Commission for England". 2011 Electorate Figures. Boundary Commission for England. 4 March 2011. Archived from the original on 6 November 2010. Retrieved 13 March 2011.
- ↑ Leigh Rayment's Historical List of MPs – Constituencies beginning with "N" (part 3)
- ↑ Ordnance survey website
- ↑ Craig, F.W.S., ed. (1972). Boundaries of parliamentary constituencies 1985-1972. Chichester, Sussex: Political Reference Publications. ISBN 0-900178-09-4.
- ↑ http://www.boundarycommissionforengland.org.uk/review_areas/West_Midlands_Boroughs/images/Birmingham_OM_RR.gif%5Bpermanent+dead+link%5D
- ↑ List of Labour MPs elected in 2015 by % majority UK Political.info. Retrieved 2017-01-29
- ↑ "Statement of Persons Nominated and notice of poll". Birmingham City Council. Retrieved 11 May 2017.
- ↑ "Election Data 2015". Electoral Calculus. Archived from the original on 17 October 2015. Retrieved 17 October 2015.
- ↑ "Archived copy". Archived from the original on 2015-04-02. Retrieved 2015-03-27.
- ↑ Ransome Mpini; Charlotte Thornton; John Walton; Marcelo Zanni (24 February 2014). "Election 2015: The political battleground". BBC News. Retrieved 29 January 2015.
- ↑ "Election Data 2010". Electoral Calculus. Archived from the original on 26 July 2013. Retrieved 17 October 2015.
- ↑ Statement of Persons Nominated and Notice of Poll 2010
- ↑ "Election Data 2005". Electoral Calculus. Archived from the original on 15 October 2011. Retrieved 18 October 2015.
- ↑ "Election Data 2001". Electoral Calculus. Archived from the original on 15 October 2011. Retrieved 18 October 2015.
- ↑ "Election Data 1997". Electoral Calculus. Archived from the original on 15 October 2011. Retrieved 18 October 2015.
- ↑ "Election Data 1992". Electoral Calculus. Archived from the original on 15 October 2011. Retrieved 18 October 2015.
- ↑ "Politics Resources". Election 1992. Politics Resources. 9 April 1992. Retrieved 2010-12-06.
- ↑ "Election Data 1987". Electoral Calculus. Archived from the original on 15 October 2011. Retrieved 18 October 2015.
- ↑ "Election Data 1983". Electoral Calculus. Archived from the original on 15 October 2011. Retrieved 18 October 2015.