Leigh (UK Parliament constituency)
| Leigh | |
|---|---|
|
County constituency for the House of Commons | |
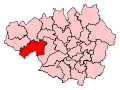 Boundary of Leigh in Greater Manchester. | |
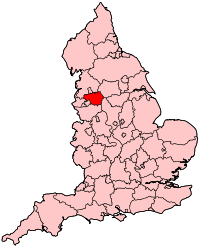 Location of Greater Manchester within England. | |
| County | Greater Manchester |
| Electorate | 77,001 (December 2010)[1] |
| Current constituency | |
| Created | 1885 |
| Member of parliament | Joanne Platt (Labour) |
| Number of members | One |
| Created from | South West Lancashire |
| Overlaps | |
| European Parliament constituency | North West England |
Leigh is a constituency[n 1] in Greater Manchester represented in the House of Commons of the UK Parliament since 2017 by Joanne Platt of the Labour Party.
Prior to this, the seat was represented by Andy Burnham of the Labour Party, who served as the MP from 2001, and Shadow Home Secretary in Jeremy Corbyn's Shadow Cabinet until October 2016.[n 2] Burnham stood down following his victory at the 2017 Greater Manchester mayoral election.
Boundaries
Leigh is a Labour safe seat within the Metropolitan Borough of Wigan with virtually all wards held by the party at local level, although it does contain the more Conservative-inclined area of Lowton East.
Following the review of parliamentary representation in Greater Manchester in 2009, the Boundary Commission for England recommended alterations to constituencies in the Wigan area. The electoral wards used in the altered Leigh constituency are:
- Astley, Mosley Common, Atherleigh, Golborne and Lowton West, Leigh East, Leigh South, Leigh West, Lowton East and Tyldesley all from the Metropolitan Borough of Wigan
History
The seat was created in the Redistribution of Seats Act 1885. Since 1922 it has been served by candidates belonging to the Labour Party continuously, which for the political party makes it one of their longest held seats, the most recent incumbent was Shadow Home Secretary from September 2015 to October 2016.
Members of Parliament
Elections
Elections in the 2010s
| Party | Candidate | Votes | % | ± | |
|---|---|---|---|---|---|
| Labour | Joanne Platt | 26,347 | 56.2 | +2.3 | |
| Conservative | James Grundy | 16,793 | 35.8 | +13.2 | |
| UKIP | Mark Bradley | 2,783 | 5.9 | -13.8 | |
| Liberal Democrat | Richard Kilpatrick | 951 | 2.0 | -0.5 | |
| Majority | 9,554 | 20.3 | -10.3 | ||
| Turnout | 46,978 | 61.5 | +4.1 | ||
| Labour hold | Swing | -5.4 | |||
| Party | Candidate | Votes | % | ± | |
|---|---|---|---|---|---|
| Labour | Andy Burnham | 24,312 | 53.9 | +5.8 | |
| Conservative | Louisa Townson | 10,216 | 22.6 | +1.7 | |
| UKIP | Les Leggett | 8,903 | 19.7 | +16.3 | |
| Liberal Democrat | Bill Winlow | 1,150 | 2.5 | −15.6 | |
| TUSC | Stephen Hall | 542 | 1.2 | N/A | |
| Majority | 14,096 | 31.2 | +4.1 | ||
| Turnout | 45,123 | 59.4 | −2.6 | ||
| Labour hold | Swing | +2.0 | |||
| Party | Candidate | Votes | % | ± | |
|---|---|---|---|---|---|
| Labour | Andy Burnham | 21,295 | 48.0 | −15.3 | |
| Conservative | Shazia Awan | 9,284 | 20.9 | +3.2 | |
| Liberal Democrat | Chris Blackburn | 8,049 | 18.2 | −2.1 | |
| BNP | Gary Chadwick | 2,724 | 6.1 | N/A | |
| UKIP | Mary Lavelle | 1,535 | 3.5 | N/A | |
| Independent | Norman Bradbury | 988 | 2.2 | N/A | |
| Independent | Terry Dainty | 320 | 0.7 | N/A | |
| Christian | Ryan Hessell | 137 | 0.3 | N/A | |
| Majority | 12,011 | 27.1 | -20.2 | ||
| Turnout | 44,332 | 62.0 | +10.7 | ||
| Labour hold | Swing | −4.9 | |||
Elections in the 2000s
| Party | Candidate | Votes | % | ± | |
|---|---|---|---|---|---|
| Labour | Andy Burnham | 23,097 | 63.3 | −1.2 | |
| Conservative | Laurance Wedderburn | 5,825 | 16.0 | −2.2 | |
| Liberal Democrat | Dave Crowther | 4,962 | 13.6 | +0.8 | |
| Community Action | Ian Franzen | 2,185 | 6.0 | N/A | |
| Legalise Cannabis | Thomas Hampson | 415 | 1.1 | N/A | |
| Majority | 17,272 | 47.3 | |||
| Turnout | 36,484 | 50.3 | +0.6 | ||
| Labour hold | Swing | +0.5 | |||
| Party | Candidate | Votes | % | ± | |
|---|---|---|---|---|---|
| Labour | Andy Burnham | 22,783 | 64.5 | −4.4 | |
| Conservative | Andrew Oxley | 6,421 | 18.2 | +2.6 | |
| Liberal Democrat | Ray Atkins | 4,524 | 12.8 | +1.6 | |
| Socialist Labour | William Kelly | 820 | 2.3 | N/A | |
| UKIP | Chris Best | 750 | 2.1 | N/A | |
| Majority | 16,362 | 46.3 | |||
| Turnout | 35,298 | 49.7 | −16.0 | ||
| Labour hold | Swing | −3.5 | |||
Elections in the 1990s
| Party | Candidate | Votes | % | ± | |
|---|---|---|---|---|---|
| Labour Co-op | Lawrence Cunliffe | 31,652 | 68.9 | +7.6 | |
| Conservative | Edward Young | 7,156 | 15.6 | −9.9 | |
| Liberal Democrat | Peter Hough | 5,163 | 11.2 | −1.4 | |
| Referendum | Roy Constable | 1,949 | 4.2 | N/A | |
| Majority | 24,496 | 53.3 | |||
| Turnout | 45,920 | 65.7 | |||
| Labour hold | Swing | +8.8 | |||
| Party | Candidate | Votes | % | ± | |
|---|---|---|---|---|---|
| Labour | Lawrence Cunliffe | 32,225 | 61.3 | +2.7 | |
| Conservative | Joseph Egerton | 13,398 | 25.5 | −0.8 | |
| Liberal Democrat | Robert Bleakley | 6,621 | 12.6 | −2.5 | |
| Natural Law | Adrian Tayler | 320 | 0.6 | N/A | |
| Majority | 18,827 | 35.8 | +3.4 | ||
| Turnout | 52,564 | 75.0 | +0.9 | ||
| Labour hold | Swing | +1.7 | |||
Elections in the 1980s
| Party | Candidate | Votes | % | ± | |
|---|---|---|---|---|---|
| Labour | Lawrence Cunliffe | 30,064 | 58.6 | ||
| Conservative | Louis Brown | 13,458 | 26.3 | ||
| Social Democratic | Steven Jones | 7,743 | 15.1 | ||
| Majority | 16,606 | 32.4 | |||
| Turnout | 51,265 | 74.1 | |||
| Labour hold | Swing | ||||
| Party | Candidate | Votes | % | ± | |
|---|---|---|---|---|---|
| Labour | Lawrence Cunliffe | 25,477 | 51.2 | ||
| Conservative | Paul Johnstone | 13,163 | 26.8 | ||
| Social Democratic | David Eccles | 10,468 | 21.3 | ||
| Majority | 12,314 | 25.1 | |||
| Turnout | 49,108 | 72.2 | |||
| Labour hold | Swing | ||||
Elections in the 1970s
| Party | Candidate | Votes | % | ± | |
|---|---|---|---|---|---|
| Labour | Lawrence Cunliffe | 27,736 | 54.1 | ||
| Conservative | David Shaw | 18,713 | 36.5 | ||
| Liberal | M Godwin | 4,796 | 9.4 | ||
| Majority | 9,023 | 17.6 | |||
| Turnout | 51,245 | 76.9 | |||
| Labour hold | Swing | ||||
| Party | Candidate | Votes | % | ± | |
|---|---|---|---|---|---|
| Labour | Harold Boardman | 27,036 | 56.2 | ||
| Conservative | Maureen Williams | 12,401 | 25.8 | ||
| Liberal | Roy D. Pemberton | 8,640 | 18.0 | ||
| Majority | 14,635 | 30.4 | |||
| Turnout | 73.9 | ||||
| Labour hold | Swing | ||||
| Party | Candidate | Votes | % | ± | |
|---|---|---|---|---|---|
| Labour | Harold Boardman | 26,310 | 51.0 | ||
| Conservative | William Legge | 12,663 | 24.6 | ||
| Liberal | Roy D. Pemberton | 12,594 | 24.4 | ||
| Majority | 13,647 | 26.5 | |||
| Turnout | 80.0 | ||||
| Labour hold | Swing | ||||
| Party | Candidate | Votes | % | ± | |
|---|---|---|---|---|---|
| Labour | Harold Boardman | 26,625 | 58.2 | ||
| Conservative | James Peter McGuire | 15,314 | 33.5 | ||
| Ratepayers | Joseph Knowles | 3,776 | 8.3 | ||
| Majority | 11,311 | 27.7 | |||
| Turnout | 71.0 | ||||
| Labour hold | Swing | ||||
Elections in the 1960s
| Party | Candidate | Votes | % | ± | |
|---|---|---|---|---|---|
| Labour | Harold Boardman | 29,552 | 68.7 | ||
| Conservative | Robert R Hipkiss | 13,490 | 31.3 | ||
| Majority | 16,062 | 37.3 | |||
| Turnout | 74.3 | ||||
| Labour hold | Swing | ||||
| Party | Candidate | Votes | % | ± | |
|---|---|---|---|---|---|
| Labour | Harold Boardman | 30,102 | 67.5 | ||
| Conservative | Neville Montague B Brown | 14,478 | 32.5 | ||
| Majority | 15,624 | 35.1 | |||
| Turnout | 77.6 | ||||
| Labour hold | Swing | ||||
Elections in the 1950s
| Party | Candidate | Votes | % | ± | |
|---|---|---|---|---|---|
| Labour | Harold Boardman | 31,672 | 65.2 | ||
| Conservative | William Cameron | 16,897 | 34.8 | ||
| Majority | 14,775 | 30.4 | |||
| Turnout | 82.4 | ||||
| Labour hold | Swing | ||||
| Party | Candidate | Votes | % | ± | |
|---|---|---|---|---|---|
| Labour | Harold Boardman | 30,098 | 62.4 | ||
| Conservative | John Bryan Leck | 18,142 | 37.6 | ||
| Majority | 11,956 | 24.8 | |||
| Turnout | 80.0 | ||||
| Labour hold | Swing | ||||
| Party | Candidate | Votes | % | ± | |
|---|---|---|---|---|---|
| Labour | Harold Boardman | 33,881 | 63.4 | ||
| Conservative | Henry Donald Moore | 19,585 | 36.6 | ||
| Majority | 14,296 | 26.7 | |||
| Turnout | 86.0 | ||||
| Labour hold | Swing | ||||
| Party | Candidate | Votes | % | ± | |
|---|---|---|---|---|---|
| Labour | Harold Boardman | 34,320 | 63.5 | ||
| Conservative | John W Whiteley | 19,720 | 36.5 | ||
| Majority | 14,600 | 27.0 | |||
| Turnout | 87.4 | ||||
| Labour hold | Swing | ||||
Election in the 1940s
| Party | Candidate | Votes | % | ± | |
|---|---|---|---|---|---|
| Labour | Harold Boardman | 32,447 | 69.8 | ||
| Conservative | Eric Heriot Hill | 14,029 | 30.2 | ||
| Majority | 18,418 | 39.6 | |||
| Turnout | 81.0 | ||||
| Labour hold | Swing | ||||
Elections in the 1930s
| Party | Candidate | Votes | % | ± | |
|---|---|---|---|---|---|
| Labour | Joe Tinker | Unopposed | n/a | n/a | |
| Labour hold | Swing | n/a | |||
| Party | Candidate | Votes | % | ± | |
|---|---|---|---|---|---|
| Labour | Joe Tinker | 23,965 | 52.32 | ||
| Conservative | Peter Eckersley | 21,837 | 47.68 | ||
| Majority | 2,128 | 4.65 | |||
| Turnout | 87.38 | ||||
| Labour hold | Swing | ||||
Elections in the 1920s
| Party | Candidate | Votes | % | ± | |
|---|---|---|---|---|---|
| Labour | Joe Tinker | 25,635 | 57.0 | +5.5 | |
| Unionist | Claude Herbert Grundy | 10,942 | 24.3 | −24.2 | |
| Liberal | Thomas Hardy | 8,435 | 18.7 | N/A | |
| Majority | 14,693 | 32.7 | +29.7 | ||
| Turnout | 45,012 | 88.3 | +0.1 | ||
| Registered electors | 50,982 | ||||
| Labour hold | Swing | +14.9 | |||
| Party | Candidate | Votes | % | ± | |
|---|---|---|---|---|---|
| Labour | Joe Tinker | 17,262 | 51.5 | +8.5 | |
| Unionist | Edwin Owen | 16,247 | 48.5 | +21.8 | |
| Majority | 1,015 | 3.0 | −9.7 | ||
| Turnout | 33,509 | 88.2 | +1.7 | ||
| Registered electors | 38,010 | ||||
| Labour hold | Swing | −6.7 | |||
| Party | Candidate | Votes | % | ± | |
|---|---|---|---|---|---|
| Labour | Joe Tinker | 13,989 | 43.0 | −2.0 | |
| Liberal | Robert Burrows | 9,854 | 30.3 | +9.2 | |
| Unionist | Herbert Metcalfe | 8,664 | 26.7 | −7.2 | |
| Majority | 4,135 | 12.7 | +1.6 | ||
| Turnout | 32,507 | 86.5 | −3.4 | ||
| Registered electors | 37,597 | ||||
| Labour hold | Swing | −5.6 | |||
| Party | Candidate | Votes | % | ± | |
|---|---|---|---|---|---|
| Labour | Henry Twist | 15,006 | 45.0 | −1.4 | |
| Unionist | Herbert Metcalfe | 11,279 | 33.9 | N/A | |
| Liberal | Joseph Ashworth | 7,012 | 21.1 | −32.5 | |
| Majority | 3,727 | 11.1 | N/A | ||
| Turnout | 33,297 | 89.9 | +23.0 | ||
| Registered electors | 37,050 | ||||
| Labour gain from Liberal | Swing | +15.6 | |||
Elections in the 1910s
| Party | Candidate | Votes | % | ± | |
|---|---|---|---|---|---|
| Liberal | Peter Raffan | 12,892 | 53.6 | −1.6 | |
| Labour | Richard Owen Jones | 11,146 | 46.4 | N/A | |
| Majority | 1,746 | 7.2 | −3.2 | ||
| Turnout | 24,038 | 66.9 | −20.0 | ||
| Registered electors | 35,912 | ||||
| Liberal hold | Swing | −1.6 | |||
General Election 1914/15
Another General Election was required to take place before the end of 1915. The political parties had been making preparations for an election to take place and by the July 1914, the following candidates had been selected;
- Liberal: Peter Raffan
- Unionist: Frank Hatchard
- Labour: Thomas Greenall
| Party | Candidate | Votes | % | ± | |
|---|---|---|---|---|---|
| Liberal | Peter Raffan | 6,790 | 55.2 | +15.0 | |
| Conservative | William Thomas Oversby | 5,507 | 44.8 | +9.7 | |
| Majority | 1,283 | 10.4 | +5.3 | ||
| Turnout | 12,297 | 86.9 | -6.7 | ||
| Registered electors | 14,150 | ||||
| Liberal hold | Swing | +2.6 | |||
| Party | Candidate | Votes | % | ± | |
|---|---|---|---|---|---|
| Liberal | Peter Raffan | 5,325 | 40.2 | −17.9 | |
| Conservative | F Cuthbert Smith | 4,646 | 35.1 | −6.8 | |
| Labour | Thomas Greenall | 3,268 | 24.7 | N/A | |
| Majority | 679 | 5.1 | −11.1 | ||
| Turnout | 13,239 | 93.6 | +1.3 | ||
| Registered electors | 14,150 | ||||
| Liberal hold | Swing | −5.6 | |||
Elections in the 1900s

| Party | Candidate | Votes | % | ± | |
|---|---|---|---|---|---|
| Liberal | John Brunner | 7,175 | 58.1 | +7.5 | |
| Conservative | Donald MacMaster | 5,169 | 41.9 | −7.5 | |
| Majority | 2,006 | 16.2 | +15.0 | ||
| Turnout | 12,344 | 92.3 | +5.3 | ||
| Registered electors | 13,380 | ||||
| Liberal hold | Swing | +7.5 | |||
| Party | Candidate | Votes | % | ± | |
|---|---|---|---|---|---|
| Liberal | C. P. Scott | 5,239 | 50.6 | −2.9 | |
| Conservative | William Walter Augustine Fitzgerald | 5,119 | 49.4 | +2.9 | |
| Majority | 120 | 1.2 | −5.8 | ||
| Turnout | 10,358 | 87.0 | −2.0 | ||
| Registered electors | 11,907 | ||||
| Liberal hold | Swing | −2.9 | |||
Elections in the 1890s
| Party | Candidate | Votes | % | ± | |
|---|---|---|---|---|---|
| Liberal | C. P. Scott | 5,130 | 53.5 | -1.6 | |
| Conservative | William Walter Augustine Fitzgerald | 4,453 | 46.5 | +1.6 | |
| Majority | 677 | 7.0 | -3.2 | ||
| Turnout | 9,583 | 89.0 | -1.4 | ||
| Registered electors | 10,763 | ||||
| Liberal hold | Swing | -1.6 | |||
| Party | Candidate | Votes | % | ± | |
|---|---|---|---|---|---|
| Liberal | Caleb Wright | 4,899 | 55.1 | −2.7 | |
| Conservative | William Charles Jones | 3,995 | 44.9 | +2.7 | |
| Majority | 904 | 10.2 | −5.4 | ||
| Turnout | 8,894 | 90.4 | +3.7 | ||
| Registered electors | 9,839 | ||||
| Liberal hold | Swing | −2.7 | |||
Elections in the 1880s
| Party | Candidate | Votes | % | ± | |
|---|---|---|---|---|---|
| Liberal | Caleb Wright | 4,297 | 57.8 | -0.7 | |
| Conservative | William Myers | 3,134 | 42.2 | +0.7 | |
| Majority | 1,163 | 15.6 | -1.4 | ||
| Turnout | 7,431 | 86.7 | −5.4 | ||
| Registered electors | 8,572 | ||||
| Liberal hold | Swing | -0.7 | |||

| Party | Candidate | Votes | % | ± | |
|---|---|---|---|---|---|
| Liberal | Caleb Wright | 4,621 | 58.5 | N/A | |
| Conservative | Lees Knowles | 3,275 | 41.5 | N/A | |
| Majority | 1,346 | 17.0 | N/A | ||
| Turnout | 7,896 | 92.1 | N/A | ||
| Registered electors | 8,572 | ||||
| Liberal win (new seat) | |||||
See also
Notes and references
- Notes
- ↑ A borough constituency (for the purposes of election expenses and type of returning officer)
- ↑ As with all constituencies, the constituency elects one Member of Parliament (MP) by the first past the post system of election at least every five years.
- References
- ↑ "Electorate Figures - Boundary Commission for England". 2011 Electorate Figures. Boundary Commission for England. 4 March 2011. Archived from the original on 6 November 2010. Retrieved 13 March 2011.
- ↑ Leigh Rayment's Historical List of MPs – Constituencies beginning with "L" (part 2)
- ↑ "Leigh parliamentary constituency". BBC News.
- ↑ "Leigh parliamentary constituency". Wigan Council.
- ↑ "Election Data 2015". Electoral Calculus. Archived from the original on 17 October 2015. Retrieved 17 October 2015.
- ↑ "Leigh". BBC News. Retrieved 10 May 2015.
- ↑ "Election Data 2010". Electoral Calculus. Archived from the original on 26 July 2013. Retrieved 17 October 2015.
- ↑ The figure reported by the BBC for Burnham (24,295) was incorrect
- ↑ "Election Data 2005". Electoral Calculus. Archived from the original on 15 October 2011. Retrieved 18 October 2015.
- ↑ "Election Data 2001". Electoral Calculus. Archived from the original on 15 October 2011. Retrieved 18 October 2015.
- ↑ "Election Data 1997". Electoral Calculus. Archived from the original on 15 October 2011. Retrieved 18 October 2015.
- ↑ "Election Data 1992". Electoral Calculus. Archived from the original on 15 October 2011. Retrieved 18 October 2015.
- ↑ "UK General Election results April 1992". Richard Kimber's Political Science Resources. Politics Resources. 9 April 1992. Retrieved 2010-12-06.
- ↑ "Election Data 1987". Electoral Calculus. Archived from the original on 15 October 2011. Retrieved 18 October 2015.
- ↑ "UK General Election results April 1992". Richard Kimber's Political Science Resources. Politics Resources. Retrieved 2011-11-06.
- ↑ "Election Data 1983". Electoral Calculus. Archived from the original on 15 October 2011. Retrieved 18 October 2015.
- ↑ "UK General Election results April 1983". Richard Kimber's Political Science Resources. Politics Resources. Retrieved 2011-11-06.
- ↑ "UK General Election results April 1979". Richard Kimber's Political Science Resources. Politics Resources. Retrieved 2011-11-06.
- ↑ "UK General Election results October 1974". Richard Kimber's Political Science Resources. Politics Resources. Retrieved 2011-11-06.
- ↑ "UK General Election results February 1974". Richard Kimber's Political Science Resources. Politics Resources. Retrieved 2011-11-06.
- ↑ "UK General Election results `970". Richard Kimber's Political Science Resources. Politics Resources. Retrieved 2011-11-06.
- ↑ "UK General Election results 1966". Richard Kimber's Political Science Resources. Politics Resources. Retrieved 2011-11-06.
- ↑ "UK General Election results 1964". Richard Kimber's Political Science Resources. Politics Resources. Retrieved 2011-11-06.
- ↑ "UK General Election results 1959". Richard Kimber's Political Science Resources. Politics Resources. Retrieved 2011-11-06.
- ↑ "UK General Election results 1955". Richard Kimber's Political Science Resources. Politics Resources. Retrieved 2011-11-06.
- ↑ "UK General Election results 1951". Richard Kimber's Political Science Resources. Politics Resources. Retrieved 2011-11-06.
- ↑ "UK General Election results `950". Richard Kimber's Political Science Resources. Politics Resources. Retrieved 2011-11-06.
- ↑ "UK General Election results 1945". Richard Kimber's Political Science Resources. Politics Resources. Retrieved 2011-11-06.
- 1 2 3 4 5 Craig, F. W. S. (1983). British parliamentary election results 1918-1949 (3 ed.). Chichester: Parliamentary Research Services. ISBN 0-900178-06-X.
- 1 2 3 4 5 6 7 8 British parliamentary election results, 1885-1918 (Craig)