Lancaster and Fleetwood (UK Parliament constituency)
| Lancaster and Fleetwood | |
|---|---|
|
County constituency for the House of Commons | |
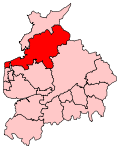 Boundary of Lancaster and Fleetwood in Lancashire for the 2010 general election. | |
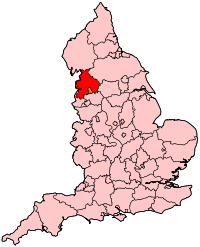 Location of Lancashire within England. | |
| County | Lancashire |
| Electorate | 67,305 (December 2010)[1] |
| Current constituency | |
| Created | 2010 |
| Member of parliament | Cat Smith (Labour) |
| Number of members | One |
| Created from |
Blackpool North and Fleetwood Lancaster and Wyre |
| Overlaps | |
| European Parliament constituency | North West England |
Lancaster and Fleetwood is a constituency[n 1] created in 2010 represented in the House of Commons of the UK Parliament by Cat Smith of the Labour Party.
History
- Creation
Following their review of parliamentary representation in Lancashire, the Boundary Commission created a new Wyre and Preston North constituency, fought at the 2010 general election, which split the previous linking of Lancaster and Wyre. As a consequence, Lancaster and the coastal town of Fleetwood have been attached for parliamentary purposes.
- Summary of results to date
In 2010 the winning candidate was Eric Ollerenshaw, a Conservative. He was defeated in the 2015 general election by Labour's Cat Smith. The 2015 result gave the seat the 16th-smallest majority of Labour's 232 seats by percentage of majority.[2]. Ollerenshaw attempted to regain the seat at the 2017 general election but was again defeated by Smith, who significantly increased her majority to over 6,500.
Boundaries
The new seat of Lancaster and Fleetwood was subject to public consultation following the decision to create a new seat in Lancashire in the run-up to the United Kingdom general election, 2010, which caused major consequential changes to the central and southern parts of the county. During the consultation process, the Wyre ward of Cabus was moved from Lancaster and Fleetwood to Wyre and Preston North.
The seat has electoral wards:
- Bulk, Castle, Duke's, Ellel, John O'Gaunt, Lower Lune Valley, Scotforth East, Scotforth West and University in the City of Lancaster
- Mount, Park, Pharos, Pilling, Preesall, Rossall, Warren and Wyresdale in the borough of Wyre
Members of Parliament
| Election | Member[3] | Party | |
|---|---|---|---|
| 2010 | Eric Ollerenshaw | Conservative | |
| 2015 | Cat Smith | Labour | |
Elections
Elections in the 2010s
| Party | Candidate | Votes | % | ± | |
|---|---|---|---|---|---|
| Labour | Cat Smith | 25,342 | 55.1 | +12.8 | |
| Conservative | Eric Ollerenshaw | 18,681 | 40.6 | +1.4 | |
| Liberal Democrat | Robin Long | 1,170 | 2.5 | -0.8 | |
| Green | Rebecca Novell | 796 | 1.7 | -3.3 | |
| Majority | 6,661 | 14.5 | +11.5 | ||
| Turnout | 45,989 | 68.7 | +0.1 | ||
| Labour hold | Swing | +5.7 | |||
| Party | Candidate | Votes | % | ± | |
|---|---|---|---|---|---|
| Labour | Cat Smith | 17,643 | 42.3 | +7.0 | |
| Conservative | Eric Ollerenshaw | 16,378 | 39.2 | +3.2 | |
| UKIP | Matthew Atkins | 4,060 | 9.7 | +7.3 | |
| Green | Chris Coates | 2,093 | 5.0 | +0.6 | |
| Liberal Democrat | Robin Long | 1,390 | 3.3 | −15.8 | |
| Northern | Harold Elletson | 174 | 0.4 | +0.4 | |
| Majority | 1,265 | 3.0 | |||
| Turnout | 41,738 | 68.6 | +7.5 | ||
| Labour gain from Conservative | Swing | +1.9 | |||
| Party | Candidate | Votes | % | ± | |
|---|---|---|---|---|---|
| Conservative | Eric Ollerenshaw | 15,404 | 36.1 | +2.5 | |
| Labour | Clive Grunshaw | 15,071 | 35.3 | −7.1 | |
| Liberal Democrat | Stuart Langhorn | 8,167 | 19.1 | +3.5 | |
| Green | Gina Dowding | 1,888 | 4.4 | −1.4 | |
| UKIP | Fred McGlade | 1,020 | 2.4 | −0.1 | |
| BNP | Debra Kent | 938 | 2.2 | N/A | |
| Independent | Keith Riley | 213 | 0.5 | +0.5 | |
| Majority | 333 | 0.8 | |||
| Turnout | 42,701 | 61.1 | +1.6 | ||
| Conservative gain from Labour | Swing | +4.8 | |||
See also
Notes
- ↑ A county constituency (for the purposes of election expenses and type of returning officer). As with all current seats, its electorate elects one Member of Parliament (MP) by the first past the post voting system.
References
- ↑ "Electorate Figures – Boundary Commission for England". 2011 Electorate Figures. Boundary Commission for England. 4 March 2011. Archived from the original on 6 November 2010. Retrieved 13 March 2011.
- ↑ List of Labour MPs elected in 2015 by % majority UK Political.info. Retrieved 2017-01-29
- ↑ Leigh Rayment's Historical List of MPs – Constituencies beginning with "L" (part 1)
- ↑ "Lancaster & Fleetwood parliamentary constituency". BBC News.
- ↑ "Election Data 2015". Electoral Calculus. Archived from the original on 17 October 2015. Retrieved 17 October 2015.
- ↑ "Lancaster & Fleetwood". BBC News. Retrieved 11 May 2015.
- ↑ "Election Data 2010". Electoral Calculus. Archived from the original on 26 July 2013. Retrieved 17 October 2015.
Culture and infrastructure of the City of Lancaster | |||||||||||||
|---|---|---|---|---|---|---|---|---|---|---|---|---|---|
| Transport | |||||||||||||
| Parks & reserves | |||||||||||||
| Sport | |||||||||||||
| Media | |||||||||||||
| Politics | |||||||||||||
| Education |
| ||||||||||||
| |||||||||||||