European Parliament election, 2009 (United Kingdom)
|
| |||||||||||||||||||||||||||||||||||||||||||||||||||||||||||||||||||||||||||||
| |||||||||||||||||||||||||||||||||||||||||||||||||||||||||||||||||||||||||||||
All 72 of the United Kingdom's seats in the European Parliament | |||||||||||||||||||||||||||||||||||||||||||||||||||||||||||||||||||||||||||||
|---|---|---|---|---|---|---|---|---|---|---|---|---|---|---|---|---|---|---|---|---|---|---|---|---|---|---|---|---|---|---|---|---|---|---|---|---|---|---|---|---|---|---|---|---|---|---|---|---|---|---|---|---|---|---|---|---|---|---|---|---|---|---|---|---|---|---|---|---|---|---|---|---|---|---|---|---|---|
| Turnout |
34.7%[1] | ||||||||||||||||||||||||||||||||||||||||||||||||||||||||||||||||||||||||||||
| |||||||||||||||||||||||||||||||||||||||||||||||||||||||||||||||||||||||||||||
 | |||||||||||||||||||||||||||||||||||||||||||||||||||||||||||||||||||||||||||||
.jpg)
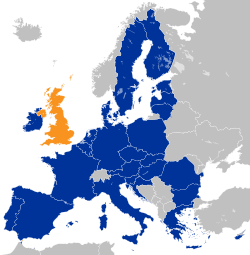
The European Parliament election was the United Kingdom's component of the 2009 European Parliament election, the voting for which was held on Thursday 4 June 2009. The election was held concurrently with the 2009 local elections in England. In total, 72 Members of the European Parliament were elected from the United Kingdom using proportional representation.
Notable outcomes were the significant drop in support for the Labour Party, who came third, and the UK Independence Party (UKIP) finishing second in a major election for the first time in its history, coming level with Labour in terms of seats but ahead of them in terms of votes. This was the first time in British electoral history that a party in government had been outpolled in a national election by a party with no representation in the House of Commons. The BNP also won two seats, its first ever in a nationwide election.[3] It also marked the first time the Scottish National Party (SNP) won the largest share of the European election vote in Scotland,[4] and it was the first time since 1918 Labour had failed to come first in a Welsh election.[5] It was the Democratic Unionist Party's (DUP) worst ever European election result, and also the first time an Irish Republican party, Sinn Féin, topped the poll in Northern Ireland.[6]
Background
Electoral system
The United Kingdom elected 72 Members of the European Parliament using proportional representation. The United Kingdom was divided into twelve multi-member constituencies. The eleven of these regions which form Great Britain used a closed-list party list system method of proportional representation, calculated using the D'Hondt method. Northern Ireland used the Single Transferable Vote (STV).
The experimental use of all-postal ballots in four regions in 2004 was not repeated, resulting in a sharp reduction in turnout in those regions.[7]
Constituencies and representation
As has been the case since 1999, the electoral constituencies were based on the government's nine English regions, Scotland, Northern Ireland and Wales, creating a total of 12 constituencies. The Treaty of Nice fixed the number of MEPs for the whole European Parliament at 736; as a consequence of the accession of Romania and Bulgaria in 2007, the number of seats allocated to the United Kingdom was reduced from 78 to 72. If the Lisbon Treaty had entered into force by June 2009 this figure would have been 73. On 31 July 2007, in line with the required reduction in representation from the United Kingdom the number of members elected from each region was modified by the Boundary Commission and Electoral Commission, based on the size of the electorate in each region. The recommended changes were approved by the Parliament of the United Kingdom in 2008.[8]
Changes in regional seat allocations[9]
| Constituency | Representation in 2004 | Representation in 2009 | Net Gain/Loss |
|---|---|---|---|
| East Midlands | 6 | 5 | |
| East of England | 7 | 7 | |
| London | 9 | 8 | |
| North East England | 3 | 3 | |
| North West England | 9 | 8 | |
| Northern Ireland | 3 | 3 | |
| Scotland | 7 | 6 | |
| South East England | 10 | 10 | |
| South West England1 | 7 | 6 | |
| Wales | 4 | 4 | |
| West Midlands | 7 | 6 | |
| Yorkshire and the Humber | 6 | 6 | |
| Overall | 78 | 72 |
1Includes Gibraltar, the only British overseas territory which is part of the EU.
MEPs retiring
Conservative
- Christopher Beazley (East of England)
- John Bowis (London)
- Philip Bushill-Matthews (West Midlands)
- Jonathan Evans (Wales) – Became MP for Cardiff North in 2010
- Chris Heaton-Harris (East Midlands) – Became MP for Daventry in 2010
- Caroline Jackson (South West England)
- Neil Parish (South West England) – Became MP for Tiverton and Honiton in 2010
- John Purvis (Scotland)
- David Sumberg (North West England)
Labour
UKIP
- Jeffrey Titford (East of England)
- John Whittaker (North West England)
- Roger Knapman (South West England)
Liberal Democrat
Independents
- Den Dover (North West England) – Former Conservative MEP, expelled over his expenses.
- Robert Kilroy-Silk (East Midlands) – Former UKIP MEP, created new party Veritas.[10]
- Ashley Mote (South East England) – Former UKIP MEP, expelled for expenses fraud for which he was later jailed.[11]
- Tom Wise (East of England) – Former UKIP MEP, expelled for expenses fraud for which he was later jailed.[12]
Opinion polls
In the run up to the election, several polling organisations carried out public opinion polling in regards to voting intentions in Great Britain. Results of such polls are displayed below.
ComRes, ICM, Populus and YouGov are members of the British Polling Council, and abide by its disclosure rules. BPIX is not a member of the BPC, and does not publish detailed methodology and findings.
| Date(s) conducted |
Polling organisation/client | Con | Lab | UKIP | Lib Dem | Green | BNP | Others | Lead |
|---|---|---|---|---|---|---|---|---|---|
| 4 June 2009 | EU Election, 2009 (GB Result) | 27.7% | 15.7% | 16.5% | 13.7% | 8.6% | 6.2% | 11.6% | 11.2% |
| 03/06/09 | YouGov/Daily Telegraph | 26% | 16% | 18% | 15% | 10% | 5% | 10% | 8% |
| 31/05/09 | ComRes/Green Party | 24% | 22% | 17% | 14% | 15% | 2% | 6% | 2% |
| 29/05/09 | YouGov/Daily Telegraph | 27% | 17% | 16% | 15% | 9% | 7% | 9% | 10% |
| 28/05/09 | ICM/Sunday Telegraph | 29% | 17% | 10% | 20% | 11% | 5% | 8% | 9% |
| 28/05/09 | Populus/Times | 30% | 16% | 19% | 12% | 10% | 5% | 8% | 11% |
| 21/05/09 | ICM/Guardian | 30% | 24% | 10% | 18% | 9% | 1% | 8% | 6% |
| 16/05/09 | YouGov/Daily Telegraph | 28% | 22% | 15% | 17% | 7% | 5% | 5% | 6% |
| 16/05/09 | BPIX/Mail on Sunday | 30% | 17% | 17% | 15% | N/A | 5% | 16% | 13% |
| 14/05/09 | ComRes/UKIP | 28% | 23% | 15% | 14% | 11% | 4% | 5% | 5% |
| 14/05/09 | YouGov/Sun | 29% | 20% | 15% | 19% | 6% | 3% | 6% | 9% |
| 10/05/09 | Populus/Times | 34% | 25% | 6% | 20% | 5% | 2% | 8% | 9% |
| 09/05/09 | BPIX/Mail on Sunday[13] | 36% | 23% | 10% | 16% | N/A | N/A | 15% | 13% |
| 08/05/09 | YouGov/Sunday Times | 36% | 25% | 7% | 20% | 4% | 4% | 7% | 11% |
| 04/05/09 | ICM/TPA | 32% | 28% | 9% | 22% | 1% | 1% | 7% | 4% |
| 08/01/09 | YouGov/TPA | 35% | 29% | 7% | 15% | 5% | 4% | 5% | 6% |
| 10 June 2004 | EU Election, 2004 (GB results only) | 26.7% | 22.6% | 16.1% | 14.9% | 6.3% | 4.9% | 8.5% | 4.1% |
Results
United Kingdom
| Party | Votes | Seats | |||||
|---|---|---|---|---|---|---|---|
| Number | % | +/- | Seats | +/-‡ | % | ||
| Conservative† | 4,281,286 | 27.4 | 26 | 36.1 | |||
| UKIP | 2,498,226 | 16.0 | 13 | 18.1 | |||
| Labour | 2,381,760 | 15.2 | 13 | 18.1 | |||
| Liberal Democrat | 2,080,613 | 13.3 | 11 | 15.3 | |||
| Green | 1,223,303 | 7.8 | 2 | 2.8 | |||
| BNP | 943,598 | 6.0 | 2 | 2.8 | |||
| SNP | 321,007 | 2.1 | 2 | 2.8 | |||
| English Democrat | 279,801 | 1.8 | 0 | ||||
| Christian/CPA1 | 249,493 | 1.6 | 0 | ||||
| Socialist Labour | 173,115 | 1.1 | New | 0 | |||
| NO2EU | 153,236 | 1.0 | New | 0 | |||
| Plaid Cymru | 126,702 | 0.8 | 1 | 1.4 | |||
| Sinn Féin | 126,184 | 0.8 | 1 | 1.4 | |||
| DUP | 88,346 | 0.6 | 1 | 1.4 | |||
| Scottish Green | 80,442 | 0.5 | 0 | ||||
| Jury Team | 78,569 | 0.5 | New | 0 | |||
| SDLP | 78,489 | 0.5 | 0 | ||||
| UK First | 74,007 | 0.5 | New | 0 | |||
| Libertas | 73,544 | 0.5 | New | 0 | |||
| TUV | 66,197 | 0.4 | New | 0 | |||
| Jan Jananayagam (Ind.) | 50,014 | 0.3 | New | 0 | |||
| Pensioners | 37,785 | 0.2 | 0 | ||||
| Alliance | 26,699 | 0.2 | New | 0 | |||
| Green (NI) | 15,764 | 0.1 | 0 | ||||
| Mebyon Kernow | 14,922 | 0.1 | New | 0 | |||
| Animals Count | 13,201 | 0.1 | New | 0 | |||
| Scottish Socialist | 10,404 | 0.1 | 0 | ||||
| Duncan Robertson (Ind.) | 10,189 | 0.1 | New | 0 | |||
| Peter Rigby (Ind.) | 9,916 | 0.1 | New | 0 | |||
| Peace | 9,534 | 0.1 | 0 | ||||
| Katie Hopkins (Ind.) | 8,971 | 0.1 | New | 0 | |||
| Fair Play Fair Trade Party | 7,151 | 0.0 | New | 0 | |||
| Roman Party | 5,450 | 0.0 | New | 0 | |||
| Steven Cheung (Ind.) | 4,918 | 0.0 | New | 0 | |||
| Socialist (GB) | 4,050 | 0.0 | New | 0 | |||
| Francis Apaloo (Ind.) | 3,621 | 0.0 | New | 0 | |||
| Yes 2 Europe | 3,384 | 0.0 | New | 0 | |||
| Sohale Rahman (Ind.) | 3,248 | 0.0 | New | 0 | |||
| Gene Alcantara (Ind.) | 1,972 | 0.0 | New | 0 | |||
| Haroon Saad (Ind.) | 1,603 | 0.0 | New | 0 | |||
| Wai D | 789 | 0.0 | New | 0 | |||
| Total | 15,621,503 | 72 | 100 | ||||
†Includes Ulster Conservatives and Unionists (82,892 votes, 1 MEP).
‡ As the number of seats was reduced, these are notional changes estimated by the BBC.
1Joint ticket, ran in England as: The Christian Party - Christian Peoples Alliance.
Great Britain
.svg.png)
Turnout In Great Britain was 34.3%, with 15,137,202 votes out of a total electorate of 44,171,778.[7] Most of the results of the election were announced on Sunday 7 June, after similar elections were held in the other 26 member states of the European Union. Scotland declared its result on Monday 8 June, as counting in the Western Isles was delayed due to observance of the Sabbath.
Great Britain kept to the European wide trend towards the right.[3] The Labour Party, which was in its twelfth year as government of the United Kingdom, suffered a significant drop in support polling third, and UKIP finishing second in a major election for the first time in its history, coming level with Labour in terms of seats but ahead of them in terms of votes. This was the first time in British electoral history that a party in government had been out polled in a national election by a party with no representation in the House of Commons.
The Conservatives won in every region in Great Britain except the North East, where Labour won, and Scotland, where the SNP won.[7] Labour suffered most notably in Cornwall, where it came sixth behind Mebyon Kernow, and in the wider South West region and South East where it polled fifth behind the Green Party.[14] The BNP won two seats, their first ever in a national election. The share of the vote achieved by the English Democrats doubled.[15]
The turnout in Scotland was the lowest in the United Kingdom at 28.8%, with 1,104,512 votes out of a total electorate of 3,872,975.[7] In Scotland it was the first time the SNP won the largest share of the European election vote.[16] The SNP share of the vote rose by 9.4% points compared to 2004, this was the biggest positive swing for any party in any region in Great Britain.[7]
In Wales it was the first time since 1918 that Labour had failed to come first in a Welsh election, dropping 12.2%. In Wales, the Conservative Party topped the poll with the nationalist Plaid Cymru coming a close third. UKIP took the fourth Welsh seat, the first time Wales had elected a UKIP MEP.[17] Both the Liberal Democrat and the Green Party polled their lowest regional shares in Wales, though Wales was the only region where the Liberal Democrat share of the vote rose compared with 2004.[7]
Summary of the election results for Great Britain[18]
| Party | Votes won | % of vote | % Plus/ Minus | Seats | Plus/Minus vs actual '04 result | Plus/Minus vs notional '04 result† | Seats % | |
|---|---|---|---|---|---|---|---|---|
| Conservative | 4,198,394 | 27.7% | 25 | 37.7 | ||||
| UKIP | 2,498,226 | 16.5% | 13 | 18.8 | ||||
| Labour | 2,381,760 | 15.7% | 13 | 18.8 | ||||
| Liberal Democrat | 2,080,613 | 13.7% | 11 | 15.9 | ||||
| Green | 1,223,303 | 8.1% | 2 | 2.9 | ||||
| BNP | 943,598 | 6.2% | 2 | 2.9 | ||||
| SNP | 321,007 | 2.1% | 2 | 2.9 | ||||
| English Democrat | 279,801 | 1.8% | 0 | 0 | ||||
| Christian/Christian Peoples Alliance1 | 249,493 | 1.6% | 0 | 0 | ||||
| Socialist Labour | 173,115 | 1.1% | New | 0 | 0 | |||
| NO2EU | 153,236 | 1.0% | New | 0 | 0 | |||
| Plaid Cymru | 126,702 | 0.8% | 1 | 1.4 | ||||
| Scottish Green | 80,442 | 0.5% | 0 | 0 | ||||
| Jury Team | 78,569 | 0.5% | New | 0 | 0 | |||
| UK First | 74,007 | 0.5% | New | 0 | 0 | |||
| Libertas | 73,544 | 0.5% | New | 0 | 0 | |||
| Jan Jananayagam (Independent) | 50,014 | 0.3% | New | 0 | 0 | |||
| Pensioners | 37,785 | 0.2% | 0 | 0 | ||||
| Mebyon Kernow | 14,922 | 0.1% | New | 0 | 0 | |||
| Animals Count | 13,201 | 0.1% | New | 0 | 0 | |||
| Scottish Socialist | 10,404 | 0.1% | 0 | 0 | ||||
| Duncan Robertson (Independent) | 10,189 | 0.1% | New | 0 | 0 | |||
| Peter Rigby (Independent) | 9,916 | 0.1% | New | 0 | 0 | |||
| Peace | 9,534 | 0.1% | 0 | 0 | ||||
| Katie Hopkins (Independent) | 8,971 | 0.1% | New | 0 | 0 | |||
| Fair Play Fair Trade Party | 7,151 | 0.0% | New | 0 | 0 | |||
| Roman Party | 5,450 | 0.0% | New | 0 | 0 | |||
| Steven Cheung (Independent) | 4,918 | 0.0% | New | 0 | 0 | |||
| Socialist (GB) | 4,050 | 0.0% | New | 0 | 0 | |||
| Francis Apaloo (Independent) | 3,621 | 0.0% | New | 0 | 0 | |||
| Yes 2 Europe | 3,384 | 0.0% | New | 0 | 0 | |||
| Sohale Rahman (Independent) | 3,248 | 0.0% | New | 0 | 0 | |||
| Gene Alcantara (Independent) | 1,972 | 0.0% | New | 0 | 0 | |||
| Haroon Saad (Independent) | 1,603 | 0.0% | New | 0 | 0 | |||
| Wai D | 789 | 0.0% | New | 0 | 0 | |||
| Total | 15,072,325 | 69 | 100 | |||||
†Seat change has been adjusted to allow for direct comparison with the results from the 2004 election
1Joint ticket, ran in England as: The Christian Party - Christian Peoples Alliance.
Gibraltar
Gibraltar is a British overseas territory (BOT) and therefore is under the jurisdiction and sovereignty of the United Kingdom but does not form part of it.[19] Gibraltar is however, part of the EU, the only BOT to be so, and participated as part of the South West England constituency.
Turnout was 35% in Gibraltar, below the 39% for the South West England electoral region as a whole and significantly lower than the turnout in Gibraltar in 2004.[20]
The Conservatives won with 53.3% of the votes. Labour narrowly retained second place achieving 19% to the Liberal Democrats' 18.2%.[20]
| Party | Votes won | Vote share (%) | Change (%) | |
|---|---|---|---|---|
| Conservative | 3,721 | 53.3 | ||
| Labour | 1,328 | 19.0 | ||
| Liberal Democrat | 1,269 | 18.2 | ||
| Green | 224 | 3.2 | ||
| UKIP | 100 | 1.4 | ||
| BNP | 94 | 1.4 | ||
| Christian | 70 | 1.0 | New | |
| Socialist Labour | 56 | 0.8 | New | |
| English Democrat | 37 | 0.5 | New | |
| Pensioners | 26 | 0.4 | New | |
| Independent - Katie Hopkins | 15 | 0.2 | New | |
| NO2EU | 12 | 0.2 | New | |
| Mebyon Kernow | 8 | 0.1 | New | |
| Fair Pay Fair Trade | 8 | 0.1 | New | |
| Jury Team | 6 | 0.1 | New | |
| Wai D Your Decision | 4 | 0.1 | New | |
| Libertas | 3 | 0.0 | New | |
Northern Ireland
.svg.png)
It was the DUP's worst ever European election result: the party had previously topped the poll in every European election in Northern Ireland since the first one in 1979.[6] It was also the first time an Irish Republican topped the poll with Bairbre de Brun of Sinn Féin coming first with 125,000 votes. The share of the votes for most parties in Northern Ireland remained essentially unchanged, the main exceptions were the DUP where their share of the vote fell by 13.8%, and the TUV, a party created by former DUP MEP Jim Allister whose share of the vote rose 13.7%.[7] The DUP's decreased vote share was largely blamed on the TUV splitting the vote.
Summary of the election results for Northern Ireland[21]
| Party | Candidate | Seats | Loss/Gain | First Preference Votes | |||
|---|---|---|---|---|---|---|---|
| Number | % of vote | ||||||
| Sinn Féin | Bairbre de Brún | 1 | 0 | 126,184 | 25.8 | ||
| DUP | Diane Dodds | 1 | 0 | 88,346 | 18.1 | ||
| UCU-NF | Jim Nicholson | 1 | 0 | 82,892 | 17.0 | ||
| SDLP | Alban Maginness | 0 | 0 | 78,489 | 16.1 | ||
| TUV | Jim Allister | 0 | 0 | 66,197 | 13.5 | ||
| Alliance | Ian Parsley | 0 | 0 | 26,699 | 5.5 | ||
| Green (NI) | Steven Agnew | 0 | 0 | 15,764 | 3.2 | ||
| Turnout[22] | 488,891 | 42.8 | |||||
Incumbents defeated
Labour
- Glyn Ford (South West England)
- Neena Gill (West Midlands)
- Richard Corbett (Yorkshire and the Humber)
Traditional Unionist Voice
- Jim Allister (Northern Ireland) – was elected in the 2004 election as a candidate for the DUP; subsequently in 2007 Allister resigned from the DUP and formed the TUV.[23] In the 2009 election, Diane Dodds retook the seat for the DUP.
Aftermath
Gordon Brown faced calls for him to resign as Prime Minister after Labour's defeat.[14]
During the 2005 Conservative Party leadership election David Cameron argued for withdrawal of the Conservatives from EPP-ED and the formation of a new group. After the European election it was announced that the Conservatives were leaving the EPP-ED and forming a new group the European Conservatives and Reformists.[24] On 22 June 2009, the first official list of the new group's members was released.[25] On 24 June, the group held its inaugural meeting, in which Conservative MEP Timothy Kirkhope was named interim leader.[26] The first election for the group leadership was also scheduled for 14 July, pitting interim leader Kirkhope against fellow Briton Geoffrey Van Orden.[27] However, both Conservative leadership candidates were forced to forfeit the leadership in order to prevent it from falling apart, when then-Conservative MEP Edward McMillan-Scott defied his party whip and stood for one of the vice-presidency posts despite pledges the previous week that Polish MEP Michal Kaminski would be backed for it. Kaminski's bid for Vice-President of the European Parliament subsequently failed, and the Poles threatened to abandon the new caucus unless Kaminski was made the group leader in the parliament.[28]
Similarly, UKIP helped found a new European Parliament Group: Europe of Freedom and Democracy after the other parties in UKIP's pre-election European parliamentary grouping, Independence/Democracy had polled badly.[29]
Summary of the post-election European Parliament Groupings of each party
See also
- European Parliament election, 2009
- Members of the European Parliament for the United Kingdom 2009–2014 (alphabetic order)
- Treaty of Lisbon
- United Kingdom local elections, 2009
- United Kingdom general election, 2010
- Opinion polling for the United Kingdom general election, 2010
- List of political parties in the United Kingdom
References
- ↑ "Turnout at the European elections (1979-2009)". European Parliament. Retrieved 22 May 2014.
- ↑ "European Election: United Kingdom Result". BBC News. Retrieved 22 May 2014.
- 1 2 "Voters steer Europe to the right". BBC News. 8 June 2009. Retrieved 23 May 2014.
- ↑ "Salmond hails 'historic' Euro win". BBC News. 8 June 2009. Retrieved 2009-06-09.
- ↑ "Tories top European poll in Wales". BBC News. 8 June 2009. Retrieved 2009-06-09.
- 1 2 "DUP's worst ever Euro poll result". BBC News. 8 June 2009. Retrieved 2009-06-09.
- 1 2 3 4 5 6 7 Research Paper 09/53 European Parliament elections 2009, House of Commons Library, 17 June 2009
- ↑ "The European Parliament (Number of MEPs and Distribution between Electoral Regions) (United Kingdom and Gibraltar) Order 2008 No. 1954". Opsi.gov.uk. Retrieved 19 May 2009.
- ↑ "Distribution between electoral regions of UK MEPs (PDF)" (PDF).
- ↑ "Kilroy-Silk to leave European Parliament" Archived 10 May 2009 at the Wayback Machine., This Is Nottingham
- ↑ Staff reporter (9 May 2009). "Euro MP to stand down". The News. Archived from the original on 14 May 2009. Retrieved 2009-05-19.
MEP Ashley Mote is giving up his South East seat, but says he will continue to fight against the European Union.
(Archived by WebCite at ) - ↑ Lewis, Alex (22 April 2009). "MEP facing criminal charges will not stand again". Watford Observer. Retrieved 2009-11-20.
- 1 2 "European Elections polling data". UK Polling Report. Retrieved 23 May 2014.
- 1 2 "David Cameron renews general election call after Labour's European flop". the Guardian. 8 June 2009. Retrieved 23 May 2014.
- ↑ "English Democrats votes doubled". BBC News. 8 June 2009. Retrieved 22 May 2014.
- ↑ "Salmond hails 'historic' Euro win". BBC News. 8 June 2009. Retrieved 9 June 2009.
- ↑ "Tories top European poll in Wales". BBC News. 8 June 2009. Retrieved 9 June 2009.
- ↑ "European Election: United Kingdom Result". BBC News. Retrieved 22 May 2014.
- ↑ The 14 Territories
- 1 2 Reyes, Brian (8 June 2009). "Landslide for Tories, Disappointment for Labour". Gibraltar Chronicle. Archived from the original on 10 June 2009. Retrieved 2009-06-08. Reyes, Brian (2009-06-08). "Landslide for Tories, Disappointment for Labour". Gibraltar Chronicle. Archived from the original on 8 June 2009. Retrieved 2009-06-08. (Archived by WebCite at )
- ↑ "European election 2009". BBC News. 8 June 2009. Retrieved 24 May 2014.
- ↑ "Electoral Office for Northern Ireland – Turnout" (PDF). Archived from the original (PDF) on 21 July 2011.
- ↑ "New unionist group to be launched". BBC News. 2007-12-07. Retrieved 2010-06-17.
- ↑ Charter, David (2009-05-15). "David Cameron's new European allies set to include odd bedfellows". London: The Times. Retrieved 2009-05-15.
- ↑ "Conservative MEPs form new group". BBC. 2009-06-22. Retrieved 2009-06-22.
- ↑ Banks, Martin (25 March 2009). "Tory MEP voices 'real concern' over new European grouping". London: Daily Telegraph. Retrieved 2009-07-22.
- ↑ Banks, Martin (9 July 2009). "British Tories fight it out for leadership of new Eurosceptic group". Theparliament.com. Archived from the original on 24 July 2009. Retrieved 10 July 2009.
- ↑ Ian Traynor in Strasbourg (2009-07-15). "Tories give up EU parliamentary leadership of Eurosceptic group | Politics". London: guardian.co.uk. Retrieved 2010-04-27.
- ↑ Phillips, Leigh (30 June 2009). "Ukip, Lega Nord form hard-right bloc in EU Parliament". EU Observer. Retrieved 16 June 2012.
External links
| General elections |
|
|---|---|
| Local elections |
|
| European elections | |
| Referendums | |