Shipley (UK Parliament constituency)
| Shipley | |
|---|---|
|
County constituency for the House of Commons | |
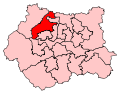 Boundary of Shipley in West Yorkshire. | |
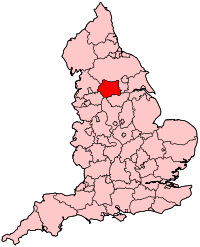 Location of West Yorkshire within England. | |
| County | West Yorkshire |
| Electorate | 68,129 (December 2010)[1] |
| Major settlements | Shipley, Bingley, Baildon |
| Current constituency | |
| Created | 1885 |
| Member of parliament | Philip Davies (Conservative) |
| Number of members | One |
| Created from | Northern West Riding of Yorkshire |
| Overlaps | |
| European Parliament constituency | Yorkshire and the Humber |
Shipley is a constituency[n 1] represented in the House of Commons of the UK Parliament since 2005 by Philip Davies, a Conservative.[n 2]
Boundaries
1885-1918: The Municipal Borough of Bradford, and the civil parishes of Clayton, Eccleshill, Idle, North Brierley, and Shipley.
1918-1950: The Urban Districts of Baildon, Bingley, Guiseley, Shipley, and Yeadon, and in the Rural District of Wharfedale the civil parishes of Esholt, Hawksworth, and Menston.
1950-1983: The Urban Districts of Baildon, Bingley, and Shipley.
1983-2010: The District of Bradford wards of Baildon, Bingley, Bingley Rural, Rombalds, Shipley East, and Shipley West.
2010-present: The District of Bradford wards of Baildon, Bingley, Bingley Rural, Shipley, Wharfedale, and Windhill and Wrose.
History
1885–1970
This seat was created in the Redistribution of Seats Act 1885. Until 1923 the seat was almost exclusively represented by elected Liberals and Arthur Creech Jones was Secretary of State for the Colonies (1946–1950) during most of the Attlee Ministry.
MPs since 1970
Shipley was for a long time the seat of ex-Chairman of the Conservative 1922 Committee, Sir Marcus Fox. He held the seat for almost 30 years between the 1970 and 1997 general elections.
At the 1997 general election, the Labour candidate Chris Leslie gained the seat from Fox, becoming the youngest MP of that parliament. He held the seat at the 2001 election and became a junior minister. A number of traditional Labour supporters considered Leslie to be an ardent Blairite, though he was in fact equally close to Gordon Brown, one of whose staff he married, and whose campaign for election as Labour leader he helped run.[2]
Leslie narrowly lost the seat in the 2005 election, when the Conservative Party candidate Philip Davies narrowly regained the seat with a majority of 422 votes, which then increased to nearly ten thousand votes at the May 2010 general election.
Members of Parliament

Elections
- In December 2017 the Labour Party announced that its candidate for the next United Kingdom general election would be academic Jo Pike.[4][5]
Elections in the 2010s
| Party | Candidate | Votes | % | ± | |
|---|---|---|---|---|---|
| Conservative | Philip Davies | 27,417 | 51.3 | +1.3 | |
| Labour | Steve Clapcote | 22,736 | 42.6 | +11.6 | |
| Liberal Democrat | Caroline Jones | 2,202 | 4.1 | +0.3 | |
| Women's Equality | Sophie Walker | 1,040 | 1.9 | N/A | |
| Majority | 4,681 | 8.8 | -10.2 | ||
| Turnout | 53,395 | 73.0 | +5.7 | ||
| Conservative hold | Swing | ||||
| Party | Candidate | Votes | % | ± | |
|---|---|---|---|---|---|
| Conservative | Philip Davies | 25,269 | 50.0 | +1.4 | |
| Labour | Steve Clapcote | 15,645 | 31.0 | +2.5 | |
| UKIP | Waqas Khan | 4,479 | 8.9 | N/A | |
| Green | Kevin Warnes | 2,657 | 5.3 | +2.3 | |
| Liberal Democrat | Andrew Martin | 1,949 | 3.9 | -16.2 | |
| Yorkshire Party | Darren Hill | 543 | 1.1 | N/A | |
| Majority | 9,624 | 19.0 | |||
| Turnout | 50,542 | 71.7 | |||
| Conservative hold | Swing | -0.5 | |||
| Party | Candidate | Votes | % | ± | |
|---|---|---|---|---|---|
| Conservative | Philip Davies | 24,002 | 48.6 | +9.7 | |
| Labour | Susan Hinchcliffe | 14,058 | 28.4 | -9.4 | |
| Liberal Democrat | John Harris | 9,890 | 20.0 | +4.8 | |
| Green | Kevin Warnes | 1,477 | 3.0 | -0.4 | |
| Majority | 9,944 | 20.1 | |||
| Turnout | 49,427 | 73.0 | +4.9 | ||
| Conservative hold | Swing | +9.6 | |||
Elections in the 2000s

| Party | Candidate | Votes | % | ± | |
|---|---|---|---|---|---|
| Conservative | Philip Davies | 18,608 | 39.0 | −1.9 | |
| Labour | Chris Leslie | 18,186 | 38.2 | −5.8 | |
| Liberal Democrat | John Briggs | 7,018 | 14.7 | +3.8 | |
| BNP | Tom Linden | 2,000 | 4.2 | N/A | |
| Green | Quentin Deakin | 1,665 | 3.5 | +0.5 | |
| Iraq War. Not In My Name | David Crabtree | 189 | 0.4 | N/A | |
| Majority | 422 | 0.9 | |||
| Turnout | 47,666 | 69.7 | +3.5 | ||
| Conservative gain from Labour | Swing | 2.0 | |||
| Party | Candidate | Votes | % | ± | |
|---|---|---|---|---|---|
| Labour | Chris Leslie | 20,243 | 44.0 | +0.6 | |
| Conservative | David Senior | 18,815 | 40.9 | +3.1 | |
| Liberal Democrat | Helen Wright | 4,996 | 10.9 | −4.2 | |
| Green | Martin Love | 1,386 | 3.0 | N/A | |
| UKIP | Walter Whitaker | 580 | 1.3 | N/A | |
| Majority | 1,428 | 3.1 | |||
| Turnout | 46,020 | 66.2 | -10.2 | ||
| Labour hold | Swing | ||||
Elections in the 1990s
| Party | Candidate | Votes | % | ± | |
|---|---|---|---|---|---|
| Labour | Chris Leslie | 22,962 | 43.3 | +14.8 | |
| Conservative | Marcus Fox | 19,996 | 37.8 | -12.6 | |
| Liberal Democrat | John Cole | 7,984 | 15.1 | -4.9 | |
| Referendum | Stephen Ellams | 1,960 | 3.7 | N/A | |
| Majority | 2,966 | 4.3 | |||
| Turnout | 52,902 | 76.3 | -5.8 | ||
| Labour gain from Conservative | Swing | +13.8 | |||
| Party | Candidate | Votes | % | ± | |
|---|---|---|---|---|---|
| Conservative | Marcus Fox | 28,463 | 50.4 | +0.9 | |
| Labour | Annie Lockwood | 16,081 | 28.5 | +5.2 | |
| Liberal Democrat | John Cole | 11,288 | 20.0 | -6.3 | |
| Green | Colin Harris | 680 | 1.2 | +0.3 | |
| Majority | 12,382 | 21.9 | -0.3 | ||
| Turnout | 56,512 | 82.1 | +2.9 | ||
| Conservative hold | Swing | -2.2 | |||
Elections in the 1980s
| Party | Candidate | Votes | % | ± | |
|---|---|---|---|---|---|
| Conservative | Marcus Fox | 26,941 | 49.5 | −0.2 | |
| Liberal | William Wallace | 14,311 | 26.3 | −1.4 | |
| Labour | Christopher Butler | 12,699 | 23.3 | +1.7 | |
| Green | Colin Harris | 507 | 0.9 | −0.1 | |
| Majority | 12,630 | 23.2 | +1.2 | ||
| Turnout | 54,428 | 79.2 | +2.2 | ||
| Conservative hold | Swing | +0.6 | |||
| Party | Candidate | Votes | % | ± | |
|---|---|---|---|---|---|
| Conservative | Marcus Fox | 25,866 | 49.7 | −2.8 | |
| Liberal | William Wallace | 14,421 | 27.7 | +14.5 | |
| Labour | Martin Leathley | 11,218 | 21.6 | −11.6 | |
| Ecology | Stanley Shepherd | 521 | 1.0 | −0.1 | |
| Majority | 11,445 | 22.0 | +2.7 | ||
| Turnout | 52,026 | 77.0 | −3.5 | ||
| Conservative hold | Swing | ||||
Elections in the 1970s
| Party | Candidate | Votes | % | ± | |
|---|---|---|---|---|---|
| Conservative | Marcus Fox | 22,641 | 52.5 | +8.5 | |
| Labour | P R Ward | 14,281 | 33.2 | -3.6 | |
| Liberal | G G Roberts | 5,673 | 13.2 | -6.0 | |
| Ecology | D R Pedley | 486 | 1.1 | N/A | |
| Majority | 8,360 | 19.3 | +12.1 | ||
| Turnout | 43,081 | 80.5 | -0.5 | ||
| Conservative hold | Swing | ||||
| Party | Candidate | Votes | % | ± | |
|---|---|---|---|---|---|
| Conservative | Marcus Fox | 18,518 | 44.0 | +0.9 | |
| Labour | M J Wedgeworth | 15,482 | 36.8 | +2.9 | |
| Liberal | G G Roberts | 8,094 | 19.2 | -3.4 | |
| Majority | 3,036 | 7.2 | -2.0 | ||
| Turnout | 42,094 | 81.0 | +6.4 | ||
| Conservative hold | Swing | ||||
| Party | Candidate | Votes | % | ± | |
|---|---|---|---|---|---|
| Conservative | Marcus Fox | 19,439 | 43.1 | ||
| Labour | M J Wedgeworth | 15,284 | 33.9 | ||
| Liberal | G G Roberts | 10,158 | 22.6 | ||
| Independent Democratic Alliance | C G Campion | 192 | 0.4 | ||
| Majority | 4,155 | 9.2 | |||
| Turnout | 45,073 | 87.4 | |||
| Conservative hold | Swing | ||||
| Party | Candidate | Votes | % | ± | |
|---|---|---|---|---|---|
| Conservative | Marcus Fox | 20,938 | 50.37 | ||
| Labour | Norman Free | 16,161 | 38.88 | ||
| Liberal | A.M. Micklem | 4,468 | 10.75 | ||
| Majority | 4,777 | 11.49 | |||
| Turnout | 82.42 | ||||
| Conservative hold | Swing | ||||
Elections in the 1960s
| Party | Candidate | Votes | % | ± | |
|---|---|---|---|---|---|
| Conservative | Geoffrey Hirst | 18,466 | 46.47 | ||
| Labour | John Collins | 16,966 | 42.70 | ||
| Liberal | James P Heppell | 4,304 | 10.83 | ||
| Majority | 1,500 | 3.77 | |||
| Turnout | 86.58 | ||||
| Conservative hold | Swing | ||||
| Party | Candidate | Votes | % | ± | |
|---|---|---|---|---|---|
| Conservative | Geoffrey Hirst | 19,076 | 57.95 | ||
| Labour | Christopher Price | 15,545 | 39.07 | ||
| Liberal | James P Heppell | 5,165 | 12.98 | ||
| Majority | 3,531 | 8.87 | |||
| Turnout | 86.67 | ||||
| Conservative hold | Swing | ||||
Elections in the 1950s
| Party | Candidate | Votes | % | ± | |
|---|---|---|---|---|---|
| Conservative | Geoffrey Hirst | 22,536 | 56.97 | ||
| Labour | Michael English | 17,025 | 43.03 | ||
| Majority | 5,511 | 13.93 | |||
| Turnout | 87.02 | ||||
| Conservative hold | Swing | ||||
| Party | Candidate | Votes | % | ± | |
|---|---|---|---|---|---|
| Conservative | Geoffrey Hirst | 22,582 | 56.69 | ||
| Labour | Ernest Gardner | 17,251 | 43.31 | ||
| Majority | 5,331 | 13.38 | |||
| Turnout | 86.21 | ||||
| Conservative hold | Swing | ||||
| Party | Candidate | Votes | % | ± | |
|---|---|---|---|---|---|
| Conservative | Geoffrey Hirst | 20,396 | 47.78 | ||
| Labour | Thomas J Roberts | 18,893 | 44.26 | ||
| Liberal | Stanley Berwin | 3,399 | 7.96 | ||
| Majority | 1,503 | 3.52 | |||
| Turnout | 90.48 | ||||
| Conservative hold | Swing | ||||
| Party | Candidate | Votes | % | ± | |
|---|---|---|---|---|---|
| Conservative | Geoffrey Hirst | 18,390 | 43.83 | ||
| Labour | Arthur Creech Jones | 18,309 | 43.64 | ||
| Liberal | W.A. Lupton | 5,021 | 11.97 | ||
| Communist | L.T. Robb | 237 | 0.56 | ||
| Majority | 81 | 0.19 | |||
| Turnout | 89.31 | ||||
| Conservative gain from Labour | Swing | ||||
Election in the 1940s
| Party | Candidate | Votes | % | ± | |
|---|---|---|---|---|---|
| Labour | Arthur Creech Jones | 25,027 | 50.11 | ||
| Conservative | Harry Hylton-Foster | 17,097 | 34.23 | ||
| Liberal | Eric Robinson | 7,820 | 15.66 | ||
| Majority | 7,930 | 15.88 | |||
| Turnout | 80.39 | ||||
| Labour hold | Swing | ||||
Elections in the 1930s
| Party | Candidate | Votes | % | ± | |
|---|---|---|---|---|---|
| Labour | Arthur Creech Jones | 16,102 | 36.0 | ||
| Liberal | Percy Guy Illingworth | 11,595 | 25.9 | ||
| Conservative | Thomas Howarth | 10,998 | 24.6 | ||
| Ind. Conservative | James Lockwood | 6,025 | 13.5 | ||
| Majority | 4,507 | 10.1 | |||
| Turnout | 77.5 | ||||
| Labour gain from Conservative | Swing | ||||
| Party | Candidate | Votes | % | ± | |
|---|---|---|---|---|---|
| Conservative | James Lockwood | 27,304 | 64.0 | ||
| Labour | William Albert Robinson | 14,725 | 34.5 | ||
| New Party | W.J. Leaper | 601 | 1.4 | ||
| Majority | 12,579 | 29.5 | |||
| Turnout | 79.7 | ||||
| Conservative hold | Swing | ||||
| Party | Candidate | Votes | % | ± | |
|---|---|---|---|---|---|
| Conservative | James Lockwood | 15,238 | 36.0 | +4.9 | |
| Labour | William Albert Robinson | 13,537 | 32.1 | ||
| Liberal | Arthur Davy | 12,785 | 30.2 | ||
| Communist | Willie Gallacher | 701 | 1.7 | ||
| Majority | 1,665 | 3.9 | |||
| Turnout | 80.0 | ||||
| Conservative gain from Labour | Swing | ||||
Elections in the 1920s
| Party | Candidate | Votes | % | ± | |
|---|---|---|---|---|---|
| Labour | William Mackinder | 18,654 | 42.3 | +6.3 | |
| Unionist | Robert Clough | 13,693 | 31.1 | -3.1 | |
| Liberal | Francis Wrigley Hirst | 11,712 | 26.6 | -3.2 | |
| Majority | 4,961 | 11.2 | +9.4 | ||
| Turnout | 85.0 | -1.4 | |||
| Labour hold | Swing | +4.7 | |||
| Party | Candidate | Votes | % | ± | |
|---|---|---|---|---|---|
| Labour | William Mackinder | 11,862 | 36.0 | -2.4 | |
| Unionist | Thomas Plumer | 11,266 | 34.2 | +5.6 | |
| Liberal | John Pybus | 9,800 | 29.8 | -3.2 | |
| Majority | 596 | 1.8 | -3.6 | ||
| Turnout | 86.4 | +3.7 | |||
| Labour hold | Swing | -4.0 | |||
| Party | Candidate | Votes | % | ± | |
|---|---|---|---|---|---|
| Labour | William Mackinder | 11,918 | 38.4 | +1.2 | |
| Liberal | John Pybus | 10,262 | 33.0 | +20.8 | |
| Unionist | Richard Garnett | 8,872 | 28.6 | n/a | |
| Majority | 1,656 | 5.4 | 8.8 | ||
| Turnout | 82.7 | +1.0 | |||
| Labour gain from National Liberal | Swing | n/a | |||
| Party | Candidate | Votes | % | ± | |
|---|---|---|---|---|---|
| National Liberal | Norman Rae | 12,201 | 40.6 | -34.0 | |
| Labour | William Mackinder | 11,160 | 37.2 | +11.8 | |
| Liberal | Arthur Davy | 6,674 | 12.2 | n/a | |
| Majority | 3.4 | ||||
| Turnout | 81.7 | +18.7 | |||
| National Liberal hold | Swing | ||||
Elections in the 1910s
| Party | Candidate | Votes | % | ± | |
|---|---|---|---|---|---|
| C | Liberal | Norman Rae | 16,700 | 74.6 | n/a |
| Labour | Tom Snowden | 5,690 | 25.4 | n/a | |
| Majority | 11,010 | 49.2 | n/a | ||
| Turnout | 63.0 | n/a | |||
| Liberal hold | Swing | n/a | |||
| C indicates candidate endorsed by the coalition government. | |||||
| Party | Candidate | Votes | % | ± | |
|---|---|---|---|---|---|
| Liberal | Oswald Partington | Unopposed | |||
| Liberal hold | |||||

| Party | Candidate | Votes | % | ± | |
|---|---|---|---|---|---|
| Liberal | Percy Illingworth | Unopposed | |||
| Liberal hold | |||||
| Party | Candidate | Votes | % | ± | |
|---|---|---|---|---|---|
| Liberal | Percy Illingworth | Unopposed | |||
| Liberal hold | |||||
| Party | Candidate | Votes | % | ± | |
|---|---|---|---|---|---|
| Liberal | Percy Illingworth | 9,144 | 63.0 | ||
| Liberal Unionist | William Hewins | 5,369 | 37.0 | ||
| Majority | 3,775 | 26.0 | |||
| Turnout | 12,507 | 88.9 | |||
| Liberal hold | Swing | ||||
Elections in the 1900s
| Party | Candidate | Votes | % | ± | |
|---|---|---|---|---|---|
| Liberal | Percy Illingworth | Unopposed | |||
| Liberal hold | |||||

| Party | Candidate | Votes | % | ± | |
|---|---|---|---|---|---|
| Liberal Unionist | James Fortescue Flannery | 6,284 | 50.2 | -0.1 | |
| Liberal | Percy Illingworth | 6,223 | 49.8 | +0.1 | |
| Majority | 61 | 0.4 | -0.2 | ||
| Turnout | 12,507 | 83.4 | +0.4 | ||
| Registered electors | 14,990 | ||||
| Liberal Unionist hold | Swing | -0.1 | |||
Elections in the 1890s
| Party | Candidate | Votes | % | ± | |
|---|---|---|---|---|---|
| Liberal Unionist | James Fortescue Flannery | 5,999 | 50.3 | +1.6 | |
| Lib-Lab | William Pollard Byles | 5,921 | 49.7 | -1.6 | |
| Majority | 78 | 0.6 | N/A | ||
| Turnout | 11,920 | 83.0 | +7.0 | ||
| Registered electors | 14,353 | ||||
| Liberal Unionist gain from Lib-Lab | Swing | +1.6 | |||
| Party | Candidate | Votes | % | ± | |
|---|---|---|---|---|---|
| Lib-Lab | William Pollard Byles | 5,746 | 51.3 | N/A | |
| Liberal Unionist | Theophilus Peel | 5,464 | 48.7 | N/A | |
| Majority | 282 | 2.6 | N/A | ||
| Turnout | 11,210 | 76.0 | N/A | ||
| Registered electors | 14,759 | ||||
| Lib-Lab hold | Swing | N/A | |||
Elections in the 1880s
| Party | Candidate | Votes | % | ± | |
|---|---|---|---|---|---|
| Liberal | Joseph Craven | Unopposed | |||
| Liberal hold | |||||
| Party | Candidate | Votes | % | ± | |
|---|---|---|---|---|---|
| Liberal | Joseph Craven | 7,022 | 59.3 | N/A | |
| Conservative | Laurence Hardy | 4,825 | 40.7 | N/A | |
| Majority | 2,197 | 18.6 | N/A | ||
| Turnout | 11,847 | 84.2 | N/A | ||
| Registered electors | 14,067 | ||||
| Liberal win (new seat) | |||||
See also
Notes and references
- Notes
- ↑ A county constituency (for the purposes of election expenses and type of returning officer)
- ↑ As with all constituencies, the constituency elects one Member of Parliament (MP) by the first past the post system of election at least every five years.
- References
- ↑ "Electorate Figures - Boundary Commission for England". 2011 Electorate Figures. Boundary Commission for England. 4 March 2011. Archived from the original on 6 November 2010. Retrieved 13 March 2011.
- ↑ Chris Leslie: Statement in full BBC News, 29 November 2007
- ↑ Leigh Rayment's Historical List of MPs – Constituencies beginning with "S" (part 3)
- ↑ Young, Chris (10 December 2017). "Labour choose lecturer Jo Pike to try and unseat Shipley MP Philip Davies at next General Election". Telegraph and Argus. Bradford, West Yorkshire. Retrieved 14 December 2017.
- ↑ Shand, Alistair (11 December 2017). "Labour reveals Shipley constituency candidate for next election". Keighley News. Retrieved 14 December 2017.
- ↑ "Election Data 2015". Electoral Calculus. Archived from the original on 17 October 2015. Retrieved 17 October 2015.
- ↑ "Shipley". BBC News. Retrieved 13 May 2015.
- ↑ "Election Data 2010". Electoral Calculus. Archived from the original on 26 July 2013. Retrieved 17 October 2015.
- ↑ "UK > England > Yorkshire & the Humber > Shipley". Election 2010. BBC News. 7 May 2010. Retrieved 12 May 2010.
- ↑ "Election Data 2005". Electoral Calculus. Archived from the original on 15 October 2011. Retrieved 18 October 2015.
- ↑ "Election Data 2001". Electoral Calculus. Archived from the original on 15 October 2011. Retrieved 18 October 2015.
- ↑ "Election Data 1997". Electoral Calculus. Archived from the original on 15 October 2011. Retrieved 18 October 2015.
- ↑ "Election Data 1992". Electoral Calculus. Archived from the original on 15 October 2011. Retrieved 18 October 2015.
- ↑ "UK General Election results April 1992". Election 1992. Political Science Resources. 9 April 1992. Retrieved 6 December 2010.
- ↑ "Election Data 1987". Electoral Calculus. Archived from the original on 15 October 2011. Retrieved 18 October 2015.
- ↑ "Election Data 1983". Electoral Calculus. Archived from the original on 15 October 2011. Retrieved 18 October 2015.
- 1 2 3 Craig, F. W. S. (1983). British parliamentary election results 1918-1949 (3 ed.). Chichester: Parliamentary Research Services. ISBN 0-900178-06-X.
- 1 2 British parliamentary election results, 1918-1949, Craig
- 1 2 3 4 5 6 Craig, FWS, ed. (1974). British Parliamentary Election Results: 1885-1918. London: Macmillan Press. ISBN 9781349022984.
Sources
- Political Science Resources Richard Kimber
- F. W. S. Craig, British Parliamentary Election Results 1885 - 1918
- F. W. S. Craig, British Parliamentary Election Results 1974 - 1979