Edinburgh South (UK Parliament constituency)
| Edinburgh South | |
|---|---|
|
Burgh constituency for the House of Commons | |
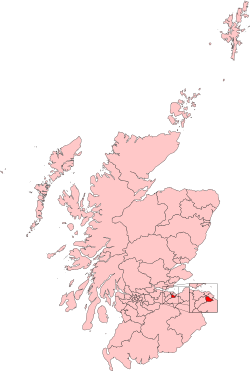 Boundary of Edinburgh South in Scotland. | |
| Subdivisions of Scotland | City of Edinburgh |
| Current constituency | |
| Created | 1885 |
| Member of parliament | Ian Murray (Labour) |
| Created from | Edinburgh |
| Overlaps | |
| European Parliament constituency | Scotland |
Edinburgh South is a constituency of the House of Commons of the UK Parliament created in 1885. The constituency has been represented by the Labour Party's Ian Murray since 2010.[1] Murray was the only Labour MP in Scotland to retain his seat at the 2015 general election, and did so with an increased majority, where he result rendered it the 23rd-most marginal Labour seat by percentage of majority nationwide.
Prior to the 2005 general election, the constituency had the same boundaries as the Scottish Parliament constituency with the same name.[n 1]
History
- Summary of results
A candidate fielded by the Labour Party has won the seat since 1987. Prior to that the political division for Westminster purposes voted for the Conservative and Unionist candidate, ahead of all other candidates by single preference, at each Westminster election from and including 1918. Prior to that the electorates' single-most preferred candidate in simple voting was that of the Liberal Party, except in 1900 when a Liberal Unionist was returned. The 2015 result gave the seat the 23rd-smallest majority of Labour's 232 seats by percentage of majority.[2]
- Recent opposition candidates' performance
At the 2015 General Election three of the seven parties' candidates standing retained their deposits, their votes exceeding 5%. Those doing so and not winning were SNP — 33.8% of the vote and Conservative — 17.5% of the vote.
The Liberal Democrat candidate of 2005 fell within 0.9% of a winning majority. The Liberal Democrats' swing nationally was -15.2% swing in 2015. The swing in this seat against the party was however -30.3% resulting in the loss of their deposit[n 2], a fate not sustained by either of the party's two formative parties in the seat since 1970.
- Turnout
Turnout has ranged between 81.1% in 1950 and 57.7% in 2001.
Boundaries
When created in 1885, the Westminster constituency was partly a replacement for the Edinburgh constituency. The Redistribution of Seats Act 1885 provided that the constituency was to consist of the Municipal Wards of St. George, St. Cuthbert, and Newington.[3]
In 1918 the constituency consisted of the "Merchiston, Morningside, and Newington Municipal Wards of Edinburgh."
In 2005, prior to the general election, Edinburgh South was one of six covering the City of Edinburgh council area. Five were entirely within the city council area. One, Edinburgh East and Musselburgh, straddled the boundary with the East Lothian council area, to take in Musselburgh.
For the 2005 election, the constituency was enlarged to enclude areas from the former Edinburgh Pentlands constituency, and became one of five constituencies covering the city area, all entirely within that area.[4]
The constituency covers a southern portion of the city area, and is predominantly suburban. In terms of wards used in elections to the City of Edinburgh Council 1999 to 2007, it includes the wards of Alnwickhill, Fairmilehead, Gilmerton, Kaimes, Marchmont, Merchiston, Moredun, Little France, Newington, North Morningside and the Grange, Sciennes, and South Morningside.
These wards were replaced with new wards in 2007, as a result of the Local Governance (Scotland) Act 2004. The constituency therefore contains almost no electoral wards in its entirety. Those within its boundaries are Southside/Newington, Meadows/Morningside, a handful of streets from the extreme north-east of Fountainbridge/Craiglockhart ward, Colinton/Fairmilehead, and Liberton/Gilmerton.
Members of Parliament
Election results
Elections in the 2010s
2017 general election
At the 2017 snap general election, Edinburgh South became the safest seat in Scotland with a majority of 15,514 votes (32.4%).
| Party | Candidate | Votes | % | ± | |
|---|---|---|---|---|---|
| Labour | Ian Murray | 26,269 | 54.9 | +15.8 | |
| SNP | Jim Eadie | 10,755 | 22.5 | -11.3 | |
| Conservative | Stephanie Smith | 9,428 | 19.7 | +2.2 | |
| Liberal Democrats | Alan Beal | 1,388 | 2.9 | -0.8 | |
| Majority | 15,514 | 32.4 | +27.0 | ||
| Turnout | 47,840 | 74.1 | -0.8 | ||
| Labour hold | Swing | +13.6 | |||
2015 general election
At the 2015 general election, Edinburgh South was the only constituency in Scotland to return a Labour MP to Parliament.
| Party | Candidate | Votes | % | ± | |
|---|---|---|---|---|---|
| Labour | Ian Murray | 19,293 | 39.1 | +4.4 | |
| SNP | Neil Hay | 16,656 | 33.8 | +26.1 | |
| Conservative | Miles Briggs | 8,626 | 17.5 | -4.1 | |
| Scottish Green | Phyl Meyer | 2,090 | 4.2 | +2.2 | |
| Liberal Democrats | Pramod Subbaraman | 1,823 | 3.7 | -30.3 | |
| UKIP | Paul Marshall | 601 | 1.2 | n/a | |
| Scottish Socialist | Colin Fox | 197 | 0.4 | n/a | |
| Majority | 2,637 | 5.4 | +4.7 | ||
| Turnout | 49,286 | 74.9 | +1.1 | ||
| Labour hold | Swing | -10.9 | |||
2010 general election
| Party | Candidate | Votes | % | ± | |
|---|---|---|---|---|---|
| Labour | Ian Murray | 15,215 | 34.7 | +1.5 | |
| Liberal Democrats | Fred Mackintosh | 14,899 | 34.0 | +1.7 | |
| Conservative | Neil Hudson | 9,452 | 21.6 | -2.5 | |
| SNP | Sandy Howat | 3,354 | 7.7 | +1.5 | |
| Scottish Green | Steve Burgess | 881 | 2.0 | -1.2 | |
| Majority | 316 | 0.7% | |||
| Turnout | 43,801 | 73.8 | +4.4 | ||
| Labour hold | Swing | -0.1 | |||
Elections in the 2000s
| Party | Candidate | Votes | % | ± | |
|---|---|---|---|---|---|
| Labour | Nigel Griffiths | 14,188 | 33.2 | -6.1 | |
| Liberal Democrats | Marilyne MacLaren | 13,783 | 32.3 | +7.0 | |
| Conservative | Gavin Brown | 10,291 | 24.1 | +1.4 | |
| SNP | Graham Sutherland | 2,635 | 6.2 | -3.1 | |
| Scottish Green | Steve Burgess | 1,387 | 3.2 | N/A | |
| Scottish Socialist | Morag Robertson | 414 | 1.0 | -1.2 | |
| Majority | 405 | 0.9% | -13.9 | ||
| Turnout | 42,698 | 69.9 | +9.2 | ||
| Labour hold | Swing | -6.5 | |||
| Party | Candidate | Votes | % | ± | |
|---|---|---|---|---|---|
| Labour | Nigel Griffiths | 15,671 | 42.2 | -4.7 | |
| Liberal Democrats | Marilyne MacLaren | 10,172 | 27.4 | +9.7 | |
| Conservative | Gordon Buchan | 6,172 | 16.6 | -4.7 | |
| SNP | Heather Williams | 3,683 | 9.9 | -3.0 | |
| Scottish Socialist | Colin Fox | 933 | 2.5 | N/A | |
| Legalise Cannabis | Margaret Hendry | 535 | 1.4 | N/A | |
| Majority | 5,499 | 14.8 | -10.7 | ||
| Turnout | 37,166 | 57.7 | -14.1 | ||
| Labour hold | Swing | -7.2 | |||
Elections in the 1990s
| Party | Candidate | Votes | % | ± | |
|---|---|---|---|---|---|
| Labour | Nigel Griffiths | 20,993 | 46.8 | +5.3 | |
| Conservative | Elizabeth Smith | 9,541 | 21.3 | -10.8 | |
| Liberal Democrats | Mike Pringle | 7,911 | 17.6 | +4.2 | |
| SNP | John Hargreaves | 5,791 | 12.9 | +0.1 | |
| Referendum | Ian McLean | 504 | 1.1 | ||
| Natural Law | Bradley Dunn | 98 | 0.2 | -0.0 | |
| Majority | 11,452 | 25.5 | |||
| Turnout | 44,838 | 71.8 | |||
| Labour hold | Swing | +8.1 | |||
| Party | Candidate | Votes | % | ± | |
|---|---|---|---|---|---|
| Labour | Nigel Griffiths | 18,485 | 41.5 | ||
| Conservative | Struan Stevenson | 14,309 | 32.1 | ||
| Liberal Democrats | Bob McCreadie | 5,961 | 13.4 | ||
| SNP | Roger Knox | 5,727 | 12.8 | ||
| Natural Law | George Manclark | 108 | 0.2 | ||
| Majority | 4,176 | 9.4 | |||
| Turnout | 44,590 | 72.67 | |||
| Labour hold | Swing | ||||
Elections in the 1980s
| Party | Candidate | Votes | % | ± | |
|---|---|---|---|---|---|
| Labour | Nigel Griffiths | 18,211 | 37.66 | ||
| Conservative | Michael Ancram | 16,352 | 33.81 | ||
| Social Democratic | David Graham | 10,900 | 22.54 | ||
| SNP | Catherina Moore | 2,455 | 5.08 | ||
| Green | Ruth Clark | 440 | 0.91 | ||
| Majority | 1,859 | 3.84 | |||
| Turnout | 77.67 | ||||
| Labour gain from Conservative | Swing | ||||
| Party | Candidate | Votes | % | ± | |
|---|---|---|---|---|---|
| Conservative | Michael Ancram | 16,485 | 36.76 | ||
| Social Democratic | J. Godfrey | 12,830 | 28.61 | ||
| Labour | R. McCreadie | 12,824 | 28.60 | ||
| SNP | Neil MacCallum | 2,256 | 5.03 | ||
| Ecology | L. Hendry | 450 | 1.00 | ||
| Majority | 3,655 | 8.15 | |||
| Turnout | 71.73 | ||||
| Conservative hold | Swing | ||||
Elections in the 1970s
| Party | Candidate | Votes | % | ± | |
|---|---|---|---|---|---|
| Conservative | Michael Ancram | 17,986 | 39.74 | ||
| Labour | Gordon Brown | 15,526 | 34.30 | ||
| Liberal | J.P.B. Lovell | 7,400 | 16.35 | ||
| SNP | R. Shirley | 3,800 | 8.40 | ||
| Ecology | S.M. Biggar | 552 | 1.22 | ||
| Majority | 2,460 | 5.43 | |||
| Turnout | 77.30 | ||||
| Conservative hold | Swing | ||||
| Party | Candidate | Votes | % | ± | |
|---|---|---|---|---|---|
| Conservative | Michael Hutchison | 14,962 | 35.92 | ||
| Labour | C. Haddow | 11,736 | 28.18 | ||
| SNP | R. Shirley | 9,034 | 21.69 | ||
| Liberal | N.L. Gordon | 5,921 | 14.22 | ||
| Majority | 3,226 | 7.74 | |||
| Turnout | 74.18 | ||||
| Conservative hold | Swing | ||||
| Party | Candidate | Votes | % | ± | |
|---|---|---|---|---|---|
| Conservative | Michael Hutchison | 18,784 | 41.74 | ||
| Labour | T.J. Davies | 12,403 | 27.54 | ||
| Liberal | N. Gordon | 8,073 | 17.93 | ||
| SNP | R. Shirley | 5,770 | 12.81 | ||
| Majority | 6,381 | 14.17 | |||
| Turnout | 80.83 | ||||
| Conservative hold | Swing | ||||
| Party | Candidate | Votes | % | ± | |
|---|---|---|---|---|---|
| Conservative | Michael Hutchison | 19,851 | 48.12 | ||
| Labour | John Henderson | 15,071 | 36.53 | ||
| Liberal | Ronald H. Guild | 3,469 | 8.41 | ||
| SNP | David J. Stevenson | 2,861 | 6.94 | ||
| Majority | 4,780 | 11.59 | |||
| Turnout | 73.99 | ||||
| Conservative hold | Swing | ||||
Elections in the 1960s
| Party | Candidate | Votes | % | ± | |
|---|---|---|---|---|---|
| Conservative | Michael Hutchison | 20,820 | 53.16 | ||
| Labour | James W. Kerr | 15,487 | 39.54 | ||
| SNP | H. McLean Robertson | 2,856 | 7.29 | ||
| Majority | 5,333 | 13.62 | |||
| Turnout | 77.63 | ||||
| Conservative hold | Swing | ||||
| Party | Candidate | Votes | % | ± | |
|---|---|---|---|---|---|
| Unionist | Michael Hutchison | 21,375 | 53.17 | ||
| Labour | James W. Kerr | 13,555 | 33.72 | ||
| Liberal | Ronald H. Guild | 5,272 | 13.11 | ||
| Majority | 7,820 | 19.45 | |||
| Turnout | 80.32 | ||||
| Unionist hold | Swing | ||||
Elections in the 1950s
| Party | Candidate | Votes | % | ± | |
|---|---|---|---|---|---|
| Unionist | Michael Hutchison | 22,799 | 57.59 | -9.93 | |
| Labour | Alex D. Reid | 11,285 | 28.51 | -3.97 | |
| Liberal | William Douglas-Home | 5,505 | 13.91 | N/A | |
| Majority | 11,514 | 29.08 | -5.95 | ||
| Turnout | 81.18 | ||||
| Unionist hold | Swing | ||||
| Party | Candidate | Votes | % | ± | |
|---|---|---|---|---|---|
| Unionist | Michael Hutchison | 14,421 | 45.58 | -21.94 | |
| Labour | James A. Forsyth | 9,781 | 30.91 | -1.57 | |
| Liberal | William Douglas-Home | 7,439 | 23.51 | N/A | |
| Majority | 4,640 | 14.67 | -20.41 | ||
| Unionist hold | Swing | ||||
| Party | Candidate | Votes | % | ± | |
|---|---|---|---|---|---|
| Unionist | William Darling | 24,836 | 67.52 | ||
| Labour | James A. Forsyth | 11,949 | 32.48 | ||
| Majority | 12,887 | 35.03 | |||
| Turnout | 77.24 | ||||
| Unionist hold | Swing | ||||
| Party | Candidate | Votes | % | ± | |
|---|---|---|---|---|---|
| Unionist | William Darling | 25,545 | 72.58 | ||
| Labour | James A. Forsyth | 10,030 | 27.42 | ||
| Majority | 16,515 | 45.15 | |||
| Turnout | 81.43 | ||||
| Unionist hold | Swing | ||||
| Party | Candidate | Votes | % | ± | |
|---|---|---|---|---|---|
| Unionist | William Darling | 23,081 | 65.01 | ||
| Labour | William Paisley Earsman | 8,725 | 24.57 | ||
| Liberal | Lionel Daiches | 3,699 | 10.42 | n/a | |
| Majority | 14,356 | 40.43 | |||
| Turnout | 82.14 | ||||
| Unionist hold | Swing | ||||
Election in the 1940s
| Party | Candidate | Votes | % | ± | |
|---|---|---|---|---|---|
| Unionist | William Darling | 23,652 | 70.77 | ||
| Labour | William Paisley Earsman | 9,767 | 29.23 | ||
| Majority | 13,885 | 41.55 | |||
| Turnout | 66.50 | ||||
| Unionist hold | Swing | ||||
Elections in the 1930s
| Party | Candidate | Votes | % | ± | |
|---|---|---|---|---|---|
| Unionist | Samuel Chapman | 27,254 | 83.55 | n/a | |
| Labour | Barbara Woodburn | 5,365 | 16.45 | n/a | |
| Majority | 21,889 | 67.11 | n/a | ||
| Turnout | 67.56 | n/a | |||
| Unionist hold | Swing | n/a | |||
| Party | Candidate | Votes | % | ± | |
|---|---|---|---|---|---|
| Unionist | Samuel Chapman | unopposed | n/a | n/a | |
| Unionist hold | Swing | n/a | |||
Elections in the 1920s
| Party | Candidate | Votes | % | ± | |
|---|---|---|---|---|---|
| Unionist | Samuel Chapman | 19,541 | 56.7 | −7.7 | |
| Liberal | Arthur Pillans Laurie | 9,849 | 28.6 | −7.0 | |
| Labour | Arthur Woodburn | 5,050 | 14.7 | N/A | |
| Majority | 9,692 | 28.1 | −0.7 | ||
| Turnout | 34,440 | 75.2 | +1.6 | ||
| Registered electors | 45,794 | ||||
| Unionist hold | Swing | −0.4 | |||
| Party | Candidate | Votes | % | ± | |
|---|---|---|---|---|---|
| Unionist | Samuel Chapman | 15,854 | 64.4 | +8.7 | |
| Liberal | David Cleghorn Thomson | 8,777 | 35.6 | −8.7 | |
| Majority | 7,077 | 28.8 | +17.4 | ||
| Turnout | 24,631 | 73.6 | +3.4 | ||
| Registered electors | 33,447 | ||||
| Unionist hold | Swing | +8.7 | |||
| Party | Candidate | Votes | % | ± | |
|---|---|---|---|---|---|
| Unionist | Samuel Chapman | 12,804 | 55.7 | −11.0 | |
| Liberal | W. Hope | 10,194 | 44.3 | +11.0 | |
| Majority | 2,610 | 11.4 | −22.0 | ||
| Turnout | 22,998 | 70.2 | +1.0 | ||
| Registered electors | 32,745 | ||||
| Unionist hold | Swing | −11.0 | |||
| Party | Candidate | Votes | % | ± | |
|---|---|---|---|---|---|
| Unionist | Samuel Chapman | 14,843 | 66.7 | −8.3 | |
| Liberal | Catherine Alderton | 7,408 | 33.3 | +8.3 | |
| Majority | 7,435 | 33.4 | −16.6 | ||
| Turnout | 22,251 | 69.2 | +7.4 | ||
| Registered electors | 32,152 | ||||
| Unionist hold | Swing | −8.3 | |||
| Party | Candidate | Votes | % | ± | |
|---|---|---|---|---|---|
| Coalition Unionist | Charles Murray | 11,176 | 57.7 | −17.3 | |
| Liberal | Daniel Holmes | 8,177 | 42.3 | +17.3 | |
| Majority | 2,999 | 15.4 | −34.6 | ||
| Turnout | 19,353 | 59.3 | −2.5 | ||
| Registered electors | 32,656 | ||||
| Unionist hold | Swing | −17.3 | |||
Elections in the 1910s
| Party | Candidate | Votes | % | ± | |
|---|---|---|---|---|---|
| C | Unionist | Charles Murray | 14,874 | 75.0 | +29.5 |
| Liberal | David Caird | 4,966 | 25.0 | −29.5 | |
| Majority | 9,908 | 50.0 | N/A | ||
| Turnout | 19,840 | 61.7 | −22.5 | ||
| Registered electors | 32,087 | ||||
| Unionist gain from Liberal | Swing | +29.5 | |||
| C indicates candidate endorsed by the coalition government. | |||||
| Party | Candidate | Votes | % | ± | |
|---|---|---|---|---|---|
| Liberal | Edward Parrott | Unopposed | |||
| Liberal hold | |||||
| Party | Candidate | Votes | % | ± | |
|---|---|---|---|---|---|
| Liberal | Charles Henry Lyell | 9,576 | 54.5 | −1.9 | |
| Conservative | Charles Murray | 7,986 | 45.5 | +1.9 | |
| Majority | 1,590 | 9.0 | −3.8 | ||
| Turnout | 17,562 | 84.2 | −4.6 | ||
| Registered electors | 20,868 | ||||
| Liberal hold | Swing | −1.9 | |||
| Party | Candidate | Votes | % | ± | |
|---|---|---|---|---|---|
| Liberal | Charles Henry Lyell | 8,694 | 57.7 | +1.3 | |
| Liberal Unionist | Ralph Glyn | 6,367 | 42.3 | −1.3 | |
| Majority | 2,327 | 15.4 | +2.6 | ||
| Turnout | 15,061 | 73.7 | −15.1 | ||
| Registered electors | 20,433 | ||||
| Liberal hold | Swing | +1.3 | |||
| Party | Candidate | Votes | % | ± | |
|---|---|---|---|---|---|
| Liberal | Arthur Dewar | 10,235 | 56.4 | −7.4 | |
| Liberal Unionist | Harold B Cox | 7,901 | 43.6 | +7.4 | |
| Majority | 2,334 | 12.8 | −14.8 | ||
| Turnout | 18,136 | 88.8 | +5.4 | ||
| Registered electors | 20,433 | ||||
| Liberal hold | Swing | −7.4 | |||
Elections in the 1900s
| Party | Candidate | Votes | % | ± | |
|---|---|---|---|---|---|
| Liberal | Arthur Dewar | 8,185 | 54.0 | −9.8 | |
| Liberal Unionist | Harold B Cox | 6,964 | 46.0 | +9.8 | |
| Majority | 1,221 | 8.0 | −19.6 | ||
| Turnout | 15,149 | 80.6 | −2.8 | ||
| Registered electors | 18,789 | ||||
| Liberal hold | Swing | −9.8 | |||

| Party | Candidate | Votes | % | ± | |
|---|---|---|---|---|---|
| Liberal | Arthur Dewar | 8,945 | 63.8 | +14.3 | |
| Liberal Unionist | William C. Smith | 5,085 | 36.2 | −14.3 | |
| Majority | 3,860 | 27.6 | N/A | ||
| Turnout | 14,030 | 83.4 | +6.2 | ||
| Registered electors | 16,832 | ||||
| Liberal gain from Liberal Unionist | Swing | +14.3 | |||
| Party | Candidate | Votes | % | ± | |
|---|---|---|---|---|---|
| Liberal Unionist | Andrew Agnew | 5,766 | 50.5 | +0.0 | |
| Liberal | Arthur Dewar | 5,655 | 49.5 | +0.0 | |
| Majority | 111 | 1.0 | +0.0 | ||
| Turnout | 11,421 | 77.2 | −.17 | ||
| Registered electors | 14,794 | ||||
| Liberal Unionist hold | Swing | +0.0 | |||
Elections in the 1890s
| Party | Candidate | Votes | % | ± | |
|---|---|---|---|---|---|
| Liberal | Arthur Dewar | 5,820 | 53.8 | +4.3 | |
| Conservative | Andrew Wauchope | 4,989 | 46.2 | −4.3 | |
| Majority | 831 | 7.6 | N/A | ||
| Turnout | 10,809 | 77.8 | −1.1 | ||
| Registered electors | 13,891 | ||||
| Liberal gain from Liberal Unionist | Swing | +4.3 | |||
| Party | Candidate | Votes | % | ± | |
|---|---|---|---|---|---|
| Liberal Unionist | Robert Cox | 4,802 | 50.5 | +2.9 | |
| Liberal | Herbert Paul | 4,705 | 49.5 | −2.9 | |
| Majority | 97 | 1.0 | N/A | ||
| Turnout | 9,507 | 78.9 | −4.0 | ||
| Registered electors | 12,053 | ||||
| Liberal Unionist gain from Liberal | Swing | +2.9 | |||
| Party | Candidate | Votes | % | ± | |
|---|---|---|---|---|---|
| Liberal | Herbert Paul | 4,692 | 52.4 | −10.9 | |
| Liberal Unionist | Lewis MacIver | 4,261 | 47.6 | +10.9 | |
| Majority | 431 | 4.8 | −21.8 | ||
| Turnout | 8,953 | 82.9 | +14.7 | ||
| Registered electors | 10,799 | ||||
| Liberal hold | Swing | −10.9 | |||
Elections in the 1880s
| Party | Candidate | Votes | % | ± | |
|---|---|---|---|---|---|
| Liberal | Hugh Childers | 3,778 | 63.3 | +23.1 | |
| Liberal Unionist | Robert Purvis | 2,191 | 36.7 | N/A | |
| Majority | 1,587 | 26.6 | N/A | ||
| Turnout | 5,969 | 68.2 | −13.4 | ||
| Registered electors | 8,754 | ||||
| Liberal gain from Independent Liberal | Swing | N/A | |||
| Party | Candidate | Votes | % | ± | |
|---|---|---|---|---|---|
| Liberal | Hugh Childers | Unopposed | |||
| Liberal gain from Independent Liberal | |||||
- Caused by Childers' appointment as Home Secretary.
| Party | Candidate | Votes | % | ± | |
|---|---|---|---|---|---|
| Liberal | Hugh Childers | 4,029 | 70.0 | +29.8 | |
| Conservative | Walter Hepburne-Scott | 1,730 | 30.0 | N/A | |
| Majority | 2,299 | 40.0 | N/A | ||
| Turnout | 5,759 | 65.8 | −15.8 | ||
| Registered electors | 8,754 | ||||
| Liberal gain from Independent Liberal | Swing | N/A | |||
- Caused by Harrison's death.
| Party | Candidate | Votes | % | ± | |
|---|---|---|---|---|---|
| Independent Liberal | George Harrison | 4,273 | 59.8 | N/A | |
| Liberal | Thomas Raleigh | 2,874 | 40.2 | N/A | |
| Majority | 1,399 | 19.6 | N/A | ||
| Turnout | 7,147 | 81.6 | N/A | ||
| Registered electors | 8,754 | ||||
| Independent Liberal win (new seat) | |||||
Referendum results
2016 European Union membership referendum
| Constituency | Leave votes | Remain votes | Leave % | Remain % |
|---|---|---|---|---|
| Edinburgh South | 10,549 | 37,069 | 22.2% | 77.8% |
2014 Scottish independence referendum
| Constituency | No votes | Yes votes | No % | Yes % |
|---|---|---|---|---|
| Edinburgh South | 38,298 | 20,340 | 65.3% | 34.7% |
See also
Notes and references
- References
- ↑ http://news.bbc.co.uk/1/hi/uk_politics/election_2010/scotland/8667399.stm
- ↑ List of Labour MPs elected in 2015 by % majority UK Political.info. Retrieved 2017-01-29
- ↑ Redistribution of Seats Act 1885, Sixth Schedule
- ↑ Fifth Periodical Review, Boundary Commission for Scotland Archived 21 September 2007 at the Wayback Machine.
- ↑ Leigh Rayment's Historical List of MPs – Constituencies beginning with "E" (part 1)
- ↑ http://www.edinburgh.gov.uk/info/20033/elections_and_voting/1585/who_you_can_vote_for
- ↑ "Election Data 2015". Electoral Calculus. Archived from the original on 17 October 2015. Retrieved 17 October 2015.
- ↑ http://www.edinburgh.gov.uk/downloads/download/1363/uk_parliamentary_election_results_2015
- ↑ https://www.bbc.co.uk/news/politics/constituencies/S14000024
- ↑ Labour MP Nigel Griffiths to quit at election BBC News, 1 February 2010
- ↑ Battleground Seats Times Online
- ↑ Electoral Index, 2009 Archived 5 October 2009 at the Wayback Machine. PoliticsHome
- ↑ "Election Data 2010". Electoral Calculus. Archived from the original on 26 July 2013. Retrieved 17 October 2015.
- ↑ General Election 2010 - Edinburgh South BBC News
- ↑ "Election Data 2005". Electoral Calculus. Archived from the original on 15 October 2011. Retrieved 18 October 2015.
- ↑ "Election Data 2001". Electoral Calculus. Archived from the original on 15 October 2011. Retrieved 18 October 2015.
- ↑ "Election Data 1997". Electoral Calculus. Archived from the original on 15 October 2011. Retrieved 18 October 2015.
- ↑ "Election Data 1992". Electoral Calculus. Archived from the original on 15 October 2011. Retrieved 18 October 2015.
- ↑ "Election Data 1987". Electoral Calculus. Archived from the original on 15 October 2011. Retrieved 18 October 2015.
- ↑ "Election Data 1983". Electoral Calculus. Archived from the original on 15 October 2011. Retrieved 18 October 2015.
- ↑ Whitaker's Almanack, 1939
- ↑ Whitaker's Almanack, 1934
- ↑ Oliver and Boyd's Edinburgh Almanack, 1930
- ↑ Oliver and Boyd's Edinburgh Almanack, 1927
- ↑ The Times, 8 December 1923
- ↑ The Times, 23 April 1920. By-election followed Charles Murray's appointment as Solicitor-General for Scotland
- ↑ Whitaker's Almanack, 1920
- ↑ Debrett's House of Commons and the Judicial Bench, 1922
- 1 2 3 4 5 6 7 8 9 10 11 12 Craig, FWS, ed. (1974). British Parliamentary Election Results: 1885-1918. London: Macmillan Press. ISBN 9781349022984.
- 1 2 3 Debrett's House of Commons and the Judicial Bench, 1916
- ↑ "South Edinburgh Election". Surrey Mirror. 1909-03-05. Retrieved 42654 – via British Newspaper Archive. (Subscription required (help)). Check date values in:
|accessdate=(help) - ↑ Whitaker's Almanack, 1907
- ↑ Debrett's House of Commons and the Judicial Bench, 1901
- Notes
- ↑ As with all Westminster seats which are extant it elects one Member of Parliament (MP) by the first past the post system of election.
- ↑ Since 1986 deposits are lost for a below 5% share of the vote, before which the threshold was 12.5%
- ↑ On 1 February 2010, Nigel Griffiths announced that he would not stand as the Labour candidate in the 2010 general election,[10] and Labour then chose local councillor Ian Murray as their candidate. The Liberal Democrats selected former Edinburgh councillor Fred Mackintosh, the Scottish Conservatives selected veterinary surgeon Dr. Neil Hudson, the SNP selected financial consultant Sandy Howat, and the Green Party selected former research scientist Steve Burgess. The constituency was a top target seat for regional Liberal Democrats and the Conservatives against the Labour Party — the Lib Dem candidate had been under 1% behind the successful Labour candidate in the previous general election. In early 2008 Charles Clarke included it in his "Doomsday Memo" of at-risk Labour constituencies, seeing that it could be taken by the Liberal Democrats with a swing of under 0.5%.[11] In October 2009 a polling of marginal Scottish constituencies suggested that it could be taken by the Liberal Democrats.[12] In the event, Labour managed to hold on to the seat, restricting the swing to 0.1% to the Liberal Democrats.