Newcastle upon Tyne North (UK Parliament constituency)
| Newcastle upon Tyne North | |
|---|---|
|
Borough constituency for the House of Commons | |
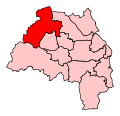 Boundary of Newcastle upon Tyne North in Tyne and Wear. | |
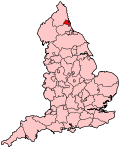 Location of Tyne and Wear within England. | |
| County | Tyne and Wear |
| Electorate | 67,401 (December 2010)[1] |
| Current constituency | |
| Created | 1918 |
| Member of parliament | Catherine McKinnell (Labour) |
| Number of members | One |
| Overlaps | |
| European Parliament constituency | North East England |
Newcastle upon Tyne North is a constituency[n 1] represented in the House of Commons of the UK Parliament since 2010 by Catherine McKinnell of the Labour Party.[n 2]
Boundaries
1918-1950: The County Borough of Newcastle wards of Dene, Heaton, Jesmond, St Andrew's, and St Thomas.
1950-1983: The County Borough of Newcastle wards of Arthur's Hill, Elswick, Jesmond, Sandyford, and Westgate.
1983-2010: The City of Newcastle wards of Castle, Denton, Fawdon, Grange, Lemington, Newburn, Westerhope, and Woolsington.
2010-present: The City of Newcastle wards of Castle, Denton, East Gosforth, Fawdon, Lemington, Newburn, Parklands, Westerhope, and Woolsington.
The constituency included Newcastle city centre from 1950 to 1983 - this despite the fact that the Newcastle Central constituency was retained, albeit with redrawn boundaries.
History
From its creation in 1918, the seat was a safe Conservative Party seat— including six years of complex representation in terms of the modern parties by Gwilym Lloyd George, who was Home Secretary for almost three years until 1957 in a Conservative government. This continued until the 1983 general election, when boundary changes resulted in the Newcastle North of 1983 being composed entirely of wards that did not form part of the pre-1983 Newcastle North (the majority of the old Newcastle North moving to Newcastle Central, which the Conservatives won in 1983). Under these new boundaries, the seat was notionally a safe Labour seat. Despite the Labour Party being defeated in a landslide in 1983, Labour retained the new Newcastle North seat and have done so ever since, with the Liberal Democrats being the greatest challengers in 2005 and 2010, and the Conservatives finishing in second place in 2015 and 2017.
Members of Parliament
Elections
Elections in the 2010s
| Party | Candidate | Votes | % | ± | |
|---|---|---|---|---|---|
| Labour | Catherine McKinnell | 26,729 | 55.4 | 9.3 | |
| Conservative | Duncan Crute | 16,380 | 33.9 | 10.5 | |
| Liberal Democrat | Anita Lower | 2,533 | 5.2 | 4.5 | |
| UKIP | Timothy Marron | 1,780 | 3.6 | 12.9 | |
| Green | Alison Whalley[3] | 513 | 1.0 | 2.3 | |
| North of England Community Alliance | Brian Moore | 353 | 0.8 | N/A | |
| Majority | 10,349 | 21.5 | 1.1 | ||
| Turnout | 48,768 | 72.4 | 5.7 | ||
| Labour hold | Swing | -0.6 | |||
| Party | Candidate | Votes | % | ± | |
|---|---|---|---|---|---|
| Labour | Catherine McKinnell | 20,689 | 46.1 | 5.2 | |
| Conservative | Stephen Bates[5] | 10,536 | 23.5 | 5.3 | |
| UKIP | Timothy Marron | 7,447 | 16.6 | 13.7 | |
| Liberal Democrat | Anita Lower[6] | 4,366 | 9.7 | 23.4 | |
| Green | Alison Whalley[7] | 1,515 | 3.4 | 2.6 | |
| North East Party | Violet Rook[8] | 338 | 0.7 | 0.8 | |
| Majority | 10,153 | 22.6 | 15.2 | ||
| Turnout | 44,891 | 66.7 | 1.2 | ||
| Labour hold | Swing | 0.05 |
|||
| Party | Candidate | Votes | % | ± | |
|---|---|---|---|---|---|
| Labour | Catherine McKinnell | 17,950 | 40.8 | −9.0 | |
| Liberal Democrat | Ronald W.A.L. Beadle | 14,536 | 33.1 | +0.1 | |
| Conservative | Stephen Parkinson | 7,966 | 18.1 | +3.4 | |
| BNP | Terry Gibson | 1,890 | 4.3 | +4.3 | |
| UKIP | Ian Proud | 1,285 | 2.9 | +2.9 | |
| Green | Anna Heyman | 319 | 0.7 | +0.7 | |
| Majority | 3,414 | 7.8 | -9.5 | ||
| Turnout | 43,946 | 65.5 | +3.8 | ||
| Labour hold | Swing | −4.5 | |||
Elections in the 2000s
| Party | Candidate | Votes | % | ± | |
|---|---|---|---|---|---|
| Labour | Doug Henderson | 19,224 | 50.0 | −10.1 | |
| Liberal Democrat | Ronald W.A.L. Beadle | 12,201 | 31.7 | +12.3 | |
| Conservative | Neil Hudson | 6,022 | 15.7 | −4.7 | |
| National Front | Roland Wood | 997 | 2.6 | +2.6 | |
| Majority | 7,023 | 18.3 | -21.4 | ||
| Turnout | 38,444 | 67.6 | +10.1 | ||
| Labour hold | Swing | −11.2 | |||
| Party | Candidate | Votes | % | ± | |
|---|---|---|---|---|---|
| Labour | Doug Henderson | 21,874 | 60.1 | −2.0 | |
| Conservative | Philip R. Smith | 7,424 | 20.4 | +1.0 | |
| Liberal Democrat | Graham A. Soult | 7,070 | 19.4 | +4.9 | |
| Majority | 14,450 | 39.7 | -3 | ||
| Turnout | 36,368 | 57.5 | −11.6 | ||
| Labour hold | Swing | -0.5 | |||
Elections in the 1990s
| Party | Candidate | Votes | % | ± | |
|---|---|---|---|---|---|
| Labour | Doug Henderson | 28,125 | 62.2 | +12.8 | |
| Conservative | Gregory B. White | 8,793 | 19.4 | −12.4 | |
| Liberal Democrat | Peter J. Allen | 6,578 | 14.5 | −4.2 | |
| Referendum | Doreen Chipchase | 1,733 | 3.8 | N/A | |
| Majority | 19,332 | 42.7 | +25.1 | ||
| Turnout | 45,229 | 69.2 | -7.6 | ||
| Labour hold | Swing | +12.6 | |||
| Party | Candidate | Votes | % | ± | |
|---|---|---|---|---|---|
| Labour | Doug Henderson | 25,121 | 49.4 | +6.7 | |
| Conservative | Ian Gordon | 16,175 | 31.8 | -0.9 | |
| Liberal Democrat | Peter J. Maughan | 9,542 | 18.8 | −13.9 | |
| Majority | 8,946 | 17.6 | +7.6 | ||
| Turnout | 50,838 | 76.8 | +0.5 | ||
| Labour hold | Swing | −0.3 | |||
Elections in the 1980s
| Party | Candidate | Votes | % | ± | |
|---|---|---|---|---|---|
| Labour | Doug Henderson | 22,424 | 42.7 | +5.1 | |
| Liberal | John Shipley | 17,181 | 32.7 | +2.8 | |
| Conservative | John Tweddle | 12,915 | 24.6 | −7.9 | |
| Majority | 5,243 | 10.0 | |||
| Turnout | 52,520 | 75.9 | |||
| Labour hold | Swing | ||||
| Party | Candidate | Votes | % | ± | |
|---|---|---|---|---|---|
| Labour | Robert Brown | 18,985 | 37.6 | −10.8 | |
| Conservative | Philip Straw | 16,429 | 32.5 | −5.1 | |
| Liberal | John Shipley | 15,136 | 29.9 | +16.2 | |
| Majority | 2,556 | 5.1 | |||
| Turnout | 50,550 | 72.8 | |||
| Labour hold | Swing | ||||
Elections in the 1970s
| Party | Candidate | Votes | % | ± | |
|---|---|---|---|---|---|
| Conservative | William Elliott | 12,721 | 47.6 | ||
| Labour | S. Ward | 11,010 | 41.2 | ||
| Liberal | C. Marlowe | 2,983 | 11.2 | ||
| Majority | 1,711 | 6.4 | |||
| Turnout | 26,714 | 68.0 | |||
| Conservative hold | Swing | ||||
| Party | Candidate | Votes | % | ± | |
|---|---|---|---|---|---|
| Conservative | William Elliott | 11,217 | 42.9 | ||
| Labour | Tony Banks | 10,748 | 41.1 | ||
| Liberal | David Herd | 4,189 | 16.0 | ||
| Majority | 469 | 1.8 | |||
| Turnout | 26,154 | 65.0 | |||
| Conservative hold | Swing | ||||
| Party | Candidate | Votes | % | ± | |
|---|---|---|---|---|---|
| Conservative | William Elliott | 12,793 | 43.6 | ||
| Labour | R.G. Eccles | 9,813 | 33.4 | ||
| Liberal | Chris Foote Wood | 6,772 | 23.1 | ||
| Majority | 2,980 | 10.1 | |||
| Turnout | 29,378 | 73.4 | |||
| Conservative hold | Swing | ||||
| Party | Candidate | Votes | % | ± | |
|---|---|---|---|---|---|
| Conservative | William Elliott | 15,978 | 56.1 | ||
| Labour | Robert Eccles | 12,518 | 43.9 | ||
| Majority | 3,460 | 12.1 | |||
| Turnout | 28,496 | 67.7 | |||
| Conservative hold | Swing | ||||
Elections in the 1960s
| Party | Candidate | Votes | % | ± | |
|---|---|---|---|---|---|
| Conservative | William Elliott | 15,243 | 49.7 | ||
| Labour | Robert Griffin | 12,550 | 40.9 | ||
| Liberal | Alan Share | 2,902 | 9.5 | ||
| Majority | 2,693 | 8.8 | |||
| Turnout | 30,695 | 75.1 | |||
| Conservative hold | Swing | ||||
| Party | Candidate | Votes | % | ± | |
|---|---|---|---|---|---|
| Conservative | William Elliott | 19,502 | 60.9 | ||
| Labour | Sidney Lee | 12,515 | 39.1 | ||
| Majority | 6,987 | 21.8 | |||
| Turnout | 32,017 | 75.6 | |||
| Conservative hold | Swing | ||||
Elections in the 1950s
| Party | Candidate | Votes | % | ± | |
|---|---|---|---|---|---|
| Conservative | William Elliott | 24,588 | 64.9 | ||
| Labour | Lloyd Prichard | 13,316 | 35.1 | ||
| Majority | 11,272 | 29.7 | |||
| Turnout | 37,904 | 79.1 | |||
| Conservative hold | Swing | ||||
| Party | Candidate | Votes | % | ± | |
|---|---|---|---|---|---|
| Conservative | William Elliott | 19,107 | 60.35 | -3.5 | |
| Labour | T. McDonald | 12,555 | 39.65 | +3.5 | |
| Majority | 6,462 | 20.70 | -6.95 | ||
| Turnout | |||||
| Conservative hold | Swing | ||||
| Party | Candidate | Votes | % | ± | |
|---|---|---|---|---|---|
| National Liberal and Conservative | Gwilym Lloyd-George | 25,236 | 63.8 | ||
| Labour | Basil Chisholm | 14,303 | 36.2 | ||
| Majority | 10,933 | 27.7 | - | ||
| Turnout | 39,539 | ||||
| National Liberal and Conservative hold | Swing | ||||
| Party | Candidate | Votes | % | ± | |
|---|---|---|---|---|---|
| National Liberal and Conservative | Gwilym Lloyd-George | 23,930 | 51.1 | ||
| Labour | Ivan Geffen | 17,005 | 36.3 | ||
| Ind. Conservative | Colin Gray | 5,904 | 12.1 | ||
| Majority | 6,925 | 14.8 | |||
| Turnout | 46,839 | ||||
| National Liberal and Conservative hold | Swing | ||||
| Party | Candidate | Votes | % | ± | |
|---|---|---|---|---|---|
| Conservative | Cuthbert Headlam | 25,325 | 53.9 | ||
| Labour | W.H. Shackleton | 16,860 | 35.9 | ||
| Liberal | Aubrey Herbert | 4,839 | 10.3 | ||
| Majority | 8,465 | 18.0 | |||
| Turnout | 47,024 | 83.7 | |||
| Conservative hold | Swing | ||||
Elections in the 1940s
| Party | Candidate | Votes | % | ± | |
|---|---|---|---|---|---|
| Conservative | Cuthbert Headlam | 17,381 | 50.6 | ||
| Labour Co-op | W Henry Shackleton | 10,228 | 29.8 | ||
| Liberal | William McKeag | 5,812 | 16.9 | ||
| Common Wealth | Henry Arthur Charles Ridsdale | 904 | 2.6 | ||
| Majority | 7,153 | 20.8 | |||
| Turnout | 34,325 | 73.2 | |||
| Conservative hold | Swing | ||||
| Party | Candidate | Votes | % | ± | |
|---|---|---|---|---|---|
| Ind. Conservative | Cuthbert Headlam | 7,380 | 71.2 | N/A | |
| Conservative | Howard Grattan-Doyle | 2,982 | 28.8 | −48.2 | |
| Majority | 4,398 | 42.4 | |||
| Turnout | 10,362 | 22.0 | −48.3 | ||
| Ind. Conservative gain from Conservative | Swing | ||||
Elections in the 1930s
| Party | Candidate | Votes | % | ± | |
|---|---|---|---|---|---|
| Conservative | Nicholas Grattan-Doyle | 25,683 | 77.0 | ||
| Labour | E. Gilbert | 7,693 | 23.1 | ||
| Majority | 17,990 | 53.9 | |||
| Turnout | 33,376 | 70.3 | |||
| Conservative hold | Swing | ||||
| Party | Candidate | Votes | % | ± | |
|---|---|---|---|---|---|
| Conservative | Nicholas Grattan-Doyle | 30,245 | 83.93 | ||
| Labour | R.J. Thomson | 5,791 | 16.07 | ||
| Majority | 24,454 | 67.86 | |||
| Turnout | 76.83 | ||||
| Conservative hold | Swing | ||||
Elections in the 1920s
| Party | Candidate | Votes | % | ± | |
|---|---|---|---|---|---|
| Unionist | Nicholas Grattan-Doyle | 17,962 | 55.4 | −17.1 | |
| Labour | Edward Scott | 7,573 | 23.4 | −4.1 | |
| Liberal | J. Roberts Creighton | 6,860 | 21.2 | N/A | |
| Majority | 10,389 | 32.0 | −13.0 | ||
| Turnout | 32,395 | 70.9 | −3.3 | ||
| Registered electors | 45,720 | ||||
| Unionist hold | Swing | −6.5 | |||
| Party | Candidate | Votes | % | ± | |
|---|---|---|---|---|---|
| Unionist | Nicholas Grattan-Doyle | 18,386 | 72.5 | +20.4 | |
| Labour | H. Maw | 6,991 | 27.5 | +5.5 | |
| Majority | 11,395 | 45.0 | +18.8 | ||
| Turnout | 25,377 | 74.2 | +0.6 | ||
| Registered electors | 34,209 | ||||
| Unionist hold | Swing | +7.5 | |||
| Party | Candidate | Votes | % | ± | |
|---|---|---|---|---|---|
| Unionist | Nicholas Grattan-Doyle | 12,715 | 52.1 | −9.1 | |
| Liberal | Robert Wilfred Simpson | 6,321 | 25.9 | −7.0 | |
| Labour | John Beckett | 5,374 | 22.0 | N/A | |
| Majority | 6,394 | 26.2 | −2.1 | ||
| Turnout | 24,410 | 73.6 | −0.3 | ||
| Registered electors | 33,182 | ||||
| Unionist hold | Swing | −1.1 | |||
| Party | Candidate | Votes | % | ± | |
|---|---|---|---|---|---|
| Unionist | Nicholas Grattan-Doyle | 14,931 | 61.2 | +0.7 | |
| Liberal | Robert Wilfred Simpson | 8,017 | 32.9 | +9.9 | |
| Independent Labour | Robert John Wilson | 1,435 | 5.9 | N/A | |
| Majority | 6,914 | 28.3 | −9.2 | ||
| Turnout | 24,383 | 73.9 | +15.7 | ||
| Registered electors | 32,987 | ||||
| Unionist hold | Swing | −4.6 | |||
Election in the 1910s
| Party | Candidate | Votes | % | ± | |
|---|---|---|---|---|---|
| C | Unionist | Nicholas Grattan-Doyle | 11,347 | 60.5 | N/A |
| Liberal | George Lunn | 4,322 | 23.0 | N/A | |
| Labour | Robert John Wilson | 3,102 | 16.5 | N/A | |
| Majority | 7,025 | 37.5 | N/A | ||
| Turnout | 18,771 | 58.2 | N/A | ||
| Registered electors | 32,272 | ||||
| Unionist win (new seat) | |||||
| C indicates candidate endorsed by the coalition government. | |||||
See also
Notes and references
- Notes
- ↑ A borough constituency (for the purposes of election expenses and type of returning officer)
- ↑ As with all constituencies, the constituency elects one Member of Parliament (MP) by the first past the post system of election at least every five years.
- References
- ↑ "Electorate Figures - Boundary Commission for England". 2011 Electorate Figures. Boundary Commission for England. 4 March 2011. Archived from the original on 6 November 2010. Retrieved 13 March 2011.
- ↑ Leigh Rayment's Historical List of MPs – Constituencies beginning with "N" (part 1)
- ↑ "Green Party announces its Newcastle candidates". Newcastle upon Tyne Green Party. Retrieved 29 April 2017.
- ↑ "Election Data 2015". Electoral Calculus. Archived from the original on 17 October 2015. Retrieved 17 October 2015.
- ↑ "Stephen Bates".
- ↑ "Anita Lower PPC page". Liberal Democrats. Retrieved 23 February 2015.
- ↑ "green-party-mps-for-newcastle". Retrieved 13 February 2015.
- ↑ "Violet Rook PPC page" (PDF). The North East Party. Retrieved 13 February 2015.
- ↑ "Election Data 2010". Electoral Calculus. Archived from the original on 26 July 2013. Retrieved 17 October 2015.
- ↑ http://www.newcastle.gov.uk/wwwfileroot/cxo/electoral/SPNNorth2010.pdf
- ↑ "BBC NEWS – Election 2010 – Newcastle Upon Tyne East". BBC News.
- ↑ "Election Data 2005". Electoral Calculus. Archived from the original on 15 October 2011. Retrieved 18 October 2015.
- ↑ "Election Data 2001". Electoral Calculus. Archived from the original on 15 October 2011. Retrieved 18 October 2015.
- ↑ "Election Data 1997". Electoral Calculus. Archived from the original on 15 October 2011. Retrieved 18 October 2015.
- ↑ "Election Data 1992". Electoral Calculus. Archived from the original on 15 October 2011. Retrieved 18 October 2015.
- ↑ "Politics Resources". Election 1992. Politics Resources. 9 April 1992. Retrieved 2010-12-06.
- ↑ "Election Data 1987". Electoral Calculus. Archived from the original on 15 October 2011. Retrieved 18 October 2015.
- ↑ "Election Data 1983". Electoral Calculus. Archived from the original on 15 October 2011. Retrieved 18 October 2015.
- ↑ The Times' Guide to the House of Commons. 1955.
- ↑ The Times' Guide to the House of Commons. 1966.
- ↑ The Times' Guide to the House of Commons. 1964.
- ↑ The Times' Guide to the House of Commons. 1959.
- ↑ The Times' Guide to the House of Commons. 1951.
- ↑ British Parliamentary Election Results 1918-1949, FWS Craig
- ↑ British Parliamentary Election Results 1918-1949, FWS Craig
- ↑ British Parliamentary Election Results 1918-1949, FWS Craig
- ↑ British Parliamentary Election Results 1918-1949, FWS Craig
- ↑ British Parliamentary Election Results 1918-1949, FWS Craig
Sources
- Craig, F. W. S. (1983) [1969]. British parliamentary election results 1918-1949 (3rd ed.). Chichester: Parliamentary Research Services. ISBN 0-900178-06-X.