Warley (UK Parliament constituency)
| Warley | |
|---|---|
|
Borough constituency for the House of Commons | |
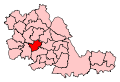 Boundary of Warley in West Midlands. | |
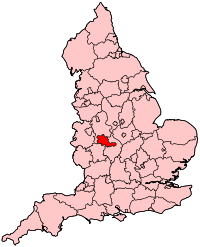 Location of West Midlands within England. | |
| County | West Midlands |
| Electorate | 63,024 (December 2010)[1] |
| Major settlements | Smethwick, Brandhall, Langley Green |
| Current constituency | |
| Created | 1997 |
| Member of parliament | John Spellar (Labour) |
| Number of members | One |
| Created from | Warley East, Warley West |
| Overlaps | |
| European Parliament constituency | West Midlands |
Warley is a constituency[n 1] in the House of Commons of the UK Parliament. The constituency was established in 1997, and has been represented since that date by John Spellar, a member of the Labour Party.[n 2]
Members of Parliament
| Election | Member[2] | Party | |
|---|---|---|---|
| 1997 | John Spellar | Labour | |
Constituency profile
The constituency has a wide range of housing on the gently hilly West Midlands terrain, with fast transport links to Birmingham, Dudley and Wolverhampton. Workless claimants, registered jobseekers, were in November 2012 significantly higher than the national average of 3.8%, at 7.7% of the population based on a statistical compilation by The Guardian however female unemployment, reflecting a central West Midlands pattern, perhaps with more women homemakers, unusually exceeded male unemployment at 10.1%.[3]
Boundaries
Warley is one of four constituencies covering the Metropolitan Borough of Sandwell, covering the south and south-east of the borough. It covers much of the former County Borough of Warley, including the town of Smethwick as well as Brandhall and Langley Green. The Metropolitan Borough of Sandwell wards of Abbey, Bristnall, Langley, Old Warley, St Paul's, Smethwick, and Soho and Victoria.
History
- Creation and forerunners
The constituency was formed in 1997, and is for the most part the former Warley East constituency. John Spellar of the Labour Party has represented Warley since 1997, having previously represented Warley West. Warley East and Warley West had been held by Labour since their creation in 1974. Minor parts of the seat around Oldbury had been in the quite marginal Labour-Conservative seat of Oldbury and Halesowen before 1974.
- Results of winning party
The 2015 result made the seat the 34th-safest of Labour's 232 seats by percentage of majority.[4] The elections have to date resulted in the Labour incumbent, Spellar, gaining more than 50% of votes cast.
- Opposition parties
The candidates fielded by the Conservative Party have taken the runner-up position since the seat's creation. Third place has varied between two parties to date in the seat's history.
- Turnout
Turnout has ranged from 54.1% in 2001 to 65.1% in 1997.
Elections
Elections in the 2010s
]]
| Party | Candidate | Votes | % | ± | |
|---|---|---|---|---|---|
| Labour | John Spellar | 27,004 | 67.2 | ||
| Conservative | Anthony Mangnall | 10,521 | 26.2 | ||
| UKIP | Darryl Magher | 1,349 | 3.4 | ||
| Liberal Democrat | Bryan Manley-Green | 777 | 1.9 | ||
| Green | Mark Redding | 555 | 1.4 | ||
| Majority | 16,483 | 41.0 | |||
| Turnout | 40,206 | 63.1 | |||
| Registered electors | |||||
| Labour hold | Swing | ||||
| Party | Candidate | Votes | % | ± | |
|---|---|---|---|---|---|
| Labour | John Spellar | 22,012 | 58.2 | ||
| Conservative | Tom Williams | 7,310 | 19.3 | ||
| UKIP | Pete Durnell | 6,237 | 16.5 | ||
| Green | Robert Buckman | 1,465 | 3.9 | ||
| Liberal Democrat | Catherine Smith | 805 | 2.1 | ||
| Majority | 14,702 | 38.9 | |||
| Turnout | 37,829 | 59.3 | |||
| Labour hold | Swing | ||||
| Party | Candidate | Votes | % | ± | |
|---|---|---|---|---|---|
| Labour | John Spellar | 20,240 | 52.9 | ||
| Conservative | Jas Parmer | 9,484 | 24.8 | ||
| Liberal Democrat | Edward Keating[9] | 5,929 | 15.5 | ||
| UKIP | Nigel Harvey | 2,617 | 6.8 | ||
| Majority | 10,756 | 28.1 | |||
| Turnout | 38,270 | 60.6 | |||
| Labour hold | Swing | ||||
Elections in the 2000s
| Party | Candidate | Votes | % | ± | |
|---|---|---|---|---|---|
| Labour | John Spellar | 17,462 | 54.4 | ||
| Conservative | Karen Bissell | 7,315 | 22.8 | ||
| Liberal Democrat | Tony Ferguson | 4,277 | 13.3 | ||
| BNP | Simon Smith | 1,761 | 5.5 | ||
| Socialist Labour | Malcolm Connigale | 637 | 2.0 | ||
| UKIP | David Matthews | 635 | 2.0 | ||
| Majority | 10,147 | 31.6 | |||
| Turnout | 32,087 | 57.1 | |||
| Labour hold | Swing | ||||
| Party | Candidate | Votes | % | ± | |
|---|---|---|---|---|---|
| Labour | John Spellar | 19,007 | 60.5 | ||
| Conservative | Mark Pritchard | 7,157 | 22.8 | ||
| Liberal Democrat | Ron Cockings | 3,315 | 10.6 | ||
| Socialist Labour | Harbhajan Dardi | 1,936 | 6.2 | ||
| Majority | 11,850 | 37.7 | |||
| Turnout | 31,415 | 54.1 | |||
| Labour hold | Swing | ||||
Elections in the 1990s
| Party | Candidate | Votes | % | ± | |
|---|---|---|---|---|---|
| Labour | John Spellar | 24,813 | 63.8 | ||
| Conservative | Christopher Pincher | 9,362 | 24.1 | ||
| Liberal Democrat | Jeremy Pursehouse | 3,777 | 9.7 | ||
| Referendum | Krishna Gamre | 941 | 2.4 | ||
| Majority | 15,451 | 39.7 | |||
| Turnout | 38,893 | 65.0 | |||
| Labour win (new seat) | |||||
See also
Notes and references
- Notes
- ↑ A borough constituency (for the purposes of election expenses and type of returning officer)
- ↑ As with all constituencies, the constituency elects one Member of Parliament (MP) by the first past the post system of election at least every five years.
- References
- ↑ "Electorate Figures - Boundary Commission for England". 2011 Electorate Figures. Boundary Commission for England. 4 March 2011. Retrieved 13 March 2011.
- ↑ Leigh Rayment's Historical List of MPs – Constituencies beginning with "W" (part 1)
- ↑ Unemployment claimants by constituency The Guardian
- ↑ List of Labour MPs elected in 2015 by % majority UK Political.info. Retrieved 2017-01-29
- ↑ "Statement of persons nominated - Warley". Sandwell Council. Retrieved 12 May 2017.
- ↑ "Warley results". BBC News. Retrieved 9 June 2017.
- ↑ "Election Data 2015". Electoral Calculus. Archived from the original on 17 October 2015. Retrieved 17 October 2015.
- ↑ "Election Data 2010". Electoral Calculus. Archived from the original on 17 October 2015. Retrieved 17 October 2015.
- ↑ http://www.libdems.org.uk/people_detail.aspx?name=Edward_Keating&pPK=ccb5560a-22a3-4102-82ad-f4938901de91
- ↑ "Election Data 2005". Electoral Calculus. Archived from the original on 15 October 2011. Retrieved 18 October 2015.
- ↑ "Election Data 2001". Electoral Calculus. Archived from the original on 15 October 2011. Retrieved 18 October 2015.
- ↑ "Election Data 1997". Electoral Calculus. Archived from the original on 15 October 2011. Retrieved 18 October 2015.