Bristol West (UK Parliament constituency)
| Bristol West | |
|---|---|
|
Borough constituency for the House of Commons | |
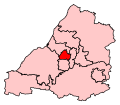 Boundary of Bristol West in Avon. | |
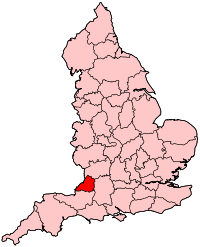 Location of Avon within England. | |
| County | City of Bristol |
| Electorate | 91,236 (December 2015)[1] |
| Current constituency | |
| Created | 1885 |
| Member of parliament | Thangam Debbonaire (Labour) |
| Number of members | One |
| Created from | Bristol |
| Overlaps | |
| European Parliament constituency | South West England |
Bristol West is a borough constituency represented in the House of Commons of the Parliament of the United Kingdom. It covers the central and western parts of Bristol.
Boundaries
1885-1918: The Municipal Borough of Bristol wards: Clifton, St Augustine's, St Michael's, and Westbury, and the local government district of Horfield.
1918-1950: The County Borough of Bristol wards: Clifton North, Clifton South, Horfield, Redland, St Michael, and Westbury-on-Trym.
1950-1955: The County Borough of Bristol wards: Bishopston, Clifton, Redland, St Augustine, St James, and St Michael.
1955-1974: The County Borough of Bristol wards: Bishopston, Cabot, Clifton, Durdham, and Redland.
1974-1983: as above plus District
1983-1997: The City of Bristol wards of Ashley, Bishopston, Cabot, Clifton, Cotham, Henleaze, Redland, and Stoke Bishop.
1997-2010: as above plus Westbury-on-Trym.
2010–present: as above less Westbury-on-Trym, Stoke Bishop and Henleaze, plus Clifton East, Easton, and Lawrence Hill
The above shows that the changes implemented for the 2010 general election boundaries were relatively great, recommended by a periodic impartial Boundary Commission review.[2] Easton and Lawrence Hill wards were transferred from Bristol East, while Henleaze, Stoke Bishop and Westbury-on-Trym wards were lost to Bristol North West. During the review, a proposal to rename the constituency as "Bristol Central" was rejected.[2]
History
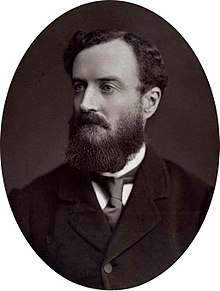
More compactly urban since 2010, the seat retains a high proportion of the city's most garden-rich, grandest houses and landscaped civic parks. It was held by Conservatives continuously for 112 years. It was represented by members including Conservative cabinet ministers Michael Hicks-Beach, Oliver Stanley, Walter Monckton and William Waldegrave. As part of a national Labour Party landslide, exceeding that of 1945, the 1997 gain by Valerie Davey was from a third-placed starting point for the party's candidate in 1992. Many of the townhouses in Bristol in the latter half of the 20th century were subdivided during which time the size of the University of Bristol increased (the city's largest single independent employer which is chiefly in the seat) and the University of the West of England overtook its scale, mainly in Filton & Bradley Stoke constituency.[3]
At the 2005 election the seat was Liberal Democrat target number 18, and Conservative target number 50; it had been frequently described in the media as a "three-way marginal", and all parties fought hard for the constituency. The seat was taken by Liberal Democrat Stephen Williams with a large majority, thought to have been aided by the large student electorate, hostile to Labour's top-up fees policy. This Liberal Democrat success was similar to those in other seats with a large student population, such as Cambridge, Manchester Withington, Leeds North West and Cardiff Central. In the 2010 election, Stephen Williams held the seat with an increased majority.[4] In the 2015 general election, the Lib Dem vote fell by 29.2%; Williams came a distant third behind the winning Labour candidate Thangam Debbonaire and more than 5,000 votes behind the Green Party candidate, who achieved the greatest increase in the Green vote (+23%) in any seat that election.[5] In 2017 Bristol West had the biggest swing to Labour in the country. [6]. The 52.1% majority was also the largest in the seat since 1931.
Members of Parliament
Elections
Elections in the 2010s
| Party | Candidate | Votes | % | ± | |
|---|---|---|---|---|---|
| Labour | Thangam Debbonaire | 47,213 | 65.9 | ||
| Conservative | Annabel Tall | 9,877 | 13.8 | ||
| Green | Molly Scott Cato | 9,216 | 12.9 | ||
| Liberal Democrat | Stephen Williams | 5,201 | 7.3 | ||
| Money Free Party | Jodian Rodgers | 101 | 0.1 | N/A | |
| Majority | 37,336 | 52.1 | |||
| Turnout | 71,608 | 77.1 | |||
| Labour hold | Swing | ||||
| Party | Candidate | Votes | % | ± | |
|---|---|---|---|---|---|
| Labour | Thangam Debbonaire | 22,900 | 35.7 | ||
| Green | Darren Hall | 17,227 | 26.8 | ||
| Liberal Democrat | Stephen Williams | 12,103 | 18.8 | ||
| Conservative | Claire Hiscott | 9,752 | 15.2 | ||
| UKIP | Paul Turner | 1,940 | 3.0 | ||
| Independent | Dawn Parry | 204 | 0.3 | N/A | |
| Left Unity | Stewart Weston | 92 | 0.1 | N/A | |
| Majority | 5,673 | 8.8 | N/A | ||
| Turnout | 64,218 | 72.0 | |||
| Labour gain from Liberal Democrat | Swing | ||||
(Note that the vote-share changes for 2010 are from the notional results on the new boundaries, not the actual 2005 results))
| Party | Candidate | Votes | % | ± | |
|---|---|---|---|---|---|
| Liberal Democrat | Stephen Williams | 26,593 | 48.0 | ||
| Labour | Paul Smith | 15,227 | 27.5 | ||
| Conservative | Nick Yarker | 10,169 | 18.4 | ||
| Green | Ricky Knight | 2,090 | 3.8 | ||
| UKIP | Christopher Lees | 655 | 1.2 | ||
| Independent | Danny Kushlick | 343 | 0.6 | N/A | |
| English Democrat | Jon Baker | 270 | 0.5 | N/A | |
| Majority | 11,366 | 20.5 | |||
| Turnout | 55,347 | 66.9 | |||
| Liberal Democrat hold | Swing | ||||
Elections in the 2000s
| Party | Candidate | Votes | % | ± | |
|---|---|---|---|---|---|
| Liberal Democrat | Stephen Williams | 21,987 | 38.3 | ||
| Labour | Valerie Davey | 16,859 | 29.4 | ||
| Conservative | David Martin | 15,429 | 26.9 | ||
| Green | Justin Quinnell | 2,163 | 3.8 | ||
| UKIP | Simon Muir | 439 | 0.8 | ||
| Socialist Labour | Bernard Kennedy | 329 | 0.6 | ||
| Save Bristol North Baths Party | Douglas Reid | 190 | 0.3 | ||
| Majority | 5,128 | 8.9 | N/A | ||
| Turnout | 57,396 | 70.5 | |||
| Liberal Democrat gain from Labour | Swing | ||||
| Party | Candidate | Votes | % | ± | |
|---|---|---|---|---|---|
| Labour | Valerie Davey | 20,505 | 36.8 | ||
| Liberal Democrat | Stephen Williams | 16,079 | 28.9 | ||
| Conservative | Pamela Chesters | 16,040 | 28.8 | ||
| Green | John Devaney | 1,961 | 3.5 | ||
| Socialist Labour | Bernard J. Kennedy | 590 | 1.1 | ||
| UKIP | Simon D. Muir | 490 | 0.9 | N/A | |
| Majority | 4,426 | 7.9 | |||
| Turnout | 55,665 | 65.6 | |||
| Labour hold | Swing | ||||
Elections in the 1990s
| Party | Candidate | Votes | % | ± | |
|---|---|---|---|---|---|
| Labour | Valerie Davey | 22,068 | 35.2 | ||
| Conservative | William Waldegrave | 20,575 | 32.8 | ||
| Liberal Democrat | Charles R. Boney | 17,551 | 28.0 | ||
| Referendum | Margot Beauchamp | 1,304 | 2.1 | N/A | |
| Green | Justin Quinnell | 852 | 1.4 | ||
| Socialist Labour | Roy Nurse | 244 | 0.4 | N/A | |
| Natural Law | Jai Brierley | 47 | 0.1 | ||
| Majority | 1,493 | 2.4 | N/A | ||
| Turnout | 62,641 | 73.8 | |||
| Labour gain from Conservative | Swing | 10.0 | |||
| Party | Candidate | Votes | % | ± | |
|---|---|---|---|---|---|
| Conservative | William Waldegrave | 22,169 | 42.2 | ||
| Liberal Democrat | Charles Boney | 16,098 | 30.7 | ||
| Labour | Hedley Bashforth | 12,992 | 24.7 | ||
| Green | George Sawday | 906 | 1.7 | ||
| Natural Law | David James Cross | 104 | 0.2 | N/A | |
| Revolutionary Communist | Ben Brent | 92 | 0.2 | N/A | |
| Struck Off and Die Doctors Alliance | Phil Hammond | 87 | 0.2 | N/A | |
| Anti-Federalist League | Timothy Hedges | 42 | 0.1 | N/A | |
| Majority | 6,071 | 11.5 | |||
| Turnout | 52,490 | 74.0 | |||
| Conservative hold | Swing | ||||
Elections in the 1980s
| Party | Candidate | Votes | % | ± | |
|---|---|---|---|---|---|
| Conservative | William Waldegrave | 24,695 | 45.5 | ||
| Liberal | George Ferguson | 16,992 | 31.3 | ||
| Labour | Mary Georghiou | 11,337 | 20.9 | ||
| Green | Gundula Dorey | 1,096 | 2.0 | N/A | |
| Communist | Veronica Ralph | 134 | 0.3 | N/A | |
| Majority | 7,703 | 14.2 | |||
| Turnout | 54,254 | 75.0 | |||
| Conservative hold | Swing | ||||
| Party | Candidate | Votes | % | ± | |
|---|---|---|---|---|---|
| Conservative | William Waldegrave | 25,400 | 49.1 | ||
| Liberal | George Ferguson | 15,222 | 29.4 | ||
| Labour | Pamela Tatlow | 10,094 | 19.5 | ||
| Ecology | James Scott | 872 | 1.7 | ||
| Independent | Sebastian Boyle | 142 | 0.3 | ||
| Majority | 10,178 | 19.7 | |||
| Turnout | 51,730 | 70.7 | |||
| Conservative hold | Swing | ||||
Elections in the 1970s
| Party | Candidate | Votes | % | ± | |
|---|---|---|---|---|---|
| Conservative | William Waldegrave | 22,257 | 52.6 | ||
| Labour | Vivien Bath | 9,691 | 22.9 | ||
| Liberal | Bernard Silver | 8,881 | 21.0 | ||
| Ecology | John K. Ingham | 1,154 | 2.7 | ||
| National Front | M. Jones | 246 | 0.6 | ||
| United Democratic Party | Raymond R. Redmore | 93 | 0.2 | ||
| Majority | 12,566 | 29.7 | |||
| Turnout | 71.6 | ||||
| Conservative hold | Swing | ||||
| Party | Candidate | Votes | % | ± | |
|---|---|---|---|---|---|
| Conservative | Robert Cooke | 18,555 | 46.9 | ||
| Liberal | Robert G.R. Stacey | 11,598 | 29.3 | ||
| Labour | John Malos | 9,372 | 23.7 | ||
| Majority | 6,957 | 17.6 | |||
| Turnout | 65.4 | ||||
| Conservative hold | Swing | ||||
| Party | Candidate | Votes | % | ± | |
|---|---|---|---|---|---|
| Conservative | Robert Cooke | 21,141 | 48.3 | ||
| Liberal | Robert G.R. Stacey | 13,076 | 29.9 | ||
| Labour | John Malos | 9,526 | 21.8 | ||
| Majority | 8,065 | 18.4 | |||
| Turnout | 72.7 | ||||
| Conservative hold | Swing | ||||
| Party | Candidate | Votes | % | ± | |
|---|---|---|---|---|---|
| Conservative | Robert Cooke | 20,110 | 60.2 | ||
| Labour | David J. Blackman | 8,175 | 24.5 | ||
| Liberal | Robert G.R. Stacey | 5,108 | 15.3 | ||
| Majority | 11,935 | 35.7 | |||
| Turnout | 66.3 | ||||
| Conservative hold | Swing | ||||
Elections in the 1960s
| Party | Candidate | Votes | % | ± | |
|---|---|---|---|---|---|
| Conservative | Robert Cooke | 19,783 | 56.7 | ||
| Labour | Leslie Walter Bosisto | 8,265 | 23.7 | ||
| Liberal | Robert G.R. Stacey | 6,850 | 19.6 | ||
| Majority | 11,518 | 33.0 | |||
| Turnout | 72.2 | ||||
| Conservative hold | Swing | ||||
| Party | Candidate | Votes | % | ± | |
|---|---|---|---|---|---|
| Conservative | Robert Cooke | 21,230 | 58.0 | ||
| Liberal | Keith Basil Wedmore | 7,366 | 20.1 | ||
| Labour | Donald McLaren | 7,306 | 20.0 | ||
| Taxpayers' Coalition Party | P. Michael Kingston | 709 | 1.9 | ||
| Majority | 13,864 | 37.9 | |||
| Turnout | 73.2 | ||||
| Conservative hold | Swing | ||||
Elections in the 1950s
| Party | Candidate | Votes | % | ± | |
|---|---|---|---|---|---|
| Conservative | Robert Cooke | 27,768 | 67.3 | ||
| Labour | Michael Cocks | 7,651 | 18.6 | ||
| Liberal | Colin Hart-Leverton | 5,835 | 14.1 | ||
| Majority | 20,117 | 48.7 | |||
| Turnout | 73.6 | ||||
| Conservative hold | Swing | ||||
| Party | Candidate | Votes | % | ± | |
|---|---|---|---|---|---|
| Conservative | Robert Cooke | 24,585 | 70.2 | ||
| Labour | Bill Rodgers | 10,423 | 29.8 | ||
| Majority | 14,162 | 40.4 | |||
| Turnout | 61.1 | ||||
| Conservative hold | Swing | ||||
| Party | Candidate | Votes | % | ± | |
|---|---|---|---|---|---|
| Conservative | Walter Monckton | 32,767 | 75.3 | ||
| Labour | Walter Johnson | 10,766 | 24.7 | ||
| Majority | 22,001 | 50.6 | |||
| Turnout | 74.6 | ||||
| Conservative hold | Swing | ||||
| Party | Candidate | Votes | % | ± | |
|---|---|---|---|---|---|
| Conservative | Walter Monckton | 25,858 | 63.6 | ||
| Labour | Harold Lawrance | 11,716 | 28.8 | ||
| Liberal | David Goldblatt | 3,115 | 7.7 | ||
| Majority | 14,142 | 34.8 | |||
| Turnout | 80.6 | ||||
| Conservative hold | Swing | ||||
| Party | Candidate | Votes | % | ± | |
|---|---|---|---|---|---|
| Conservative | Walter Monckton | 22,216 | 81.4 | ||
| Labour | Harold Lawrance | 5,072 | 18.6 | ||
| Majority | 17,144 | 62.8 | |||
| Turnout | 53.6 | ||||
| Conservative hold | Swing | ||||
| Party | Candidate | Votes | % | ± | |
|---|---|---|---|---|---|
| Conservative | Oliver Stanley | 24,920 | 58.9 | ||
| Labour | Edward S.D. Bishop | 12,677 | 30.0 | ||
| Liberal | Hilda Nuttall | 4,688 | 11.1 | ||
| Majority | 12,243 | 28.9 | |||
| Turnout | 82.4 | ||||
| Conservative hold | Swing | ||||
Elections in the 1940s
| Party | Candidate | Votes | % | ± | |
|---|---|---|---|---|---|
| Conservative | Oliver Stanley | 32,149 | 48.6 | ||
| Labour | William Edward Balmer | 25,163 | 38.0 | ||
| Liberal | Desmond Allhusen | 8,849 | 13.4 | ||
| Majority | 6,986 | 10.6 | |||
| Turnout | 74.7 | ||||
| Conservative hold | Swing | ||||
Elections in the 1930s
| Party | Candidate | Votes | % | ± | |
|---|---|---|---|---|---|
| Conservative | Cyril Culverwell | 36,820 | 71.0 | ||
| Labour | Percy Williams | 15,058 | 29.0 | ||
| Majority | 21,762 | 42.0 | |||
| Turnout | 70.8 | ||||
| Conservative hold | Swing | ||||
| Party | Candidate | Votes | % | ± | |
|---|---|---|---|---|---|
| Conservative | Cyril Culverwell | 43,264 | 83.0 | ||
| Labour | F.E. White | 8,875 | 17.0 | ||
| Majority | 34,389 | 66.0 | |||
| Turnout | 79.3 | ||||
| Conservative hold | Swing | ||||
Elections in the 1920s
| Party | Candidate | Votes | % | ± | |
|---|---|---|---|---|---|
| Unionist | Cyril Culverwell | 25,416 | 53.7 | −25.3 | |
| Labour | Clare Annesley | 11,961 | 25.3 | +4.3 | |
| Liberal | William Nichols Marcy | 9,909 | 21.0 | N/A | |
| Majority | 13,455 | 28.4 | −29.6 | ||
| Turnout | 47,286 | 77.7 | +2.6 | ||
| Registered electors | 60,844 | ||||
| Unionist hold | Swing | −14.8 | |||
| Party | Candidate | Votes | % | ± | |
|---|---|---|---|---|---|
| Unionist | Cyril Culverwell | 16,970 | 57.2 | −21.8 | |
| Labour | Clare Annesley | 7,702 | 26.0 | +5.0 | |
| Liberal | William Nichols Marcy | 4,996 | 16.8 | N/A | |
| Majority | 9,268 | 31.2 | −26.8 | ||
| Turnout | 29,688 | 67.6 | −7.5 | ||
| Registered electors | 43,900 | ||||
| Unionist hold | Swing | −13.4 | |||
| Party | Candidate | Votes | % | ± | |
|---|---|---|---|---|---|
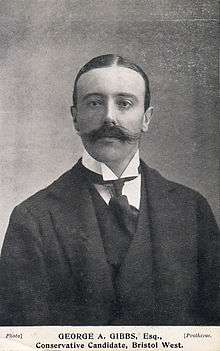
| Unionist | George Gibbs | 23,574 | 79.0 | N/A | |
| Labour | Matt Giles | 6,276 | 21.0 | N/A | |
| Majority | 17,298 | 58.0 | N/A | ||
| Turnout | 29,850 | 75.1 | N/A | ||
| Registered electors | 39,752 | ||||
| Unionist hold | Swing | N/A | |||
| Party | Candidate | Votes | % | ± | |
|---|---|---|---|---|---|
| Unionist | George Gibbs | Unopposed | |||
| Unionist hold | |||||
| Party | Candidate | Votes | % | ± | |
|---|---|---|---|---|---|
| Unionist | George Gibbs | 18,124 | 62.0 | N/A | |
| Liberal | Frank Raffety | 11,100 | 38.0 | N/A | |
| Majority | 7,024 | 24.0 | N/A | ||
| Turnout | 29,224 | 76.9 | N/A | ||
| Registered electors | 38,013 | ||||
| Unionist hold | Swing | N/A | |||
| Party | Candidate | Votes | % | ± | |
|---|---|---|---|---|---|
| C | Unionist | George Gibbs | Unopposed | ||
| Unionist hold | |||||
| C indicates candidate endorsed by the coalition government. | |||||
Elections in the 1910s
| Party | Candidate | Votes | % | ± | |
|---|---|---|---|---|---|
| C | Unionist | George Gibbs | Unopposed | ||
| Unionist hold | |||||
| C indicates candidate endorsed by the coalition government. | |||||
Election results 1885-1918
Elections in the 1880s
| Party | Candidate | Votes | % | ± | |
|---|---|---|---|---|---|
| Conservative | Michael Hicks Beach | 3,876 | 61.1 | N/A | |
| Liberal | Brinsley de Courcy Nixon | 2,463 | 38.9 | N/A | |
| Majority | 1,413 | 22.2 | N/A | ||
| Turnout | 6,339 | 82.8 | N/A | ||
| Registered electors | 7,657 | ||||
| Conservative win (new seat) | |||||
| Party | Candidate | Votes | % | ± | |
|---|---|---|---|---|---|
| Conservative | Michael Hicks Beach | 3,819 | 68.0 | ||
| Liberal | James Judd | 1,801 | 32.0 | ||
| Majority | 2,018 | 36.0 | |||
| Turnout | 5,620 | 73.4 | |||
| Registered electors | 7,657 | ||||
| Conservative hold | Swing | ||||
Hicks Beach was appointed Chief Secretary to the Lord Lieutenant of Ireland, requiring a by-election.
| Party | Candidate | Votes | % | ± | |
|---|---|---|---|---|---|
| Conservative | Michael Hicks Beach | Unopposed | |||
| Conservative hold | |||||
Hicks Beach was appointed President of the Board of Trade, requiring a by-election.
| Party | Candidate | Votes | % | ± | |
|---|---|---|---|---|---|
| Conservative | Michael Hicks Beach | Unopposed | |||
| Conservative hold | |||||
Elections in the 1890s
| Party | Candidate | Votes | % | ± | |
|---|---|---|---|---|---|
| Conservative | Michael Hicks Beach | Unopposed | |||
| Conservative hold | |||||
| Party | Candidate | Votes | % | ± | |
|---|---|---|---|---|---|
| Conservative | Michael Hicks Beach | Unopposed | |||
| Conservative hold | |||||
| Party | Candidate | Votes | % | ± | |
|---|---|---|---|---|---|
| Conservative | Michael Hicks Beach | 3,815 | 67.4 | N/A | |
| Liberal | Henry Hamilton Lawless | 1,842 | 32.6 | N/A | |
| Majority | 1,973 | 34.8 | N/A | ||
| Turnout | 5,657 | 69.5 | N/A | ||
| Registered electors | 8,144 | ||||
| Conservative hold | Swing | N/A | |||
Elections in the 1900s
| Party | Candidate | Votes | % | ± | |
|---|---|---|---|---|---|
| Conservative | Michael Hicks Beach | Unopposed | |||
| Conservative hold | |||||
| Party | Candidate | Votes | % | ± | |
|---|---|---|---|---|---|
| Conservative | George Gibbs | 4,267 | 52.2 | N/A | |
| Liberal | Thomas Lennard | 3,902 | 47.8 | N/A | |
| Majority | 365 | 4.4 | N/A | ||
| Turnout | 8,169 | 86.7 | N/A | ||
| Registered electors | 9,423 | ||||
| Conservative hold | Swing | N/A | |||
Elections in the 1910s
| Party | Candidate | Votes | % | ± | |
|---|---|---|---|---|---|
| Conservative | George Gibbs | 5,159 | 57.1 | ||
| Liberal | Walter Saise | 3,881 | 42.9 | ||
| Majority | 1,278 | 14.2 | |||
| Turnout | 9,040 | 89.3 | |||
| Registered electors | 10,127 | ||||
| Conservative hold | Swing | ||||
| Party | Candidate | Votes | % | ± | |
|---|---|---|---|---|---|
| Conservative | George Gibbs | 4,871 | 57.5 | ||
| Liberal | Joseph Weston Stevens | 3,595 | 42.5 | ||
| Majority | 1,276 | 15.0 | |||
| Turnout | 8,466 | 83.6 | |||
| Registered electors | 10,127 | ||||
| Conservative hold | Swing | ||||
General Election 1914/15:
Another General Election was required to take place before the end of 1915. The political parties had been making preparations for an election to take place and by the July 1914, the following candidates had been selected;
- Unionist: George Gibbs
- Liberal:
See also
Notes and references
- ↑ "Electorate Figures - Boundary Commission for England". 2011 Electorate Figures. Boundary Commission for England. 4 March 2011. Archived from the original on 6 November 2010. Retrieved 13 March 2011.
- 1 2 "Fifth Periodical Report" (PDF). Boundary Commission for England. 26 February 2007. Archived from the original (PDF) on 26 July 2011. Retrieved 23 October 2010.
- ↑ "University of the West of England Facts & Figures". Retrieved 28 April 2016.
- 1 2 "Election 2010: Bristol West". BBC News. BBC. 7 May 2010. Retrieved 7 May 2010.
- ↑ "UK ELECTION RESULTS". electionresults.blogspot.co.uk.
- ↑ "Bristol West". BBC News. 9 June 2017. Retrieved 10 June 2017.
- ↑ "Bristol West 1885-". Hansard. Retrieved 12 December 2015.
- ↑ "Members 1979-2010" (PDF). House of Commons Library. Retrieved 12 December 2015.
- ↑ "BBC Election Results". 9 June 2017. Retrieved 9 June 2017.
- ↑ "Election Data 2015". Electoral Calculus. Archived from the original on 17 October 2015. Retrieved 17 October 2015.
- ↑ "Politics Resources". Election 1992. Politics Resources. 9 April 1992. Retrieved 2010-12-06.
- ↑ Craig, F.W.S., ed. (1969). British parliamentary election results 1918-1949. Glasgow: Political Reference Publications. p. 109. ISBN 0-900178-01-9.
- 1 2 3 4 5 6 7 8 9 10 11 British Parliamentary Election Results 1885-1918, FWS Craig
- 1 2 3 4 5 6 7 8 The Liberal Year Book, 1907
- ↑ Debrett's House of Commons & Judicial Bench, 1886
- 1 2 Debrett's House of Commons & Judicial Bench, 1901
- ↑ Debrett's House of Commons & Judicial Bench, 1916
- ↑ Debrett's House of Commons & Judicial Bench, 1916