Hammersmith (UK Parliament constituency)
| Hammersmith | |
|---|---|
|
Borough constituency for the House of Commons | |
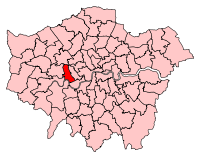 Boundary of Hammersmith in Greater London. | |
| County | Greater London |
| Electorate | 70,008 (December 2010) |
| Current constituency | |
| Created | 2010 |
| Member of parliament | Andy Slaughter (Labour) |
| Number of members | One |
| Created from | Hammersmith and Fulham & Ealing, Acton and Shepherd's Bush |
| 1983–1997 | |
| Number of members | One |
| Replaced by | Hammersmith and Fulham & Ealing, Acton and Shepherd's Bush |
| Created from | Hammersmith North |
| 1885–1918 | |
| Number of members | One |
| Replaced by | Hammersmith North, Hammersmith South |
| Created from | Chelsea |
| Overlaps | |
| European Parliament constituency | London |
Hammersmith is a constituency[n 1] in Greater London represented in the House of Commons of the UK Parliament since its 2010 recreation by Andy Slaughter of the Labour Party.[n 2]
Boundaries
Boundaries 1885–1918
The parliamentary borough of Hammersmith was created by the Redistribution of Seats Act 1885 and consisted of the civil parish of Hammersmith (in Middlesex only until 1889 when it fell within the approximately 30,000 acres (120 km2) that became part of the County of London under the Local Government Act 1888). Like almost all seats created from 1885 it returned one Member of Parliament.[1] This was the first parliamentary constituency to be based on the town, which from 1868–1885 was at the westernmost part of Chelsea and previously had been part of the parliamentary county of Middlesex. In 1900 the Metropolitan Borough of Hammersmith was formed, but this did not affect the constituency's boundaries.[2]
The seat bordered to the west the Ealing seat, to the north the large Harrow division of Middlesex seat, to the east Kensington North and Kensington South and to the south the large Kingston division of Surrey and, to the southeast, Fulham. In 1918 the Hammersmith constituency was divided into Hammersmith North and Hammersmith South constituencies.
Boundaries 1983–1997
The second parliamentary borough constituency of Hammersmith was created in 1983.[3] By then the area was part of Greater London and the London Borough of Hammersmith and Fulham (both created in 1965). The constituency consisted of ten wards of the London borough, namely Addison, Broadway, Brook Green, College Park and Old Oak, Coningham, Grove, Ravenscourt, Starch Green, White City and Shepherd's Bush, and Wormholt. The seat was entirely formed from the previous Hammersmith North constituency.
BBC Television Centre, Shepherd's Bush Market and the Hammersmith Apollo was in this version of the constituency for its 14-year existence, however Westfield London shopping centre had not yet been built.
The constituency was abolished in 1997 and mostly replaced by Hammersmith and Fulham. A northern slice of the seat became part of Ealing, Acton and Shepherd's Bush. The new Hammersmith and Fulham constituency included the town centres of both Hammersmith and Fulham.[4]
Boundaries from 2010
Following a review of parliamentary boundaries in North London, the Boundary Commission for England created a new Hammersmith constituency for the 2010 general election, following major changes in the London Borough of Hammersmith and Fulham. The review also created new seats of Chelsea and Fulham and Kensington.
The current Hammersmith constituency is made up of ten electoral wards of the London Borough of Hammersmith and Fulham:
- Addison
- Askew
- Avonmore and Brook Green
- College Park and Old Oak
- Fulham Reach
- Hammersmith Broadway
- North End
- Ravenscourt Park
- Shepherd's Bush Green
- Wormholt and White City
The 2005 notional result was Labour 44.6%, Conservative 31.1% and Liberal Democrat 19.2%.[5]
Constituency profile
The constituency includes the western part of the London Borough of Hammersmith and Fulham, stretching from Wormwood Scrubs down to the River Thames. It takes in the commercial and business hub of Hammersmith itself, parts of northwestern Fulham, the western part of Earl's Court (the Exhibition Centre itself straddles the boundary between this constituency and the Kensington seat), West Kensington, Shepherd's Bush, and White City. The seat has northern areas with a much higher proportion of social housing dependency than the London average and overall this leads to the seat having slightly higher rates of unemployment and underemployment.[6]
- Political history since 2010
The Labour Party candidate took a marginal majority of 7.5% of the vote in 2010. Slaughter's majority in 2015, 13.6%, made it the 156th safest of the party's 232 seats by percentage of majority.[7] In 2017, Slaughter increased his majority to 35.7%.
Members of Parliament
MPs 1885–1918
| Election | Member | Party | |
|---|---|---|---|
| 1885 | Walter Tuckfield Goldsworthy | Conservative | |
| 1900 | William Bull | Conservative | |
| 1918 | Constituency abolished: see Hammersmith North and Hammersmith South | ||
MPs 1983–1997
| Election | Member | Party | Notes | |
|---|---|---|---|---|
| 1983 | Clive Soley | Labour | later Baron Soley | |
| 1997 | Constituency abolished: see Hammersmith and Fulham | |||
MPs 2010–
| Election | Member | Party | Notes | |
|---|---|---|---|---|
| 2010 | Andy Slaughter | Labour | previously MP for Ealing, Acton and Shepherd's Bush 2005–2010 | |
Election Results
Election results since 2010
Elections in the 2010s
| Party | Candidate | Votes | % | ± | |
|---|---|---|---|---|---|
| Labour | Andy Slaughter | 33,375 | 63.9 | +13.9 | |
| Conservative | Charlie Dewhirst | 14,724 | 28.2 | -8.2 | |
| Liberal Democrat | Joyce Onstad | 2,802 | 5.4 | +0.7 | |
| Green | Alex Horn | 800 | 1.5 | -2.9 | |
| UKIP | Jack Bovill | 507 | 1.0 | -3.4 | |
| Independent | Jagdeosingh Hauzaree | 44 | 0.1 | +0.1 | |
| Majority | 18,651 | 35.7 | +22.1 | ||
| Turnout | 52,252 | 71.8 | +5.4 | ||
| Registered electors | 72,803 | ||||
| Labour hold | Swing | +11.0 | |||
| Party | Candidate | Votes | % | ± | |
|---|---|---|---|---|---|
| Labour | Andy Slaughter | 23,981 | 50.0 | +6.1 | |
| Conservative | Charlie Dewhirst[12] | 17,463 | 36.4 | 0.0 | |
| Liberal Democrat | Millicent Scott[13] | 2,224 | 4.6 | -11.3 | |
| Green | David Akan[14] | 2,105 | 4.4 | +2.9 | |
| UKIP | Richard Wood[15] | 2,105 | 4.4 | +3.2 | |
| Independent | Stephen Brennan | 82 | 0.2 | +0.2 | |
| Majority | 6,518 | 13.6 | +6.1 | ||
| Turnout | 47,960 | 66.4 | +0.8 | ||
| Registered electors | 72,254 | ||||
| Labour hold | Swing | +3.0 | |||
| Party | Candidate | Votes | % | ± | |
|---|---|---|---|---|---|
| Labour | Andy Slaughter* | 20,810 | 43.9 | N/A | |
| Conservative | Shaun Bailey | 17,261 | 36.4 | N/A | |
| Liberal Democrat | Merlene Emerson | 7,567 | 15.9 | N/A | |
| Green | Rollo Miles | 696 | 1.5 | N/A | |
| UKIP | Vanessa Crichton | 551 | 1.2 | N/A | |
| BNP | James Searle | 432 | 0.9 | N/A | |
| Independent | Stephen Brennan | 135 | 0.3 | N/A | |
| Majority | 3,549 | 7.5 | N/A | ||
| Turnout | 47,452 | 65.6 | N/A | ||
| Registered electors | 72,348 | ||||
| Labour win (new seat) | |||||
- * Served as an MP in the 2005–2010 Parliament for the seat of Ealing, Acton and Shepherd's Bush
Election results 1983–1992
| Party | Candidate | Votes | % | ± | |
|---|---|---|---|---|---|
| Labour | Clive Soley | 17,329 | 51.0 | +6.0 | |
| Conservative | JA Hennessy | 12,575 | 37.0 | −1.1 | |
| Liberal Democrat | JH Bates | 3,380 | 10.0 | −5.0 | |
| Green | RS Crosskey | 546 | 1.6 | +0.3 | |
| Natural Law | KA Turner | 89 | 0.3 | +0.3 | |
| Anti-Federalist League | Helen Szamuely | 41 | 0.1 | +0.1 | |
| Majority | 4,754 | 14.0 | +7.1 | ||
| Turnout | 33,960 | 71.5 | −1.3 | ||
| Registered electors | 47,229 | ||||
| Labour hold | Swing | +3.6 | |||
| Party | Candidate | Votes | % | ± | |
|---|---|---|---|---|---|
| Labour | Clive Soley | 15,811 | 45.01 | +3.54 | |
| Conservative | Nirj Deva | 13,396 | 38.14 | +2.61 | |
| Liberal | Simon Knott | 5,241 | 14.92 | +9.11 | |
| Green | David Kirk | 453 | 1.29 | +0.30 | |
| Red Front | John Fitzpatrick | 125 | 0.36 | N/A | |
| Humanist | Melanie Carrick | 98 | 0.28 | N/A | |
| Majority | 2,415 | 6.88 | +0.94 | ||
| Turnout | 35,124 | 72.74 | +1.49 | ||
| Registered electors | 48,285 | ||||
| Labour hold | Swing | ||||
| Party | Candidate | Votes | % | ± | |
|---|---|---|---|---|---|
| Labour | Clive Soley | 13,645 | 41.47 | N/A | |
| Conservative | N. Mansfield | 11,691 | 35.53 | N/A | |
| Social Democratic | M. Starks | 4,925 | 14.97 | N/A | |
| Liberal | Simon Knott | 1,912 | 5.81 | N/A | |
| Ecology | Deborah Sutherland | 325 | 0.99 | N/A | |
| National Front | L. Bennett | 250 | 0.76 | N/A | |
| Workers Revolutionary | C. Dixon | 81 | 0.25 | N/A | |
| Independent | P. Dick | 73 | 0.22 | N/A | |
| Majority | 1,954 | 5.94 | N/A | ||
| Turnout | 32,902 | 71.25 | N/A | ||
| Registered electors | 46,178 | ||||
| Labour win (new seat) | |||||
- Both Starks and Knott were official candidates of their respective local parties and both supported the Alliance between the Liberals and the SDP, however Starks was given endorsement by the both national parties.
Election Results 1885-1918
Elections in the 1910s
.jpg)
| Party | Candidate | Votes | % | ± | |
|---|---|---|---|---|---|
| Conservative | William Bull | 5,807 | 55.6 | +1.0 | |
| Liberal | George Blaiklock | 4,645 | 44.4 | -1.0 | |
| Majority | 1,162 | 11.2 | +2.0 | ||
| Turnout | 10,452 | 72.8 | -13.2 | ||
| Registered electors | 14,362 | ||||
| Conservative hold | Swing | +1.0 | |||
| Party | Candidate | Votes | % | ± | |
|---|---|---|---|---|---|
| Conservative | William Bull | 6,668 | 54.6 | +6.2 | |
| Liberal | George Blaiklock | 5,542 | 45.4 | +2.2 | |
| Majority | 1,126 | 9.2 | +4.0 | ||
| Turnout | 12,210 | 85.0 | +9.6 | ||
| Registered electors | 14,362 | ||||
| Conservative hold | Swing | +4.2 | |||
Elections in the 1900s
| Party | Candidate | Votes | % | ± | |
|---|---|---|---|---|---|
| Conservative | William Bull | 5,111 | 48.4 | -23.2 | |
| Liberal | George Blaiklock | 4,562 | 43.2 | +14.8 | |
| Independent Labour | George Belt | 885 | 8.4 | N/A | |
| Majority | 549 | 5.2 | -38.0 | ||
| Turnout | 10,558 | 75.4 | +17.0 | ||
| Registered electors | 14,007 | ||||
| Conservative hold | Swing | -19.0 | |||
| Party | Candidate | Votes | % | ± | |
|---|---|---|---|---|---|
| Conservative | William Bull | 5,458 | 71.6 | +10.8 | |
| Liberal | Michael Emil Lange | 2,166 | 28.4 | -10.8 | |
| Majority | 3,292 | 43.2 | +21.6 | ||
| Turnout | 7,624 | 58.4 | -8.3 | ||
| Registered electors | 13,064 | ||||
| Conservative hold | Swing | +10.8 | |||
Elections in the 1890s
| Party | Candidate | Votes | % | ± | |
|---|---|---|---|---|---|
| Conservative | Walter Goldsworthy | 5,017 | 60.8 | +6.7 | |
| Lib-Lab | W. C. Steadman | 3,238 | 39.2 | -6.7 | |
| Majority | 1,779 | 21.6 | +13.4 | ||
| Turnout | 8,255 | 66.7 | -3.6 | ||
| Registered electors | 12,378 | ||||
| Conservative hold | Swing | +6.7 | |||
| Party | Candidate | Votes | % | ± | |
|---|---|---|---|---|---|
| Conservative | Walter Goldsworthy | 4,387 | 54.1 | -8.7 | |
| Lib-Lab | Frank Smith | 3,718 | 45.9 | +8.7 | |
| Majority | 669 | 8.2 | -17.4 | ||
| Turnout | 8,105 | 70.3 | +4.2 | ||
| Registered electors | 11,534 | ||||
| Conservative hold | Swing | -8.7 | |||
Elections in the 1880s
| Party | Candidate | Votes | % | ± | |
|---|---|---|---|---|---|
| Conservative | Walter Goldsworthy | 3,991 | 62.8 | +4.9 | |
| Liberal | Frank Dethridge | 2,362 | 37.2 | -4.9 | |
| Majority | 1,629 | 25.6 | +9.8 | ||
| Turnout | 6,353 | 66.1 | -10.5 | ||
| Registered electors | 9,611 | ||||
| Conservative hold | Swing | +4.9 | |||
| Party | Candidate | Votes | % | ± | |
|---|---|---|---|---|---|
| Conservative | Walter Goldsworthy | 4,264 | 57.9 | N/A | |
| Liberal | Thomas Chatfeild Clarke | 3,095 | 42.1 | N/A | |
| Majority | 1,169 | 15.8 | N/A | ||
| Turnout | 7,359 | 76.6 | N/A | ||
| Registered electors | 9,611 | ||||
| Conservative win (new seat) | |||||
See also
Notes
- ↑ A borough constituency (for the purposes of election expenses and type of returning officer)
- ↑ As with all constituencies, the constituency elects one Member of Parliament (MP) by the first past the post system of election at least every five years.
References
- ↑ Redistribution of Seats Act, 1885, (48 & 49 Vict.) c. 23, Schedule 4
- ↑ F A Youngs Jr., Guide to the Local Administrative Units of England, Vol.I: Southern England, London, 1979
- ↑ The Parliamentary Constituencies (England) Order 1983 (S.I. 1983 No. 417)
- ↑ The Parliamentary Constituencies (England) Order 1995 (S.I. 1995 No. 1626)
- ↑ Hammersmith UK Polling Report
- ↑ "Local statistics - Office for National Statistics". neighbourhood.statistics.gov.uk. Archived from the original on 2003-02-11.
- ↑ List of Labour MPs elected in 2015 by % majority UK Political.info. Retrieved 2017-01-29
- ↑ "Hammersmith parliamentary constituency". BBC News.
- ↑ House Of Commons Library 2017 Election report http://researchbriefings.files.parliament.uk/documents/CBP-7979/CBP-7979.pdf] House Of Commons Library 2017 Election report Check
|url=value (help). Missing or empty|title=(help) - ↑ "Election Data 2015". Electoral Calculus. Archived from the original on 17 October 2015. Retrieved 17 October 2015.
- ↑ 3Aug15
- ↑ "HAMMERSMITH 2015". electionresults.blogspot.co.uk.
- ↑ "Archived copy". Archived from the original on 20 January 2015. Retrieved 20 January 2015.
- ↑ "Archived copy". Archived from the original on 8 January 2015. Retrieved 25 February 2015.
- ↑ "9a0". Archived from the original on 22 February 2015. Retrieved 22 February 2015.
- ↑ "Election Data 2010". Electoral Calculus. Archived from the original on 26 July 2013. Retrieved 17 October 2015.
- ↑ Election 2010 – Hammersmith BBC News
- ↑ "Election Data 1992". Electoral Calculus. Archived from the original on 15 October 2011. Retrieved 18 October 2015.
- ↑ "Politics Resources". Election 1992. Politics Resources. 9 April 1992. Retrieved 6 Dec 2010.
- ↑ "Election Data 1987". Electoral Calculus. Archived from the original on 15 October 2011. Retrieved 18 October 2015.
- ↑ "Election Data 1983". Electoral Calculus. Archived from the original on 15 October 2011. Retrieved 18 October 2015.
- 1 2 3 4 5 6 7 8 British Parliamentary Election Results 1885-1918, FWS Craig
External links
- Politics Resources (Election results from 1922 onwards)
- Electoral Calculus (Election results from 1955 onwards)
- British Parliamentary Election Results 1885–1918, compiled and edited by F.W.S. Craig (Macmillan Press 1974)
- Debrett’s Illustrated Heraldic and Biographical House of Commons and the Judicial Bench 1886
- Debrett’s House of Commons and the Judicial Bench 1901
- Debrett’s House of Commons and the Judicial Bench 1918
- Boundaries of Parliamentary Constituencies 1885–1972, compiled and edited by F.W.S. Craig (Parliamentary Reference Publications 1972)
- British Parliamentary Constituencies: A Statistical Compendium, by Ivor Crewe and Anthony Fox (Faber and Faber 1984)
- Leigh Rayment's Historical List of MPs – Constituencies beginning with "H" (part 1)