Workington (UK Parliament constituency)
Coordinates: 54°38′35″N 3°32′56″W / 54.643°N 3.549°W
| Workington | |
|---|---|
|
County constituency for the House of Commons | |
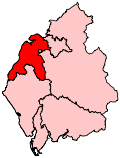 Boundary of Workington in Cumbria. | |
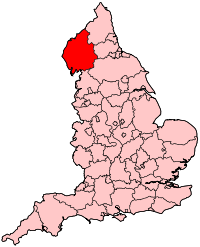 Location of Cumbria within England. | |
| County | Cumbria |
| Electorate | 59,361 (December 2010)[1] |
| Major settlements | Workington, Cockermouth, Maryport and Aspatria |
| Current constituency | |
| Created | 1918 |
| Member of parliament | Sue Hayman (Labour) |
| Number of members | One |
| Created from | Cockermouth and Eskdale |
| Overlaps | |
| European Parliament constituency | North West England |
Workington is a constituency represented in the House of Commons of the Parliament of the United Kingdom. It elects one Member of Parliament (MP) by the first-past-the-post system of election.
Boundaries
The constituency covers much of the north-west of Cumbria, corresponding largely to the Allerdale borough, except for the areas around Wigton and Keswick. As well as Workington itself, the constituency contains the towns of Cockermouth, Maryport, Aspatria and Silloth.
Boundary review
1918-1950: The Municipal Borough of Workington, the Urban Districts of Arlecdon and Frizington, Aspatria, Harrington, and Maryport, and parts of the Rural Districts of Cockermouth, Whitehaven, and Wigton.
1950-1983: The Municipal Borough of Workington, the Urban Districts of Cockermouth, Keswick, and Maryport, and the Rural District of Cockermouth.
1983-1997: The District of Allerdale wards of All Saints, Binsey, Broughton, Castle, Clifton, Crummock, Dalton, Dearham, Derwent Valley, Ellen, Ellenborough, Ewanrigg, Flimby, Harrington, Keswick, Moorclose, Netherhall, Northside, St Bridget's, St John's, St Michael's, Salterbeck, Seaton Moor, Stainburn, and Westfield.
1997-2010: All the wards of the District of Allerdale except the Marsh, Wampool, Warnell and Wigton wards.
2010-present: The Borough of Allerdale wards of All Saints, Aspatria, Boltons, Broughton St Bridget's, Christchurch, Clifton, Ellen, Ellenborough, Ewanrigg, Flimby, Harrington, Holme, Marsh, Moorclose, Moss Bay, Netherhall, St John's, St Michael's, Seaton, Silloth, Solway, Stainburn, Wampool, Waver, and Wharrels.
History
The constituency was created by the Representation of the People Act 1918, which also abolished the seat of Cockermouth. Traditionally, the constituency has supported the Labour Party, although a by-election in 1976 (forced by the elevation of Fred Peart to the House of Lords) was won by Richard Page of the Conservatives. However, the constituency reverted to type in the 1979 general election, when it was regained by Labour, who have held it ever since.
Members of Parliament
| Election | Member[2] | Party | |
|---|---|---|---|
| 1918 | Thomas Cape | Labour | |
| 1945 | Fred Peart | Labour | |
| 1976 by-election | Richard Page | Conservative | |
| 1979 | Dale Campbell-Savours | Labour | |
| 2001 | Sir Tony Cunningham | Labour | |
| 2015 | Sue Hayman | Labour | |
Elections
Elections in the 2010s
| Party | Candidate | Votes | % | ± | |
|---|---|---|---|---|---|
| Labour | Sue Hayman | 21,317 | 51.1 | +8.8 | |
| Conservative | Clark Vasey | 17,392 | 41.7 | +11.6 | |
| UKIP | George Kemp | 1,556 | 3.7 | -15.9 | |
| Liberal Democrat | Phill Roberts | 1,133 | 2.7 | -1.7 | |
| Independent | Roy Ivinson | 278 | 0.7 | N/A | |
| Majority | 3,925 | 9.4 | -2.8 | ||
| Turnout | 41,676 | 69.2 | +3.6 | ||
| Labour hold | Swing | -1.4 | |||
| Party | Candidate | Votes | % | ± | |
|---|---|---|---|---|---|
| Labour | Sue Hayman | 16,282 | 42.3 | −3.2 | |
| Conservative | Rozila Kana | 11,596 | 30.1 | −3.7 | |
| UKIP | Mark Jenkinson | 7,538 | 19.6 | +17.4 | |
| Liberal Democrat | Phill Roberts | 1,708 | 4.4 | −4.1 | |
| Green | Jill Perry | 1,149 | 3.0 | +3.0 | |
| Independent | Roy Ivinson | 190 | 0.5 | +0.5 | |
| Majority | 4,686 | 12.2 | |||
| Turnout | 38,463 | 65.6 | |||
| Labour hold | Swing | ||||
| Party | Candidate | Votes | % | ± | |
|---|---|---|---|---|---|
| Labour | Tony Cunningham | 17,865 | 45.5 | −6.5 | |
| Conservative | Judith Pattinson | 13,290 | 33.9 | +4.8 | |
| Liberal Democrat | Stan Collins | 5,318 | 13.5 | −0.9 | |
| BNP | Martin Wingfield | 1,496 | 3.8 | +3.8 | |
| UKIP | Steve Lee | 876 | 2.2 | −1.2 | |
| English Democrat | Rob Logan | 414 | 1.1 | +1.1 | |
| Majority | 4,575 | 11.7 | |||
| Turnout | 39,259 | 65.9 | +3.4 | ||
| Labour hold | Swing | −5.7 | |||
Elections in the 2000s
| Party | Candidate | Votes | % | ± | |
|---|---|---|---|---|---|
| Labour | Tony Cunningham | 19,554 | 50.5 | −5.0 | |
| Conservative | Judith Pattinson | 11,659 | 30.1 | +0.5 | |
| Liberal Democrat | Kate Clarkson | 5,815 | 15.0 | +2.5 | |
| UKIP | Mark Richardson | 1,328 | 3.4 | N/A | |
| Legalise Cannabis | John Peacock | 381 | 1.0 | −1.5 | |
| Majority | 7,895 | 20.4 | |||
| Turnout | 38,737 | 64.7 | +1.3 | ||
| Labour hold | Swing | -2.8 | |||
| Party | Candidate | Votes | % | ± | |
|---|---|---|---|---|---|
| Labour | Tony Cunningham | 23,209 | 55.5 | −8.7 | |
| Conservative | Timothy Stoddart | 12,359 | 29.6 | +5.1 | |
| Liberal Democrat | Ian Francis | 5,214 | 12.5 | +4.4 | |
| Legalise Cannabis | John Peacock | 1,040 | 2.5 | N/A | |
| Majority | 10,850 | 25.9 | |||
| Turnout | 41,822 | 63.4 | |||
| Labour hold | Swing | ||||
Elections in the 1990s
| Party | Candidate | Votes | % | ± | |
|---|---|---|---|---|---|
| Labour | Dale Campbell-Savours | 31,717 | 64.2 | +10.0 | |
| Conservative | Robert Blunden | 12,061 | 24.4 | −12.0 | |
| Liberal Democrat | Philip Roberts | 3,967 | 8.0 | +0.6 | |
| Referendum | George Donnan | 1,412 | 2.9 | N/A | |
| Independent | Chris Austin | 217 | 0.4 | N/A | |
| Majority | 19,656 | 39.8 | |||
| Turnout | 49,374 | 75.1 | -6.9 | ||
| Labour hold | Swing | ||||
| Party | Candidate | Votes | % | ± | |
|---|---|---|---|---|---|
| Labour | Dale Campbell-Savours | 26,719 | 56.9 | +4.5 | |
| Conservative | Stuart E. Sexton | 16,270 | 34.7 | −2.4 | |
| Liberal Democrat | Christine A. Neale | 3,028 | 6.5 | N/A | |
| Monster Raving Loony | David Langstaff | 755 | 1.6 | N/A | |
| Natural Law | Nicola M. Escott | 183 | 0.4 | N/A | |
| Majority | 10,449 | 22.3 | +7.0 | ||
| Turnout | 46,955 | 81.5 | +0.9 | ||
| Labour hold | Swing | +3.5 | |||
Elections in the 1980s
| Party | Candidate | Votes | % | ± | |
|---|---|---|---|---|---|
| Labour | Dale Campbell-Savours | 24,019 | 52.4 | +0.3 | |
| Conservative | Anne McIntosh | 17,000 | 37.1 | +1.0 | |
| Liberal | Greville Badger | 4,853 | 10.6 | −1.3 | |
| Majority | 7,019 | 15.3 | −0.7 | ||
| Turnout | 45,872 | 80.6 | |||
| Labour hold | Swing | ||||
| Party | Candidate | Votes | % | ± | |
|---|---|---|---|---|---|
| Labour | Dale Campbell-Savours | 23,239 | 52.0 | −1.2 | |
| Conservative | M. Smith | 16,111 | 36.1 | −4.6 | |
| Liberal | N. Blackshaw | 5,311 | 11.8 | +5.8 | |
| Majority | 7,128 | 16.0 | +3.5 | ||
| Turnout | 44,661 | 79.6 | |||
| Labour hold | Swing | +1.7 | |||
Elections in the 1970s
| Party | Candidate | Votes | % | ± | |
|---|---|---|---|---|---|
| Labour | Dale Campbell-Savours | 24,523 | 53.2 | −2.2 | |
| Conservative | Richard Page | 18,767 | 40.7 | +8.4 | |
| Liberal | N Blackshaw | 2,819 | 6.1 | −5.6 | |
| Majority | 5,756 | 12.5 | −11.3 | ||
| Turnout | 46,109 | 83.8 | |||
| Labour gain from Conservative | Swing | ||||
| Party | Candidate | Votes | % | ± | |
|---|---|---|---|---|---|
| Conservative | Richard Page | 19,396 | 48.2 | +15.9 | |
| Labour | Dale Campbell-Savours | 18,331 | 45.6 | −10.4 | |
| Liberal | Bernard Wates | 2,480 | 6.2 | −5.6 | |
| Majority | 1,065 | 2.6 | N/A | ||
| Turnout | 40,207 | ||||
| Conservative gain from Labour | Swing | +13.2 | |||
| Party | Candidate | Votes | % | ± | |
|---|---|---|---|---|---|
| Labour | Fred Peart | 22,539 | 56.0 | −3.7 | |
| Conservative | Richard Page | 12,988 | 32.3 | −8.1 | |
| Liberal | J. Burns | 4,728 | 11.8 | N/A | |
| Majority | 9,551 | 23.7 | +4.4 | ||
| Turnout | 40,255 | 75.8 | |||
| Labour hold | Swing | ||||
| Party | Candidate | Votes | % | ± | |
|---|---|---|---|---|---|
| Labour | Fred Peart | 24,000 | 60.0 | −2.0 | |
| Conservative | Richard Page | 16,230 | 40.3 | +2.0 | |
| Majority | 7,770 | 19.3 | −4.0 | ||
| Turnout | 40,230 | 76.4 | |||
| Labour hold | Swing | ||||
| Party | Candidate | Votes | % | ± | |
|---|---|---|---|---|---|
| Labour | Fred Peart | 24,975 | 61.7 | -1.6 | |
| Conservative | Michael Fernley Turner-Bridger | 15,532 | 38.3 | +1.6 | |
| Majority | 9,443 | 23.3 | -3.3 | ||
| Turnout | 40,507 | 77.4 | |||
| Labour hold | Swing | ||||
Elections in the 1960s
| Party | Candidate | Votes | % | ± | |
|---|---|---|---|---|---|
| Labour | Fred Peart | 24,981 | 63.3 | ||
| Conservative | Michael Fernley Turner-Bridger | 14,475 | 36.7 | ||
| Majority | 10,506 | 26.6 | |||
| Turnout | 80.4 | ||||
| Labour hold | Swing | ||||
| Party | Candidate | Votes | % | ± | |
|---|---|---|---|---|---|
| Labour | Fred Peart | 25,522 | 62.1 | ||
| Conservative | Harold Denman | 15,565 | 37.9 | ||
| Majority | 9,957 | 24.2 | |||
| Turnout | 83.48 | ||||
| Labour hold | Swing | ||||
Elections in the 1950s
| Party | Candidate | Votes | % | ± | |
|---|---|---|---|---|---|
| Labour | Fred Peart | 25,537 | 60.18 | ||
| Conservative | T Martin Brannan | 16,894 | 39.82 | ||
| Majority | 8,643 | 20.37 | |||
| Turnout | 85.89 | ||||
| Labour hold | Swing | ||||
| Party | Candidate | Votes | % | ± | |
|---|---|---|---|---|---|
| Labour | Fred Peart | 25,110 | 59.4 | ||
| Conservative | T Martin Brannan | 17,182 | 40.6 | ||
| Majority | 7,982 | 18.8 | |||
| Turnout | 86.14 | ||||
| Labour hold | Swing | ||||
| Party | Candidate | Votes | % | ± | |
|---|---|---|---|---|---|
| Labour | Fred Peart | 25,893 | 60.02 | ||
| Conservative | Helen Fox | 17,249 | 39.98 | ||
| Majority | 8,644 | 20.04 | |||
| Turnout | 87.53 | ||||
| Labour hold | Swing | ||||
| Party | Candidate | Votes | % | ± | |
|---|---|---|---|---|---|
| Labour | Fred Peart | 25,104 | 57.61 | ||
| Conservative | Helen Fox | 14,009 | 32.15 | ||
| Liberal | David Cedric Gwynne Sibley | 4,460 | 10.24 | ||
| Majority | 11,095 | 25.46 | |||
| Turnout | 89.44 | ||||
| Labour hold | Swing | ||||
Election in the 1940s
| Party | Candidate | Votes | % | ± | |
|---|---|---|---|---|---|
| Labour | Fred Peart | 24,876 | 72.5 | ||
| Conservative | G.C. White | 9,438 | 27.5 | ||
| Majority | 15,438 | 45.0 | |||
| Turnout | 80.7 | ||||
| Labour hold | Swing | ||||
Elections in the 1930s
| Party | Candidate | Votes | % | ± | |
|---|---|---|---|---|---|
| Labour | Thomas Cape | Unopposed | |||
| Labour hold | Swing | ||||
| Party | Candidate | Votes | % | ± | |
|---|---|---|---|---|---|
| Labour | Thomas Cape | 18,469 | 54.91 | ||
| Conservative | Christopher Lowther | 15,165 | 45.09 | ||
| Majority | 3,304 | 9.82 | |||
| Turnout | 85.91 | ||||
| Labour hold | Swing | ||||
Elections in the 1920s
| Party | Candidate | Votes | % | ± | |
|---|---|---|---|---|---|
| Labour | Thomas Cape | 20,591 | 65.2 | +9.6 | |
| Unionist | John Mellor | 10,995 | 34.8 | −9.6 | |
| Majority | 9,596 | 30.4 | +19.2 | ||
| Turnout | 31,586 | 81.2 | −3.2 | ||
| Registered electors | 38,915 | ||||
| Labour hold | Swing | +9.6 | |||
| Party | Candidate | Votes | % | ± | |
|---|---|---|---|---|---|
| Labour | Thomas Cape | 15,353 | 55.6 | −0.9 | |
| Unionist | E. Davies | 12,243 | 44.4 | +0.9 | |
| Majority | 3,110 | 11.2 | −1.8 | ||
| Turnout | 27,596 | 84.4 | +0.9 | ||
| Registered electors | 32,690 | ||||
| Labour hold | Swing | −0.9 | |||
| Party | Candidate | Votes | % | ± | |
|---|---|---|---|---|---|
| Labour | Thomas Cape | 15,296 | 56.5 | +1.8 | |
| Unionist | Lancelot Evelyn Gaunt | 11,781 | 43.5 | −1.8 | |
| Majority | 3,515 | 13.0 | +3.6 | ||
| Turnout | 27,077 | 83.5 | −0.2 | ||
| Registered electors | 32,425 | ||||
| Labour hold | Swing | +1.8 | |||
| Party | Candidate | Votes | % | ± | |
|---|---|---|---|---|---|
| Labour | Thomas Cape | 14,546 | 54.7 | +3.2 | |
| Unionist | Lancelot Evelyn Gaunt | 12,064 | 45.3 | +16.0 | |
| Majority | 2,482 | 9.4 | −12.8 | ||
| Turnout | 26,610 | 83.7 | +13.0 | ||
| Registered electors | 31,789 | ||||
| Labour hold | Swing | −6.4 | |||
Election in the 1910s
| Party | Candidate | Votes | % | ± | |
|---|---|---|---|---|---|
| Labour | Thomas Cape | 10,441 | 51.5 | N/A | |
| Unionist | D.J. Mason | 5,946 | 29.3 | N/A | |
| Liberal | Robert Strother Stewart* | 2,968 | 14.6 | N/A | |
| Independent | R. Millican | 943 | 4.6 | N/A | |
| Majority | 4,495 | 22.2 | N/A | ||
| Turnout | 20,298 | 70.7 | N/A | ||
| Registered electors | 28,691 | ||||
| Labour win (new seat) | |||||
* Stewart was endorsed by the Coalition Government but repudiated it.
See also
Notes and references
- ↑ "Electorate Figures – Boundary Commission for England". 2011 Electorate Figures. Boundary Commission for England. 4 March 2011. Archived from the original on November 6, 2010. Retrieved 13 March 2011.
- ↑ Leigh Rayment's Historical List of MPs – Constituencies beginning with "W" (part 5)
- ↑ "General election 2017: Full list of candidates". ITV News. 12 May 2017.
- ↑ "Election Data 2015". Electoral Calculus. Archived from the original on 17 October 2015. Retrieved 17 October 2015.
- ↑ "Workington". BBC News. Retrieved 11 May 2015.
- ↑ "Election Data 2010". Electoral Calculus. Archived from the original on 26 July 2013. Retrieved 17 October 2015.
- ↑ "Election Data 2005". Electoral Calculus. Archived from the original on 15 October 2011. Retrieved 18 October 2015.
- ↑ "Election Data 2001". Electoral Calculus. Archived from the original on 15 October 2011. Retrieved 18 October 2015.
- ↑ "Election Data 1997". Electoral Calculus. Archived from the original on 15 October 2011. Retrieved 18 October 2015.
- ↑ "Election Data 1992". Electoral Calculus. Archived from the original on 15 October 2011. Retrieved 18 October 2015.
- ↑ "UK General Election results April 1992". Richard Kimber's Political Science Resources. Politics Resources. 9 April 1992. Retrieved 2010-12-06.
- ↑ "Election Data 1987". Electoral Calculus. Archived from the original on 15 October 2011. Retrieved 18 October 2015.
- ↑ "Election Data 1983". Electoral Calculus. Archived from the original on 15 October 2011. Retrieved 18 October 2015.
- ↑
- ↑
- ↑
- ↑
- ↑
- ↑
- ↑ British Parliamentary Election Results 1918–1949, FWS Craig
- ↑ British Parliamentary Election Results 1918–1949, FWS Craig
- ↑ British Parliamentary Election Results 1918–1949, FWS Craig
- ↑ British Parliamentary Election Results 1918–1949, FWS Craig
- ↑ British Parliamentary Election Results 1918–1949, FWS Craig