Birmingham Selly Oak (UK Parliament constituency)
Coordinates: 52°26′N 1°56′W / 52.43°N 1.94°W
| Birmingham, Selly Oak | |
|---|---|
|
Borough constituency for the House of Commons | |
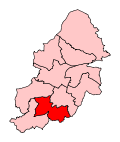 Boundary of Birmingham, Selly Oak in Birmingham. | |
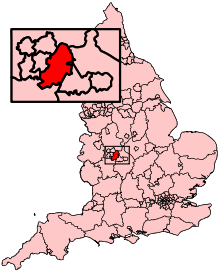 Location of Birmingham within England. | |
| County | West Midlands |
| Population | 104,067 (2011 census)[1] |
| Electorate | 75,668 (December 2010)[2] |
| Current constituency | |
| Created | 1955 |
| Member of parliament | Steve McCabe (Labour) |
| Number of members | One |
| Created from | Birmingham King's Norton, Birmingham Northfield and Birmingham Sparkbrook |
| Overlaps | |
| European Parliament constituency | West Midlands |
Birmingham, Selly Oak is a constituency[n 1] of part of the city of Birmingham represented in the House of Commons of the UK Parliament since 2010 by Steve McCabe of the Labour Party.[n 2]
Members of Parliament
| Election | Member[3] | Party | |
|---|---|---|---|
| 1955 | Harold Gurden | Conservative | |
| Oct 1974 | Tom Litterick | Labour | |
| 1979 | Anthony Beaumont-Dark | Conservative | |
| 1992 | Lynne Jones | Labour | |
| 2010 | Steve McCabe | Labour | |
Boundaries
2010–present: The City of Birmingham wards of Billesley, Bournville, Brandwood, and Selly Oak.
1983-2010: The City of Birmingham wards of Bournville, King's Norton, Moseley, and Selly Oak.
1974-1983: The County Borough of Birmingham wards of King's Norton, Moseley, and Selly Oak.
1955-1974: The County Borough of Birmingham wards of Balsall Heath, Moseley and King's Heath, and Selly Oak.
The seat includes many students and staff from the nearby University of Birmingham. Half of the University's Selly Oak campus is located within the constituency. The Cadbury factory and Cadbury World are also within its boundaries.
History
Since its creation in 1955 the seat has switched hands three times between Labour and the Conservatives. The seat has progressively swung towards Labour from being a safe Conservative seat, this has been attributed to housing redevelopments that took place in the 1960s and 1970s. More recently, it has acquired a reputation for electing outspoken MPs, first with the victory of Anthony Beaumont-Dark of the Conservatives in 1979 and then with his defeat by Lynne Jones of the Labour Party in 1992.
Elections
Elections in the 2010s
| Party | Candidate | Votes | % | ± | |
|---|---|---|---|---|---|
| Labour | Steve McCabe | 30,836 | 62.9 | ||
| Conservative | Sophie Shrubsole | 15,629 | 31.9 | ||
| Liberal Democrat | Dave Radcliffe | 1,644 | 3.4 | ||
| Green | Julien Pritchard | 876 | 1.8 | ||
| Majority | 15,207 | 31.0 | |||
| Turnout | 48,985 | 65.9 | |||
| Labour hold | Swing | ||||
| Party | Candidate | Votes | % | ± | |
|---|---|---|---|---|---|
| Labour | Steve McCabe | 21,584 | 47.7 | ||
| Conservative | Alex Boulter | 13,137 | 29.0 | ||
| UKIP | Steven Brookes | 5,755 | 12.7 | ||
| Liberal Democrat | Colin Green | 2,517 | 5.6 | ||
| Green | Clare Thomas | 2,301 | 5.1 | ||
| Majority | 8,447 | 18.6 | |||
| Turnout | 45,294 | 60.3 | |||
| Labour hold | Swing | ||||
| Party | Candidate | Votes | % | ± | |
|---|---|---|---|---|---|
| Labour | Steve McCabe | 17,950 | 38.5 | ||
| Conservative | Nigel Dawkins | 14,468 | 31.1 | ||
| Liberal Democrat | Dave Radcliffe | 10,371 | 22.3 | ||
| BNP | Lynette Orton | 1,820 | 3.9 | N/A | |
| UKIP | Jeffrey Burgess | 1,131 | 2.4 | ||
| Green | James Burn | 664 | 1.4 | ||
| Christian | Samuel Leeds | 159 | 0.3 | N/A | |
| Majority | 3,482 | 7.5 | |||
| Turnout | 46,563 | 62.2 | |||
| Labour hold | Swing | ||||
Elections in the 2000s
| Party | Candidate | Votes | % | ± | |
|---|---|---|---|---|---|
| Labour | Lynne Jones | 19,226 | 46.1 | ||
| Conservative | Joe Tildesley | 10,375 | 24.9 | ||
| Liberal Democrat | Richard Brighton | 9,591 | 23.0 | ||
| Green | Barney Smith | 1,581 | 3.8 | ||
| UKIP | Ronan Burnett | 967 | 2.3 | ||
| Majority | 8,851 | 21.2 | |||
| Turnout | 41,740 | 59.5 | |||
| Labour hold | Swing | ||||
| Party | Candidate | Votes | % | ± | |
|---|---|---|---|---|---|
| Labour | Lynne Jones | 21,015 | 52.4 | ||
| Conservative | Kenneth Hardeman | 10,676 | 26.6 | ||
| Liberal Democrat | David Osborne | 6,532 | 16.3 | ||
| Green | Barney Smith | 1,309 | 3.3 | N/A | |
| UKIP | Sheila Williams | 568 | 1.4 | N/A | |
| Majority | 10,339 | 25.8 | N/A | ||
| Turnout | 40,100 | 56.3 | |||
| Labour hold | Swing | ||||
Elections in the 1990s
| Party | Candidate | Votes | % | ± | |
|---|---|---|---|---|---|
| Labour | Lynne Jones | 28,121 | 55.6 | ||
| Conservative | Graham Greene | 14,033 | 27.8 | ||
| Liberal Democrat | David Osborne | 6,121 | 12.1 | ||
| Referendum | Laurence Marshall | 1,520 | 3.0 | N/A | |
| ProLife Alliance | Greg Gardner | 417 | 0.8 | N/A | |
| Monster Raving Loony | Peter Sheriff-Knowles | 253 | 0.5 | N/A | |
| Natural Law | Huw Meads | 85 | 0.5 | ||
| Majority | 14,088 | 27.9 | |||
| Turnout | 50,550 | 70.1 | |||
| Labour hold | Swing | ||||
| Party | Candidate | Votes | % | ± | |
|---|---|---|---|---|---|
| Labour | Lynne Jones | 25,430 | 46.0 | ||
| Conservative | Anthony Beaumont-Dark | 23,370 | 42.3 | ||
| Liberal Democrat | David Osborne | 5,679 | 10.3 | N/A | |
| Green | Paul Slatter | 535 | 1.0 | ||
| Natural Law | Christopher Barwood | 178 | 0.3 | N/A | |
| Revolutionary Communist | Kenan Malik | 84 | 0.2 | N/A | |
| Majority | 2,060 | 3.7 | |||
| Turnout | 55,276 | 76.6 | |||
| Labour gain from Conservative | Swing | ||||
Elections in the 1980s
| Party | Candidate | Votes | % | ± | |
|---|---|---|---|---|---|
| Conservative | Anthony Beaumont-Dark | 23,305 | 44.2 | ||
| Labour | Albert Bore | 20,721 | 39.3 | ||
| Liberal | Charlotte Cane | 8,128 | 15.4 | N/A | |
| Green | Winifred Hackett | 611 | 1.1 | N/A | |
| Majority | 2,584 | 4.9 | |||
| Turnout | 52,765 | 73.1 | |||
| Conservative hold | Swing | ||||
| Party | Candidate | Votes | % | ± | |
|---|---|---|---|---|---|
| Conservative | Anthony Beaumont-Dark | 23,008 | 44.9 | ||
| Labour | John Turner | 17,612 | 34.4 | ||
| Social Democratic | Kevin Wheldall | 10,613 | 20.7 | N/A | |
| Majority | 5,396 | 10.5 | |||
| Turnout | 51,233 | 71.5 | |||
| Conservative hold | Swing | ||||
Elections in the 1970s
| Party | Candidate | Votes | % | ± | |
|---|---|---|---|---|---|
| Conservative | Anthony Beaumont-Dark | 23,175 | 48.7 | ||
| Labour | Tom Litterick | 18,400 | 38.6 | ||
| Liberal | Paul Rowntree Clifford | 5,452 | 11.4 | ||
| National Front | George Bassett | 401 | 0.8 | N/A | |
| Child and Family Protection Group | Philip James Seymour Crome | 190 | 0.4 | N/A | |
| Majority | 4,775 | 10.1 | |||
| Turnout | 47,618 | 73.7 | |||
| Conservative gain from Labour | Swing | 4.3 | |||
| Party | Candidate | Votes | % | ± | |
|---|---|---|---|---|---|
| Labour | Tom Litterick | 17,320 | 41.1 | ||
| Conservative | Harold Gurden | 16,994 | 40.3 | ||
| Liberal | Roger Austin Grant | 7,850 | 18.6 | ||
| Majority | 326 | 0.8 | |||
| Turnout | 42,164 | 67.2 | |||
| Labour gain from Conservative | Swing | ||||
| Party | Candidate | Votes | % | ± | |
|---|---|---|---|---|---|
| Conservative | Harold Gurden | 19,705 | 42.6 | ||
| Labour | Tom Litterick | 16,823 | 36.4 | ||
| Liberal | Roger Austin Grant | 9,718 | 21.0 | N/A | |
| Majority | 2,882 | 6.2 | |||
| Turnout | 46,246 | 74.2 | |||
| Conservative hold | Swing | ||||
| Party | Candidate | Votes | % | ± | |
|---|---|---|---|---|---|
| Conservative | Harold Gurden | 18,281 | 52.2 | ||
| Labour | Michael John Hartley-Brewer | 16,758 | 47.8 | ||
| Majority | 1,523 | 4.4 | |||
| Turnout | 35,039 | 64.0 | |||
| Conservative hold | Swing | ||||
Elections in the 1960s
| Party | Candidate | Votes | % | ± | |
|---|---|---|---|---|---|
| Conservative | Harold Gurden | 16,533 | 45.1 | ||
| Labour | John Garwell | 15,756 | 43.0 | ||
| Liberal | Roy Lewthwaite | 4,333 | 11.8 | N/A | |
| Majority | 777 | 2.1 | |||
| Turnout | 36,622 | 66.4 | |||
| Conservative hold | Swing | ||||
| Party | Candidate | Votes | % | ± | |
|---|---|---|---|---|---|
| Conservative | Harold Gurden | 21,443 | 56.9 | ||
| Labour | John Garwell | 16,232 | 43.1 | ||
| Majority | 5,211 | 13.8 | |||
| Turnout | 37,675 | 66.3 | |||
| Conservative hold | Swing | ||||
Elections in the 1950s
| Party | Candidate | Votes | % | ± | |
|---|---|---|---|---|---|
| Conservative | Harold Gurden | 24,950 | 60.1 | ||
| Labour | J Oliver Rhydderch | 16,594 | 39.9 | ||
| Majority | 8,356 | 20.1 | |||
| Turnout | 41,544 | 71.6 | |||
| Conservative hold | Swing | ||||
| Party | Candidate | Votes | % | ± | |
|---|---|---|---|---|---|
| Conservative | Harold Gurden | 25,774 | 57.5 | N/A | |
| Labour | Harry Watton | 19,054 | 42.5 | N/A | |
| Majority | 6,720 | 15.0 | N/A | ||
| Turnout | 44,828 | 74.3 | N/A | ||
| Conservative win (new seat) | |||||
See also
Notes and references
- Notes
- ↑ A borough constituency (for the purposes of election expenses and type of returning officer)
- ↑ As with all constituencies, the constituency elects one Member of Parliament (MP) by the first past the post system of election at least every five years.
- References
- ↑ "Birmingham, Selly Oak: Usual Resident Population, 2011". Neighbourhood Statistics. Office for National Statistics. Retrieved 30 January 2015.
- ↑ "Electorate Figures - Boundary Commission for England". 2011 Electorate Figures. Boundary Commission for England. 4 March 2011. Archived from the original on 6 November 2010. Retrieved 13 March 2011.
- ↑ Leigh Rayment's Historical List of MPs – Constituencies beginning with "S" (part 2)
- ↑ "Statement of Persons Nominated and notice of poll". Birmingham City Council. Retrieved 11 May 2017.
- ↑ "Birmingham Selly Oak". BBC News. Retrieved 9 June 2017.
- ↑ "Election Data 2015". Electoral Calculus. Archived from the original on 17 October 2015. Retrieved 17 October 2015.
- ↑ "Alex Boulter". Conservatives. Archived from the original on 26 November 2014. Retrieved 20 January 2015.
- ↑ "Election Data 2010". Electoral Calculus. Archived from the original on 26 July 2013. Retrieved 17 October 2015.
- ↑ Statement of Persons Nominated and Notice of Poll 2010
- ↑ Birmingham City Council: General Election 2010 Archived 2010-05-08 at the Wayback Machine.
- ↑ "Election Data 2005". Electoral Calculus. Archived from the original on 15 October 2011. Retrieved 18 October 2015.
- ↑ "Election Data 2001". Electoral Calculus. Archived from the original on 15 October 2011. Retrieved 18 October 2015.
- ↑ "Election Data 1997". Electoral Calculus. Archived from the original on 15 October 2011. Retrieved 18 October 2015.
- ↑ "Election Data 1992". Electoral Calculus. Archived from the original on 15 October 2011. Retrieved 18 October 2015.
- ↑ "UK General Election results April 1992". Richard Kimber's Political Science Resources. Politics Resources. 9 April 1992. Retrieved 2010-12-06.
- ↑ "Election Data 1987". Electoral Calculus. Archived from the original on 15 October 2011. Retrieved 18 October 2015.
- ↑ "Election Data 1983". Electoral Calculus. Archived from the original on 15 October 2011. Retrieved 18 October 2015.
- ↑
- ↑
- ↑