Easington (UK Parliament constituency)
Coordinates: 54°47′24″N 1°21′07″W / 54.790°N 1.352°W
| Easington | |
|---|---|
|
County constituency for the House of Commons | |
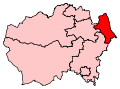 Boundary of Easington in County Durham. | |
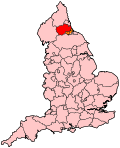 Location of County Durham within England. | |
| County | County Durham |
| Electorate | 65,618 (December 2010)[1] |
| Current constituency | |
| Created | 1950 |
| Member of parliament | Grahame Morris (Labour) |
| Number of members | One |
| Created from | Seaham |
| Overlaps | |
| European Parliament constituency | North East England |
Easington is a constituency[n 1] created in 1950 represented in the House of Commons of the UK Parliament since 2010 by Grahame Morris of the Labour Party.[n 2]
Constituency profile
Constituents' occupations include to a significant degree agriculture and the service sector, however the area was formerly heavily economically supported by the mining of coal, iron ore and businesses in the county still extract gangue minerals in present mining, such as fluorspar for the smelting of aluminium, to the south in the county is Darlington, which has particular strengths in international transport construction, including bridges. To the north is the large city of Sunderland which has a large service sector.
History
- Creation
Following their review the Boundary Commission for England created the political division. It chiefly replaced the bulk or all of the Seaham seat.
- Results of the winning party
The area has been held by the Labour Party since the 1922 election (including predecessor seat), when the seat was held by the party leader and Prime Minister Ramsay MacDonald. Labour's majority in the seat has never fallen below 33%(the result in the party's 1983 landslide defeat) in its history, and has only been below 40% twice (in 1979 and 1983). The 2015 result made the seat the 27th safest of Labour's 232 seats by percentage of majority.[2]
- Results of other parties
The 2015 general election saw (with +18.7%) more than the national average swing (+9.5%) to UKIP. The Conservative Party last fielded a candidate taking second place in 2001. Labour's candidate won more than threefold the UKIP votes in 2015, scoring 61% whereas UKIP polled the strongest second-place since 1983. 2017 saw the UKIP vote collapse and the Conservative vote rise, although a slight rise in the Labour vote ensured the majority remained above 40%.
- Turnout
Turnout has ranged from 87.7% in 1950 to 52.1% in 2005. Turnout has been somewhat inconsistent with national averages, falling in 1992 and 2005 when national turnout increased.
Boundaries
1950-1974: The Rural District of Easington.
1974-1983: The Rural District of Stockton, and in the Rural District of Easington the parishes of Castle Eden, Easington, Haswell, Hawthorn, Horden, Hutton Henry, Monk Hesleden, Nesbitt, Peterlee, Sheraton with Hulam, Shotton, Thornley, and Wingate.
1983-2010: The District of Easington wards of Acre Rigg, Blackhalls, Dawdon, Dene House, Deneside, Easington Colliery, Easington Village, Eden Hill, Haswell, High Colliery, Horden North, Horden South, Howletch, Murton East, Murton West, Park, Passfield, Seaham, Shotton, South, and South Hetton.
2010-present: The District of Easington wards of Acre Rigg, Blackhalls, Dawdon, Dene House, Deneside, Easington Colliery, Easington Village and South Hetton, Eden Hill, Haswell and Shotton, Horden North, Horden South, Howletch, Hutton Henry, Murton East, Murton West, Passfield, Seaham Harbour, and Seaham North.
The constituency comprises the majority of the district of the same name, which takes in the coastal portion of the administrative county of Durham. The principal towns are Peterlee and Seaham. A seat of former mining traditions, it is one of Labour's safest in Britain — party firebrand Manny Shinwell was MP for 20 years.
Boundary review
Following their review of parliamentary representation in County Durham, the Boundary Commission for England has made only minor changes to the boundaries of Easington constituency (on the southern part of the boundary with Sedgefield constituency). It was first fought at the 2010 general election.
Members of Parliament
| Election | Member[3] | Party | |
|---|---|---|---|
| 1950 | Manny Shinwell | Labour | |
| 1970 | Jack Dormand | Labour | |
| 1987 | John Cummings | Labour | |
| 2010 | Grahame Morris | Labour | |
Elections
Elections in the 2010s
| Party | Candidate | Votes | % | ± | |
|---|---|---|---|---|---|
| Labour | Grahame Morris | 23,152 | 63.7 | +2.6 | |
| Conservative | Barney Campbell | 8,260 | 22.7 | +9.8 | |
| North East Party | Susan McDonnell | 2,355 | 6.6 | +4.1 | |
| UKIP | Allyn Roberts | 1,727 | 4.7 | -14.0 | |
| Liberal Democrat | Tom Hancock | 460 | 1.3 | -1.1 | |
| Green | Martie Warin | 410 | 1.1 | -1.0 | |
| Majority | 14,892 | 41.0 | -1.3 | ||
| Turnout | 36,364 | 58.4 | +2.3 | ||
| Labour hold | Swing | -3.6 | |||
| Party | Candidate | Votes | % | ± | |
|---|---|---|---|---|---|
| Labour | Grahame Morris | 21,132 | 61.0 | +2.1 | |
| UKIP | Jonathan Arnott | 6,491 | 18.7 | +14.1 | |
| Conservative | Chris Hampsheir | 4,478 | 12.9 | -0.8 | |
| Liberal Democrat | Luke Armstrong | 834 | 2.4 | -13.6 | |
| North East Party | Susan McDonnell[5] | 810 | 2.3 | N/A | |
| Green | Martie Warin | 733 | 2.1 | N/A | |
| Socialist (GB) | Steve Colborn [6] | 146 | 0.4 | N/A | |
| Majority | 14,641 | 42.3 | -0.6 | ||
| Turnout | 34,624 | 56.1 | +1.4 | ||
| Labour hold | Swing | -6.0 | |||
| Party | Candidate | Votes | % | ± | |
|---|---|---|---|---|---|
| Labour | Grahame Morris | 20,579 | 58.9 | −12.4 | |
| Liberal Democrat | Tara Saville | 5,597 | 16.0 | +3.1 | |
| Conservative | Richard Harrison | 4,790 | 13.7 | +3.0 | |
| BNP | Cheryl Dunn | 2,317 | 6.6 | +3.4 | |
| UKIP | Martyn Aiken | 1,631 | 4.7 | +4.7 | |
| Majority | 14,982 | 42.9 | -15.6 | ||
| Turnout | 34,914 | 54.7 | +2.8 | ||
| Labour hold | Swing | −7.7 | |||
Elections in the 2000s
| Party | Candidate | Votes | % | ± | |
|---|---|---|---|---|---|
| Labour | John Cummings | 22,733 | 71.4 | −5.4 | |
| Liberal Democrat | Christopher Ord | 4,097 | 12.9 | +2.6 | |
| Conservative | Lucille Nicholson | 3,400 | 10.7 | +0.4 | |
| BNP | Ian McDonald | 1,042 | 3.3 | +3.3 | |
| Socialist Labour | Dave Robinson | 583 | 1.8 | −0.7 | |
| Majority | 18,636 | 58.5 | |||
| Turnout | 31,855 | 52.1 | −1.5 | ||
| Labour hold | Swing | −4.0 | |||
| Party | Candidate | Votes | % | ± | |
|---|---|---|---|---|---|
| Labour | John Cummings | 25,360 | 76.8 | −3.4 | |
| Conservative | Philip F. Lovel | 3,411 | 10.3 | +1.8 | |
| Liberal Democrat | Christopher J. Ord | 3,408 | 10.3 | +3.1 | |
| Socialist Labour | Dave Robinson | 831 | 2.5 | N/A | |
| Majority | 21,949 | 66.5 | |||
| Turnout | 33,010 | 53.6 | −13.4 | ||
| Labour hold | Swing | ||||
Elections in the 1990s
| Party | Candidate | Votes | % | ± | |
|---|---|---|---|---|---|
| Labour | John Cummings | 33,600 | 80.2 | +7.5 | |
| Conservative | Jason D. Hollands | 3,588 | 8.6 | −8.1 | |
| Liberal Democrat | Jim P. Heppell | 3,025 | 7.2 | −3.4 | |
| Referendum | Richard B. Pulfrey | 1,179 | 2.8 | N/A | |
| Socialist (GB) | Steve P. Colborn | 503 | 1.2 | N/A | |
| Majority | 30,012 | 71.6 | |||
| Turnout | 41,895 | 67.0 | |||
| Labour hold | Swing | +7.8 | |||
| Party | Candidate | Votes | % | ± | |
|---|---|---|---|---|---|
| Labour | John Cummings | 34,269 | 72.7 | +4.6 | |
| Conservative | William Perry | 7,879 | 16.7 | +0.4 | |
| Liberal Democrat | Peter Freitag | 5,001 | 10.6 | −5.0 | |
| Majority | 26,390 | 56.0 | +4.2 | ||
| Turnout | 47,149 | 72.5 | −0.9 | ||
| Labour hold | Swing | +2.1 | |||
Elections in the 1980s
| Party | Candidate | Votes | % | ± | |
|---|---|---|---|---|---|
| Labour | John Cummings | 32,396 | 68.06 | ||
| Conservative | William Perry | 7,757 | 16.30 | ||
| Liberal | George Howard | 7,447 | 15.64 | ||
| Majority | 24,639 | 51.76 | |||
| Turnout | 73.39 | ||||
| Labour hold | Swing | ||||
| Party | Candidate | Votes | % | ± | |
|---|---|---|---|---|---|
| Labour | Jack Dormand | 25,912 | 59.39 | ||
| Liberal | F.E. Patterson | 11,120 | 25.06 | ||
| Conservative | Colin J. Coulson-Thomas | 7,342 | 16.55 | ||
| Majority | 14,792 | 33.33 | |||
| Turnout | 67.51 | ||||
| Labour hold | Swing | ||||
Elections in the 1970s
| Party | Candidate | Votes | % | ± | |
|---|---|---|---|---|---|
| Labour | Jack Dormand | 29,537 | 60.60 | ||
| Conservative | J.S. Smailes | 11,981 | 24.70 | ||
| Liberal | V. Morley | 6,979 | 14.39 | ||
| Majority | 17,556 | 36.20 | |||
| Turnout | 74.33 | ||||
| Labour hold | Swing | ||||
| Party | Candidate | Votes | % | ± | |
|---|---|---|---|---|---|
| Labour | Jack Dormand | 28,984 | 65.82 | ||
| Conservative | J.S. Smailes | 8,047 | 18.27 | ||
| Liberal | N.J. Scaggs | 7,005 | 15.91 | ||
| Majority | 20,937 | 47.55 | |||
| Turnout | 69.01 | ||||
| Labour hold | Swing | ||||
| Party | Candidate | Votes | % | ± | |
|---|---|---|---|---|---|
| Labour | Jack Dormand | 33,637 | 71.96 | ||
| Conservative | J.S. Smailes | 13,107 | 28.04 | ||
| Majority | 20,530 | 43.92 | |||
| Turnout | 73.95 | ||||
| Labour hold | Swing | ||||
| Party | Candidate | Votes | % | ± | |
|---|---|---|---|---|---|
| Labour | Jack Dormand | 33,418 | 79.80 | ||
| Conservative | Michael Spicer | 8,457 | 20.20 | ||
| Majority | 24,961 | 59.61 | |||
| Turnout | 69.28 | ||||
| Labour hold | Swing | ||||
Elections in the 1960s
| Party | Candidate | Votes | % | ± | |
|---|---|---|---|---|---|
| Labour | Manny Shinwell | 32,097 | 81.37 | ||
| Conservative | Michael Spicer | 7,350 | 18.63 | ||
| Majority | 24,747 | 62.73 | |||
| Turnout | 70.54 | ||||
| Labour hold | Swing | ||||
| Party | Candidate | Votes | % | ± | |
|---|---|---|---|---|---|
| Labour | Manny Shinwell | 34,028 | 80.45 | ||
| Conservative | George W Rossiter | 8,270 | 19.55 | ||
| Majority | 25,758 | 60.90 | |||
| Turnout | 75.22 | ||||
| Labour hold | Swing | ||||
Elections in the 1950s
| Party | Candidate | Votes | % | ± | |
|---|---|---|---|---|---|
| Labour | Manny Shinwell | 36,552 | 79.79 | ||
| Conservative | George W Rossiter | 9,259 | 20.21 | ||
| Majority | 27,293 | 59.58 | |||
| Turnout | 80.81 | ||||
| Labour hold | Swing | ||||
| Party | Candidate | Votes | % | ± | |
|---|---|---|---|---|---|
| Labour | Manny Shinwell | 34,352 | 79.07 | ||
| Conservative | George W Rossiter | 9,095 | 20.93 | ||
| Majority | 25,257 | 58.13 | |||
| Turnout | 79.36 | ||||
| Labour hold | Swing | ||||
| Party | Candidate | Votes | % | ± | |
|---|---|---|---|---|---|
| Labour | Manny Shinwell | 37,899 | 80.77 | ||
| Conservative | George W Rossiter | 9,025 | 19.23 | ||
| Majority | 28,874 | 61.53 | |||
| Turnout | 86.74 | ||||
| Labour hold | Swing | ||||
| Party | Candidate | Votes | % | ± | |
|---|---|---|---|---|---|
| Labour | Manny Shinwell | 38,367 | 81.05 | ||
| Conservative | C.A. Macfarlane | 8,972 | 18.95 | ||
| Majority | 29,395 | 62.09 | |||
| Turnout | 87.69 | ||||
| Labour hold | Swing | ||||
See also
Notes and references
- Notes
- ↑ A county constituency (for the purposes of election expenses and type of returning officer)
- ↑ As with all constituencies, the constituency elects one Member of Parliament (MP) by the first past the post system of election at least every five years.
- References
- ↑ "Electorate Figures - Boundary Commission for England". 2011 Electorate Figures. Boundary Commission for England. 4 March 2011. Archived from the original on 6 November 2010. Retrieved 13 March 2011.
- ↑ List of Labour MPs elected in 2015 by % majority UK Political.info. Retrieved 2017-01-29
- ↑ Leigh Rayment's Historical List of MPs – Constituencies beginning with "E" (part 1)
- ↑ "Election Data 2015". Electoral Calculus. Archived from the original on 17 October 2015. Retrieved 17 October 2015.
- ↑ "New political party the North East Party launches its first ever manifesto". Chronicle Live. 29 January 2015. Retrieved 21 February 2015.
- ↑ http://www.worldsocialism.org/spgb/forum/world-socialist-movement/general-election-news-release
- ↑ "Election Data 2010". Electoral Calculus. Archived from the original on 26 July 2013. Retrieved 17 October 2015.
- ↑ http://www.durham.gov.uk/PDFApproved/ParliamentaryElection2010_SoPN_EAS.pdf
- ↑ "BBC NEWS – Election 2010 – Easington". BBC News.
- ↑ "Election Data 2005". Electoral Calculus. Archived from the original on 15 October 2011. Retrieved 18 October 2015.
- ↑ "Election Data 2001". Electoral Calculus. Archived from the original on 15 October 2011. Retrieved 18 October 2015.
- ↑ "Election Data 1997". Electoral Calculus. Archived from the original on 15 October 2011. Retrieved 18 October 2015.
- ↑ "Easington: Constituency - Politics - The Guardian". Retrieved 2013-01-22.
- ↑ "Election Data 1992". Electoral Calculus. Archived from the original on 15 October 2011. Retrieved 18 October 2015.
- ↑ "Politics Resources". Election 1992. Politics Resources. 9 April 1992. Retrieved 2010-12-06.
- ↑ "Election Data 1987". Electoral Calculus. Archived from the original on 15 October 2011. Retrieved 18 October 2015.
- ↑ "Election Data 1983". Electoral Calculus. Archived from the original on 15 October 2011. Retrieved 18 October 2015.
- ↑