Birkenhead (UK Parliament constituency)
| Birkenhead | |
|---|---|
|
Borough constituency for the House of Commons | |
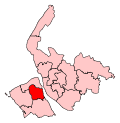 Boundary of Birkenhead in Merseyside. | |
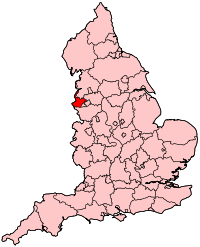 Location of Merseyside within England. | |
| County | 1861–1918 Cheshire 1950–1974 Cheshire 1974– Merseyside |
| Population | 88,818 (2011 census)[1] |
| Electorate | 62,432 (December 2010)[2] |
| Major settlements | Birkenhead |
| Current constituency | |
| Created | 1950 |
| Member of parliament | Frank Field (Independent (Labour 1979-2018)) |
| Number of members | One |
| Created from | Birkenhead East, Birkenhead West |
| 1861–1918 | |
| Type of constituency | Borough constituency |
| Replaced by | Birkenhead East, Birkenhead West |
| Created from | South Cheshire |
| Overlaps | |
| European Parliament constituency | North West England |
Birkenhead /ˈbɜːrkənˌhɛd/ is a constituency recreated in 1950 represented in the House of Commons of the UK Parliament since 1979 by Frank Field, who currently sits as an independent MP, having previously been a member of the Parliamentary Labour Party until 30th August 2018.[n 1] A former constituency of the same name existed from 1861-1918. In the intervening years, the area on the Liverpool-facing side of the Wirral Peninsula was split in two and joined with other land which had become more developed.
Profile
Birkenhead forms the relatively densely populated mid-east of four parliamentary constituencies within the Metropolitan Borough of Wirral, itself a major contributor to (and the ex-Cheshire part of) the Metropolitan County of Merseyside envisioned in 1958 and created in 1974,[3] considered as any other county (albeit with very limited powers and no elected councillors) for the enacted purposes of the Boundary Commission in its periodic reports.[4]
The urban parts of the town unite with Liverpool on the opposite side of the narrows of the estuary in having an early socially reformist movement in local measures and its choice of many elected representatives since the 1850s. The work was evidence in the building of large public buildings and institutions and the creation of supported workers' housing, creating Port Sunlight to the south among other such estates. The southern border of the Borough controversially avoids the near-circular suburbs of the cathedral city of Chester, thereby creating a jagged boundary in local and national government; nonetheless the Wirral has scenic shores and large golf courses including to the west one which regularly hosts The Open. Transcending the dense 20th century urban-semi-rural divide of Merseyside is the largely Victorian era-built town of Birkenhead, at the centre of which lies the archetype of city parks, Birkenhead Park, a social gift and early publicly subscribed community asset in the area.
The seat is almost square and bounded by it's sole motorway to the west. Its homes were (at the 2011 UK Census) 53% owner-occupied compared to 60% in the region. The seat's entirely left-wing victories nationally since 1945 evidence commitment locally to public services and wealth redistribution instead of laissez-faire economics and low taxation. The 2015 general election result made the seat the fifteenth-safest of Labour's 232 seats by percentage of majority.[5]
History
- Creation, abolition and recreation
Birkenhead was enfranchised in 1861 by the Birkenhead Enfranchisement Act 1861[6] and was a single constituency until it was split under the terms of the Representation of the People Act 1918 which took effect for the 1918 general election.
Birkenhead East and West covered the former area between 1918-1950 and smaller neighbouring communities in The Wirral.
The single constituency on revised boundaries was re-established at the 1950 general election.
Political history
- 1861-1918
The seat's elections were won by Conservatives with one exception, the 1906 landslide victory for the Liberal Party.
- During splitting (disbandment)
The two seats alternated frequently between the three largest parties in the 1920s, before the 1931 and 1935 general elections, which saw a major Conservative and Unionist Party victory (standing as Unionist in this area) in Birkenhead West, the latter election heralding a ten-year Parliament. However, the Liberal Graham White, of the more radical faction, won the eastern seat at both elections, echoing his victory in 1922. Having had predominantly marginal majorities, the seats were firmly won by the Labour Party in their nationwide landslide victory of 1945.
- Since 1950 re-creation
Since 1950, Birkenhead has returned Labour MPs each winning large majorities — apart from a 7% majority in 1955. Further to the left, two Communist candidates, including Barry Williams stood between 1950-1970 obtaining a high point of 1.5% of the votes cast during the Cold War.
Frank Field, who has represented the constituency since 1979, was immediately appointed as the Blair ministry's Welfare Reform Minister for one year and has chaired the related Work and Pensions Committee since 2015.
- Minor party candidates during the early 21st century
At the 2001, 2005 and 2010 general elections no candidates apart from those selected by the Labour, Conservative, and Liberal Democrat parties contested the seat. Until and including the 1966 general election, three or fewer candidates generally stood in more safe-than-marginal majority-seats nationally; as is reflected the elections shown below of Birkenhead. The 2015 general election result saw the Liberal Democrat candidate fall behind the Green candidate and the parties narrowly lost their deposits.
Boundaries
The enfranchising Act provided that the constituency was to consist of the Extra-parochial Chapelry of Birkenhead, the several townships of Claughton, Tranmere, and Oxton, and so much of the township of Higher Bebbington as lies to the eastward of the road leading from Higher Tranmere to Lower Bebbington.[7]
1950-1974: The County Borough of Birkenhead, except the wards included in the Bebington constituency.
1974-1983: The County Borough of Birkenhead wards of Argyle, Bebington, Cathcart, Claughton, Cleveland, Clifton, Devonshire, Egerton, Gilbrook, Grange, Holt, Mersey, Oxton, and St James.
1983-2010: The Metropolitan Borough of Wirral wards of Bidston, Birkenhead, Claughton, Egerton, Oxton, and Tranmere.
2010–present: The Metropolitan Borough of Wirral wards of Bidston and St James, Birkenhead and Tranmere, Claughton, Oxton, Prenton, and Rock Ferry.
The constituency covers the town of Birkenhead, on the Wirral Peninsula, and the Birkenhead suburbs of Bidston, Claughton, Oxton, Prenton, Rock Ferry and Tranmere.
Members of Parliament
MPs 1861–1918
| Election | Member[8] | Party | |
|---|---|---|---|
| 1861 | John Laird | Conservative | |
| 1874 | David MacIver | Conservative | |
| 1885 | Edward Bruce Hamley | Conservative | |
| 1892 | Arnold Keppel, Viscount Bury | Conservative | |
| 1894 | Elliott Lees | Conservative | |
| 1906 | Henry Harvey Vivian | Lib-Lab | |
| 1910 | Alfred Bigland | Conservative | |
| 1918 | constituency abolished: see Birkenhead East and Birkenhead West | ||
MPs since 1950
| Election | Member | Party | |
|---|---|---|---|
| 1950 | Percy Collick | Labour | |
| 1964 | Edmund Dell | Labour | |
| 1979 | Frank Field | Labour | |
| 2018 | Independent[9][10] | ||
Elections
Elections in the 2010s
June 2017
| Party | Candidate | Votes | % | ± | |
|---|---|---|---|---|---|
| Labour | Frank Field | 33,558 | 76.9 | ||
| Conservative | Stewart Gardiner | 8,044 | 18.4 | ||
| Liberal Democrat | Allan Brame | 1,118 | 2.6 | ||
| Green | Jayne Clough | 943 | 2.2 | ||
| Majority | 25,514 | 58.4 | |||
| Turnout | 43,663 | 67.7 | |||
| Labour hold | Swing | ||||
May 2015
| Party | Candidate | Votes | % | ± | |
|---|---|---|---|---|---|
| Labour | Frank Field | 26,468 | 67.6 | ||
| Conservative | Clark Vasey | 5,816 | 14.9 | ||
| UKIP | Wayne Harling | 3,838 | 9.8 | New | |
| Green | Kenny Peers | 1,626 | 4.2 | New | |
| Liberal Democrat | Allan Brame | 1,396 | 3.6 | ||
| Majority | 20,652 | 52.8 | |||
| Turnout | 39,144 | 62.7 | |||
| Labour hold | Swing | ||||
May 2010
| Party | Candidate | Votes | % | ± | |
|---|---|---|---|---|---|
| Labour | Frank Field | 22,082 | 62.5 | ||
| Conservative | Andrew Gilbert | 6,687 | 18.9 | ||
| Liberal Democrat | Stuart Kelly | 6,554 | 18.6 | ||
| Majority | 15,395 | 43.6 | |||
| Turnout | 35,523 | 56.6 | |||
| Labour hold | Swing | ||||
Elections in the 2000s
| Party | Candidate | Votes | % | ± | |
|---|---|---|---|---|---|
| Labour | Frank Field | 18,059 | 65.0 | −5.5 | |
| Liberal Democrat | Stuart Kelly | 5,125 | 18.4 | +5.6 | |
| Conservative | Howard Morton | 4,602 | 16.6 | −0.1 | |
| Majority | 12,934 | 46.5 | −7.3 | ||
| Turnout | 27,786 | 48.7 | +0.4 | ||
| Labour hold | Swing | −5.6 | |||
| Party | Candidate | Votes | % | ± | |
|---|---|---|---|---|---|
| Labour | Frank Field | 20,418 | 70.5 | −0.3 | |
| Conservative | Brian Stewart | 4,827 | 16.7 | +1.5 | |
| Liberal Democrat | Roy Wood | 3,722 | 12.8 | +3.8 | |
| Majority | 15,591 | 53.8 | −1.8 | ||
| Turnout | 28,967 | 48.3 | −17.7 | ||
| Labour hold | Swing | −0.9 | |||
Elections in the 1990s
| Party | Candidate | Votes | % | ± | |
|---|---|---|---|---|---|
| Labour | Frank Field | 27,825 | 70.8 | +7.2 | |
| Conservative | John Crosby | 5,982 | 15.2 | −9.9 | |
| Liberal Democrat | Roy Wood | 3,548 | 9.0 | −0.7 | |
| Socialist Labour | Mark Cullen | 1,168 | 3.0 | N/A | |
| Referendum | Richard Evans | 800 | 2.0 | N/A | |
| Majority | 21,843 | 55.6 | +17.1 | ||
| Turnout | 39,323 | 65.8 | −7.2 | ||
| Labour hold | Swing | +8.6 | |||
| Party | Candidate | Votes | % | ± | |
|---|---|---|---|---|---|
| Labour | Frank Field | 29,098 | 63.6 | +4.9 | |
| Conservative | Robert Hughes | 11,485 | 25.1 | −1.3 | |
| Liberal Democrat | Pat M. Williams | 4,417 | 9.7 | −5.2 | |
| Green | Tina R. Fox | 543 | 1.2 | N/A | |
| Natural Law | Bridget Griffiths | 190 | 0.4 | N/A | |
| Majority | 17,613 | 38.5 | +6.2 | ||
| Turnout | 45,733 | 73.0 | +0.7 | ||
| Labour hold | Swing | +3.1 | |||
Elections in the 1980s
| Party | Candidate | Votes | % | ± | |
|---|---|---|---|---|---|
| Labour | Frank Field | 27,883 | 58.7 | +9.1 | |
| Conservative | Kenneth Costa | 12,511 | 26.4 | −2.5 | |
| Liberal | Richard Kemp | 7,095 | 14.9 | −5.9 | |
| Majority | 15,372 | 32.3 | +11.6 | ||
| Turnout | 47,489 | 72.3 | +2.6 | ||
| Labour hold | Swing | +5.8 | |||
| Party | Candidate | Votes | % | ± | |
|---|---|---|---|---|---|
| Labour | Frank Field | 23,249 | 49.6 | −0.3 | |
| Conservative | Tom Peet | 13,535 | 28.9 | −6.8 | |
| Liberal | Gordon C. Lindsay | 9,782 | 20.8 | +7.1 | |
| Majority | 9,714 | 20.7 | +6.5 | ||
| Turnout | 46,566 | 69.7 | -4.2 | ||
| Labour hold | Swing | +3.6 | |||
Elections in the 1970s
| Party | Candidate | Votes | % | ± | |
|---|---|---|---|---|---|
| Labour | Frank Field | 20,803 | 49.9 | −1.4 | |
| Conservative | P. Gill | 14,894 | 35.7 | +6.8 | |
| Liberal | Roy Perkins | 5,708 | 13.7 | −6.1 | |
| Workers Revolutionary | M. Fletcher | 306 | 0.7 | n/a | |
| Majority | 5,909 | 14.2 | −8.2 | ||
| Turnout | 41,711 | 73.9 | +3.7 | ||
| Labour hold | Swing | −4.1 | |||
| Party | Candidate | Votes | % | ± | |
|---|---|---|---|---|---|
| Labour | Edmund Dell | 21,748 | 51.3 | +6.1 | |
| Conservative | E. Gearing | 12,264 | 28.9 | −1.0 | |
| Liberal | Gordon Lindsay | 8,380 | 19.8 | −5.1 | |
| Majority | 9,484 | 22.4 | +7.1 | ||
| Turnout | 42,392 | 70.2 | −6.3 | ||
| Labour hold | Swing | +3.6 | |||
| Party | Candidate | Votes | % | ± | |
|---|---|---|---|---|---|
| Labour | Edmund Dell | 20,696 | 45.2 | −5.5 | |
| Conservative | J.S. Pyke | 13,702 | 29.9 | −6.7 | |
| Liberal | Gordon Lindsay | 11,410 | 24.9 | +13.0 | |
| Majority | 6,994 | 15.3 | +1.2 | ||
| Turnout | 45,808 | 76.5 | +5.7 | ||
| Labour hold | Swing | +6.1 | |||
| Party | Candidate | Votes | % | ± | |
|---|---|---|---|---|---|
| Labour | Edmund Dell | 20,980 | 50.7 | −9.4 | |
| Conservative | Robert Kris | 15,151 | 36.6 | −1.8 | |
| Liberal | Gruffydd Evans | 4,926 | 11.9 | N/A | |
| Communist | Barry Williams | 351 | 0.9 | −0.6 | |
| Majority | 5,829 | 14.1 | −7.6 | ||
| Turnout | 41,408 | 70.8 | −2.1 | ||
| Labour hold | Swing | −5.6 | |||
Elections in the 1960s
| Party | Candidate | Votes | % | ± | |
|---|---|---|---|---|---|
| Labour | Edmund Dell | 24,188 | 60.1 | +3.1 | |
| Conservative | Robert Adley | 15,438 | 38.4 | −4.6 | |
| Communist | Barry Williams | 604 | 1.5 | N/A | |
| Majority | 8,750 | 21.7 | +7.7 | ||
| Turnout | 40,230 | 72.9 | −1.9 | ||
| Labour hold | Swing | +3.9 | |||
| Party | Candidate | Votes | % | ± | |
|---|---|---|---|---|---|
| Labour | Edmund Dell | 23,994 | 57.0 | +8.1 | |
| Conservative | Robert Kenelm Morland | 18,133 | 43.0 | +1.8 | |
| Majority | 5,861 | 14.0 | +6.3 | ||
| Turnout | 42,127 | 74.4 | −4.4 | ||
| Labour hold | Swing | +5.0 | |||
Elections in the 1950s
| Party | Candidate | Votes | % | ± | |
|---|---|---|---|---|---|
| Labour | Percy Collick | 22,990 | 48.9 | −4.6 | |
| Conservative | Kenneth Graham Routledge | 19,361 | 41.2 | −5.3 | |
| Liberal | G Frederick Bilson | 4,658 | 9.9 | N/A | |
| Majority | 3,629 | 7.7 | +0.7 | ||
| Turnout | 47,009 | 78.8 | +3.1 | ||
| Labour hold | Swing | +5.0 | |||
| Party | Candidate | Votes | % | ± | |
|---|---|---|---|---|---|
| Labour | Percy Collick | 24,526 | 53.5 | −1.5 | |
| Conservative | Harry S. Oddie | 21,345 | 46.5 | +1.5 | |
| Majority | 3,181 | 7.0 | −3.0 | ||
| Turnout | 45,871 | 75.7 | −7.1 | ||
| Labour hold | Swing | −1.5 | |||
| Party | Candidate | Votes | % | ± | |
|---|---|---|---|---|---|
| Labour | Percy Collick | 29,014 | 55.0 | +5.1 | |
| Conservative | Maxwell Reney-Smith | 23,765 | 45.0 | +6.6 | |
| Majority | 5,249 | 10.0 | −1.5 | ||
| Turnout | 52,779 | 82.8 | −2.1 | ||
| Labour hold | Swing | −5.9 | |||
| Party | Candidate | Votes | % | ± | |
|---|---|---|---|---|---|
| Labour | Percy Collick | 26,472 | 49.9 | N/A | |
| Conservative | Horace Trevor-Cox | 20,343 | 38.4 | N/A | |
| Liberal | D.R. Green | 5,234 | 9.9 | N/A | |
| Communist | S. Coulthard | 971 | 1.8 | N/A | |
| Majority | 6,129 | 11.5 | N/A | ||
| Turnout | 53,020 | 84.9 | N/A | ||
| Labour win (new seat) | |||||
Elections in the 1910s
| Party | Candidate | Votes | % | ± | |
|---|---|---|---|---|---|
| Conservative | Alfred Bigland | 8,304 | 53.4 | +3.8 | |
| Lib-Lab | Henry Harvey Vivian | 7,249 | 46.6 | −3.8 | |
| Majority | 1,055 | 6.8 | N/A | ||
| Turnout | 15,553 | 85.5 | −3.0 | ||
| Registered electors | 18,189 | ||||
| Conservative gain from Lib-Lab | Swing | +3.8 | |||
| Party | Candidate | Votes | % | ± | |
|---|---|---|---|---|---|
| Lib-Lab | Henry Harvey Vivian | 8,120 | 50.4 | +1.4 | |
| Conservative | Alfred Bigland | 7,976 | 49.6 | +13.2 | |
| Majority | 144 | 0.8 | −11.8 | ||
| Turnout | 16,096 | 88.5 | +3.5 | ||
| Registered electors | 18,189 | ||||
| Lib-Lab hold | Swing | −5.9 | |||
Elections in the 1900s
| Party | Candidate | Votes | % | ± | |
|---|---|---|---|---|---|
| Lib-Lab | Henry Harvey Vivian | 7,074 | 49.0 | N/A | |
| Conservative | Elliott Lees | 5,271 | 36.4 | N/A | |
| Independent Protestant | John Alfred Kensit | 2,118 | 14.6 | N/A | |
| Majority | 1,803 | 12.6 | N/A | ||
| Turnout | 14,463 | 85.0 | N/A | ||
| Registered electors | 17,010 | ||||
| Lib-Lab gain from Conservative | Swing | N/A | |||
| Party | Candidate | Votes | % | ± | |
|---|---|---|---|---|---|
| Conservative | Elliott Lees | Unopposed | |||
| Conservative hold | |||||
Elections in the 1890s
| Party | Candidate | Votes | % | ± | |
|---|---|---|---|---|---|
| Conservative | Elliott Lees | 6,178 | 50.8 | −2.0 | |
| Liberal | William Lever | 5,974 | 49.2 | +2.0 | |
| Majority | 204 | 1.6 | −4.0 | ||
| Turnout | 12,152 | 85.1 | +1.3 | ||
| Registered electors | 14,277 | ||||
| Conservative hold | Swing | −2.0 | |||
| Party | Candidate | Votes | % | ± | |
|---|---|---|---|---|---|
| Conservative | Elliott Lees | 6,149 | 50.4 | −2.4 | |
| Liberal | William Lever | 6,043 | 49.6 | +2.4 | |
| Majority | 106 | 0.8 | −4.8 | ||
| Turnout | 12,192 | 85.3 | +1.5 | ||
| Registered electors | 14,293 | ||||
| Conservative hold | Swing | −2.4 | |||
| Party | Candidate | Votes | % | ± | |
|---|---|---|---|---|---|
| Conservative | Arnold Keppel | 5,760 | 52.8 | −3.5 | |
| Liberal | William Lever | 5,156 | 47.2 | +3.5 | |
| Majority | 604 | 5.6 | −7.0 | ||
| Turnout | 10,196 | 83.8 | +6.7 | ||
| Registered electors | 13,031 | ||||
| Conservative hold | Swing | −3.5 | |||
Elections in the 1880s
| Party | Candidate | Votes | % | ± | |
|---|---|---|---|---|---|
| Conservative | Edward Bruce Hamley | 5,255 | 56.3 | +0.6 | |
| Liberal | William Rann Kennedy | 4,086 | 43.7 | −0.6 | |
| Majority | 1,169 | 12.6 | +1.2 | ||
| Turnout | 9,341 | 77.1 | −7.9 | ||
| Registered electors | 12,115 | ||||
| Conservative hold | Swing | +0.6 | |||
| Party | Candidate | Votes | % | ± | |
|---|---|---|---|---|---|
| Conservative | Edward Bruce Hamley | 5,733 | 55.7 | +3.3 | |
| Liberal | William Rann Kennedy | 4,560 | 44.3 | −3.3 | |
| Majority | 1,173 | 11.4 | +6.6 | ||
| Turnout | 10,293 | 85.0 | +0.8 | ||
| Registered electors | 12,115 | ||||
| Conservative hold | Swing | +3.3 | |||
| Party | Candidate | Votes | % | ± | |
|---|---|---|---|---|---|
| Conservative | David MacIver | 4,025 | 52.4 | −17.6 | |
| Liberal | Arthur John Williams[30] | 3,658 | 47.6 | +17.6 | |
| Majority | 367 | 4.8 | −35.3 | ||
| Turnout | 7,683 | 84.2 | +13.5 | ||
| Registered electors | 9,127 | ||||
| Conservative hold | Swing | −17.6 | |||
Elections in the 1870s
| Party | Candidate | Votes | % | ± | |
|---|---|---|---|---|---|
| Conservative | David MacIver | 3,421 | 58.0 | −12.0 | |
| Liberal | Samuel Stitt[31] | 2,474 | 42.0 | +12.0 | |
| Majority | 947 | 16.1 | −23.9 | ||
| Turnout | 5,895 | 79.0 | +8.3 | ||
| Registered electors | 7,458 | ||||
| Conservative hold | Swing | −12.0 | |||
- Caused by Laird's death.
| Party | Candidate | Votes | % | ± | |
|---|---|---|---|---|---|
| Conservative | John Laird | 3,692 | 70.0 | +11.1 | |
| Lib-Lab | James Samuelson[32] | 1,580 | 30.0 | −11.1 | |
| Majority | 2,112 | 40.1 | +22.3 | ||
| Turnout | 5,272 | 70.7 | −13.5 | ||
| Registered electors | 7,458 | ||||
| Conservative hold | Swing | +11.1 | |||
Elections in the 1860s
| Party | Candidate | Votes | % | ± | |
|---|---|---|---|---|---|
| Conservative | John Laird | 2,921 | 58.9 | −7.4 | |
| Liberal | Sherard Osborn[33] | 2,039 | 41.1 | +7.4 | |
| Majority | 882 | 17.8 | −14.7 | ||
| Turnout | 4,960 | 84.2 | +14.5 | ||
| Registered electors | 5,892 | ||||
| Conservative hold | Swing | −7.4 | |||
| Party | Candidate | Votes | % | ± | |
|---|---|---|---|---|---|
| Conservative | John Laird | 2,108 | 66.3 | N/A | |
| Liberal | Henry Jackson | 1,073 | 33.7 | N/A | |
| Majority | 1,035 | 32.5 | N/A | ||
| Turnout | 3,181 | 69.7 | N/A | ||
| Registered electors | 4,563 | ||||
| Conservative win (new seat) | |||||
While the seat was created in 1861, it is considered a new seat for the purposes of the 1865 general election.
| Party | Candidate | Votes | % | ± | |
|---|---|---|---|---|---|
| Conservative | John Laird | 1,643 | 55.9 | N/A | |
| Liberal | Thomas Brassey[34] | 1,296 | 44.1 | N/A | |
| Majority | 347 | 11.8 | N/A | ||
| Turnout | 2,939 | 84.2 | N/A | ||
| Registered electors | 3,489 | ||||
| Conservative win (new seat) | |||||
See also
Notes and references
- Notes
- ↑ As with all constituencies, the constituency elects one Member of Parliament (MP) by the first past the post system of election at least every five years.
- References
- ↑ "Birkenhead: Usual Resident Population, 2011". Neighbourhood Statistics. Office for National Statistics. Retrieved 29 January 2015.
- ↑ "Electorate Figures - Boundary Commission for England". 2011 Electorate Figures. Boundary Commission for England. 4 March 2011. Archived from the original on 6 November 2010. Retrieved 13 March 2011.
- ↑ Local Government Act 1972, s. 1 enacting Sch.1 Pt. 1
- ↑ The boundary factors for each minimum 10-yearly Boundary Commission review are set in the UK by the Parliamentary Constituencies Act 1986
- ↑ List of Labour MPs elected in 2015 by % majority UK Political.info. Retrieved 2017-01-29
- ↑ 1861 c.112
- ↑ Birkenhead Enfranchisement Act 1861, section 9.
- ↑ Leigh Rayment's Historical List of MPs – Constituencies beginning with "B" (part 3)
- ↑ https://www.bbc.co.uk/news/uk-politics-45359009/amp/
- ↑ Stewart, Heather (30 August 2018). "Frank Field resigns Labour whip over antisemitism crisis".
- ↑ "Birkenhead parliamentary constituency". BBC News.
- ↑ "Election Data 2015". Electoral Calculus. Archived from the original on 17 October 2015. Retrieved 17 October 2015.
- ↑ "Birkenhead". BBC News. Retrieved 11 May 2015.
- ↑ "Election Data 2010". Electoral Calculus. Archived from the original on 26 July 2013. Retrieved 17 October 2015.
- ↑ Parliamentary General Election Candidates, Wirral Metropolitan Borough Council
- ↑ "BBC NEWS – Election 2010 – Birkenhead". BBC News.
- ↑ "Election Data 2005". Electoral Calculus. Archived from the original on 15 October 2011. Retrieved 18 October 2015.
- ↑ "Election Data 2001". Electoral Calculus. Archived from the original on 15 October 2011. Retrieved 18 October 2015.
- ↑ "Election Data 1997". Electoral Calculus. Archived from the original on 15 October 2011. Retrieved 18 October 2015.
- ↑ "Politics Resources". Election 1997. Politics Resources. 1 May 1997. Retrieved 2010-12-25. C. Rallings & M. Thrasher, The Media Guide to the New Parliamentary Constituencies, p.31 (Plymouth: LGC Elections Centre, 1995)
- ↑ "Election Data 1992". Electoral Calculus. Archived from the original on 15 October 2011. Retrieved 18 October 2015.
- ↑ "Politics Resources". Election 1992. Politics Resources. 9 April 1992. Retrieved 2010-12-06.
- ↑ "Election Data 1987". Electoral Calculus. Archived from the original on 15 October 2011. Retrieved 18 October 2015.
- ↑ "Election Data 1983". Electoral Calculus. Archived from the original on 15 October 2011. Retrieved 18 October 2015.
- 1 2 3 4 5 6 7 Craig, FWS, ed. (1974). British Parliamentary Election Results: 1885-1918. London: Macmillan Press. ISBN 9781349022984.
- 1 2 British Parliamentary Election Results 1885-1918, FWS Craig
- ↑ The Liberal Year Book, 1907
- ↑ Debrett's House of Commons & Judicial Bench, 1886
- 1 2 3 4 5 6 Craig, F. W. S., ed. (1977). British Parliamentary Election Results 1832-1885 (e-book)
|format=requires|url=(help) (1st ed.). London: Macmillan Press. ISBN 978-1-349-02349-3. - ↑ "Birkenhead". Wrexham Guardian and Denbighshire and Flintshire Advertiser. 23 Aug 1879. p. 3. Retrieved 24 November 2017.
- ↑ "Representation of Birkenhead". The Morning Post. 21 November 1874. p. 4. Retrieved 27 December 2017 – via British Newspaper Archive. (Subscription required (help)).
- ↑ "The General Elections". Jersey Independent and Daily Telegraph. 31 January 1874. p. 2. Retrieved 27 December 2017 – via British Newspaper Archive. (Subscription required (help)).
- ↑ "Birkenhead". Yorkshire Post and Leeds Intelligencer. 14 September 1868. p. 3. Retrieved 28 January 2018 – via British Newspaper Archive. (Subscription required (help)).
- ↑ "Representation of Birkenhead". Liverpool Mercury. 1 March 1861. p. 7. Retrieved 28 January 2018 – via British Newspaper Archive. (Subscription required (help)).
Sources
- Craig, F. W. S. (1983) [1969]. British parliamentary election results 1918-1949 (3rd ed.). Chichester: Parliamentary Research Services. ISBN 0-900178-06-X.