Wansbeck (UK Parliament constituency)
| Wansbeck | |
|---|---|
|
County constituency for the House of Commons | |
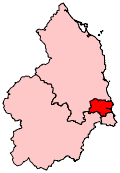 Boundary of Wansbeck in Northumberland. | |
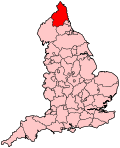 Location of Northumberland within England. | |
| County | Northumberland |
| Electorate | 62,395 (December 2010)[1] |
| Major settlements | Morpeth, Ashington, Bedlington |
| Current constituency | |
| Created | 1983 |
| Member of parliament | Ian Lavery (Labour) |
| Number of members | One |
| Created from | Morpeth and Blyth[2] |
| 1885–1950 | |
| Number of members | One |
| Type of constituency | County constituency |
| Replaced by | Blyth, Hexham, Morpeth and Tynemouth |
| Created from | South Northumberland |
| Overlaps | |
| European Parliament constituency | North East England |
Wansbeck is a constituency[n 1] represented in the House of Commons of the UK Parliament since 2010 by Ian Lavery, a member of the Labour Party.[n 2]
Boundaries
1918-1950: The Urban Districts of Cramlington, Earsdon, Newbiggin-by-the-Sea, Newburn, Seaton Delaval, Seghill, and Whitley and Monkseaton; and part of the Rural Districts of Castle Ward, and Morpeth.[3]
1983–present: The District of Wansbeck, and the Borough of Castle Morpeth wards of Hebron Hepscott and Mitford, Morpeth Central, Morpeth Kirkhill, Morpeth North, Morpeth South, Morpeth Stobhill, and Pegswood.
Parliament accepted the Boundary Commission's Fifth Periodic Review of Westminster constituencies did not alter this constituency for the 2010 general election, thus since 1997 it has had the following electoral wards:
- Bedlington: Central, East and West wards; Bothal, Central, Choppington, Guide Post, Haydon, Hurst, Newbiggin East, Newbiggin West, Park, Seaton, Sleekburn and Stakeford which formed the former district of Wansbeck
- Hebron, Hepscott and Mitford, Morpeth Central, Morpeth Kirkhill, Morpeth North, Morpeth South, Morpeth Stobhill and Pegswood in the former borough of Castle Morpeth - all of the above being in the unitary county of Northumberland.[4]
History
1885–1950
- Political history
The seat alternated in accordance with the national trend in mining-strong communities outside of South Yorkshire, which as such saw significant early Labour support, and led to, in the 1931 and 1935 elections, a general transfer of loyalty to the Conservative Party, and ushered in a return to Labour support in the next contested election in 1945.
- Prominent frontbenchers
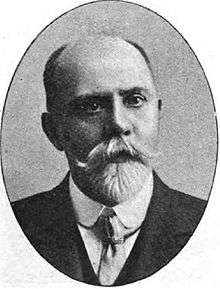
Alfred Robens represented the area in the Attlee ministry and towards the end of the year of Attlee's more marginal victory (1950–51) served as Minister of Labour and National Service. He then in 1951 won instead the newly created Blyth seat to the immediate south. In 1955 he became Shadow Foreign Secretary until an unimpressive performance in predicting and reacting to events in the Suez Crisis in 1956. However, in a position which would span the period 1961 until 1971, he became Chairman of the National Coal Board (and Lord Robens) and oversaw substantial cuts in the mining industry. During this period he co-authored the Robens Report that followed his difficult but practical risk management of the coal mining sector, including accepting some culpability in the Aberfan Disaster. This led, with the ministry of Barbara Castle's adjustments, to the Health and Safety at Work Act 1974 which set up the Health and Safety Executive and remains the foundation of this area of English law.
1983-date
The constituency has been held solely by Labour since its recreation, during which time its history presents a safe seat. The most marginal majority was in 2010, in a similar result to 1983 when the runner-up candidate was a Liberal Democrat.
Constituency profile
The seat has the visitor attractions of a historic main town with a castle, Morpeth and the traditional seaside town of Newbiggin. Workless claimants as registered jobseekers, with high male unemployment, which is widespread but exacerbated in the area, in November 2012, was higher than the national average of 3.8%, at 6.2% of the population based on a statistical compilation by The Guardian. This was marginally higher than the then regional average of 5.9%.[5]
Members of Parliament
MPs 1885–1950
| Election | Member[6] | Party | |
|---|---|---|---|
| 1885 | Charles Fenwick | Liberal | |
| 1918 | Robert Mason | Liberal | |
| 1919 | Coalition Liberal | ||
| 1922 | George Warne | Labour | |
| 1929 | George Shield | Labour | |
| 1931 | Bernard Cruddas | Conservative | |
| 1940 | Donald Scott | Conservative | |
| 1945 | Alfred Robens | Labour | |
| 1950 | Constituency abolished | ||
MPs since 1983
| Election | Member[6] | Party | |
|---|---|---|---|
| 1983 | Jack Thompson | Labour | |
| 1997 | Denis Murphy | Labour | |
| 2010 | Ian Lavery | Labour | |
Elections
Elections in the 2010s
| Party | Candidate | Votes | % | ± | |
|---|---|---|---|---|---|
| Labour | Ian Lavery | 24,338 | 57.3 | +7.3 | |
| Conservative | Chris Galley | 13,903 | 32.7 | +11.0 | |
| Liberal Democrat | Joan Tebbutt | 2,015 | 4.7 | -1.5 | |
| UKIP | Melanie Hurst | 1,483 | 3.5 | -14.7 | |
| Green | Steven Leyland | 715 | 1.7 | -2.1 | |
| Majority | 10,435 | 24.8 | -3.4 | ||
| Turnout | 42,454 | 68.4 | +4.8 | ||
| Labour hold | Swing | -1.9 | |||
| Party | Candidate | Votes | % | ± | |
|---|---|---|---|---|---|
| Labour | Ian Lavery | 19,267 | 50.0 | +4.2 | |
| Conservative | Chris Galley | 8,386 | 21.8 | +4.2 | |
| UKIP | Melanie Hurst | 7,014 | 18.2 | +15.7 | |
| Liberal Democrat | Tom Hancock | 2,407 | 6.2 | -21.2 | |
| Green | Christopher Hedley | 1,454 | 3.8 | +2.2 | |
| Majority | 10,881 | 28.2 | +9.8 | ||
| Turnout | 38,528 | 63.6 | +2.9 | ||
| Labour hold | Swing | -0.03 | |||
| Party | Candidate | Votes | % | ± | |
|---|---|---|---|---|---|
| Labour | Ian Lavery | 17,548 | 45.9 | -9.3 | |
| Liberal Democrat | Simon Reed | 10,517 | 27.5 | +1.0 | |
| Conservative | Campbell Storey | 6,714 | 17.5 | +2.6 | |
| BNP | Stephen Finlay | 1,481 | 3.7 | +3.7 | |
| UKIP | Linda-Lee Stokoe | 974 | 2.5 | +2.5 | |
| Green | Nic Best | 601 | 1.6 | -1.8 | |
| Independent | Malcolm Reid | 359 | 0.9 | +0.9 | |
| Christian | Michael Flynn | 142 | 0.4 | +0.4 | |
| Majority | 7,031 | 18.4 | -10.3 | ||
| Turnout | 38,273 | 60.7 | +2.3 | ||
| Labour hold | Swing | -5.2 | |||
Elections in the 2000s
| Party | Candidate | Votes | % | ± | |
|---|---|---|---|---|---|
| Labour | Denis Murphy | 20,315 | 55.2 | −2.6 | |
| Liberal Democrat | Simon Reed | 9,734 | 26.4 | +3.6 | |
| Conservative | Ginny Scrope | 5,515 | 15.0 | +2.2 | |
| Green | Nic Best | 1,245 | 3.4 | +0.9 | |
| Majority | 10,581 | 28.7 | -6.3 | ||
| Turnout | 36,809 | 58.4 | −0.9 | ||
| Labour hold | Swing | -3.1 | |||
| Party | Candidate | Votes | % | ± | |
|---|---|---|---|---|---|
| Labour | Denis Murphy | 21,617 | 57.8 | -7.7 | |
| Liberal Democrat | Alan Thompson | 8,516 | 22.8 | +6.8 | |
| Conservative | Rachael Lake | 4,774 | 12.8 | -1.2 | |
| Independent | Michael Kirkup | 1,076 | 2.9 | N/A | |
| Green | Nic Best | 954 | 2.5 | +0.4 | |
| UKIP | Gavin Attwell | 482 | 1.3 | N/A | |
| Majority | 13,101 | 35.0 | -14.5 | ||
| Turnout | 37,419 | 59.3 | -12.3 | ||
| Labour hold | Swing | -7.3 | |||
Elections in the 1990s
| Party | Candidate | Votes | % | ± | |
|---|---|---|---|---|---|
| Labour | Denis Murphy | 29,569 | 65.5 | +5.8 | |
| Liberal Democrat | Alan Thompson | 7,202 | 15.9 | +0.6 | |
| Conservative | Paul V. Green | 6,299 | 13.9 | -9.7 | |
| Referendum | Peter H. Gompertz | 1,146 | 2.5 | N/A | |
| Green | Nic Best | 956 | 2.1 | +0.7 | |
| Majority | 22,367 | 49.5 | +13.4 | ||
| Turnout | 45,172 | 71.7 | −7.6 | ||
| Labour hold | Swing | +7.8 | |||
| Party | Candidate | Votes | % | ± | |
|---|---|---|---|---|---|
| Labour | Jack Thompson | 30,046 | 59.7 | +2.2 | |
| Conservative | Glen Sanderson | 11,872 | 23.6 | +4.2 | |
| Liberal Democrat | Brian C. Priestley | 7,691 | 15.3 | -7.8 | |
| Green | Nic Best | 710 | 1.4 | +1.4 | |
| Majority | 18,174 | 36.1 | +1.7 | ||
| Turnout | 50,319 | 79.3 | +1.3 | ||
| Labour hold | Swing | +5.0 | |||
Elections in the 1980s
| Party | Candidate | Votes | % | ± | |
|---|---|---|---|---|---|
| Labour | Jack Thompson | 28,080 | 57.5 | +10.5 | |
| Liberal | Sarah Mitchell | 11,291 | 23.1 | -7.0 | |
| Conservative | David Walton | 9,490 | 19.4 | -3.5 | |
| Majority | 16,789 | 34.4 | +17.4 | ||
| Turnout | 48,861 | 78.0 | +5.2 | ||
| Labour hold | Swing | +8.8 | |||
| Party | Candidate | Votes | % | ± | |
|---|---|---|---|---|---|
| Labour | Jack Thompson | 21,732 | 47.0 | N/A | |
| Liberal | Alan Thompson | 13,901 | 30.1 | N/A | |
| Conservative | C.H.W. Mitchell | 10,563 | 22.9 | N/A | |
| Majority | 7,831 | 17.0 | N/A | ||
| Turnout | 46,196 | 72.8 | N/A | ||
| Labour win (new seat) | |||||
Elections in the 1940s
| Party | Candidate | Votes | % | ± | |
|---|---|---|---|---|---|
| Labour | Alfred Robens | 40,948 | 60.00 | ||
| Conservative | Donald Scott | 27,295 | 40.00 | ||
| Majority | 13,653 | 20.01 | |||
| Turnout | 77.69 | ||||
| Labour gain from Conservative | Swing | ||||
| Party | Candidate | Votes | % | ± | |
|---|---|---|---|---|---|
| Conservative | Donald Scott | unopposed | N/A | N/A | |
| Conservative hold | Swing | N/A | |||
Elections in the 1930s
| Party | Candidate | Votes | % | ± | |
|---|---|---|---|---|---|
| Conservative | Bernard Cruddas | 30,859 | 50.79 | ||
| Labour | Edward Dowling | 29,904 | 49.21 | ||
| Majority | 955 | 1.57 | |||
| Turnout | 79.59 | ||||
| Conservative hold | Swing | ||||
| Party | Candidate | Votes | % | ± | |
|---|---|---|---|---|---|
| Conservative | Bernard Cruddas | 33,659 | 58.25 | ||
| Labour | George Shield | 24,126 | 41.75 | ||
| Majority | 9,533 | 16.50 | |||
| Turnout | 81.86 | ||||
| Conservative gain from Labour | Swing | ||||
Elections in the 1920s
| Party | Candidate | Votes | % | ± | |
|---|---|---|---|---|---|
| Labour | George Shield | 27,930 | 54.5 | +1.6 | |
| Unionist | Bernard Cruddas | 17,056 | 33.2 | −13.9 | |
| Liberal | Frederick Wandby | 6,330 | 12.3 | N/A | |
| Majority | 10,874 | 21.2 | +15.5 | ||
| Turnout | 34,260 | 76.1 | −3.3 | ||
| Registered electors | 67,390 | ||||
| Labour hold | Swing | +7.8 | |||
| Party | Candidate | Votes | % | ± | |
|---|---|---|---|---|---|
| Labour | George Shield | 20,398 | 58.0 | +5.1 | |
| Unionist | Ian McAllister Moffat Pender | 9,612 | 27.3 | −19.8 | |
| Liberal | Harry Briggs | 5,183 | 14.7 | N/A | |
| Majority | 10,786 | 30.7 | +24.9 | ||
| Turnout | 35,193 | 65.3 | −14.1 | ||
| Registered electors | 53,886 | ||||
| Labour hold | Swing | +12.5 | |||
| Party | Candidate | Votes | % | ± | |
|---|---|---|---|---|---|
| Labour | George Warne | 21,159 | 52.9 | −3.9 | |
| Unionist | M.K. Middleton | 18,875 | 47.1 | +3.9 | |
| Majority | 2,284 | 5.8 | −7.8 | ||
| Turnout | 40,034 | 79.4 | +11.0 | ||
| Registered electors | 50,446 | ||||
| Labour hold | Swing | −3.9 | |||
| Party | Candidate | Votes | % | ± | |
|---|---|---|---|---|---|
| Labour | George Warne | 18,583 | 56.8 | +11.6 | |
| Unionist | Hilton Philipson | 14,131 | 43.2 | +11.8 | |
| Majority | 4,452 | 13.6 | −0.2 | ||
| Turnout | 32,714 | 68.4 | −8.2 | ||
| Registered electors | 47,828 | ||||
| Labour hold | Swing | −0.1 | |||
| Party | Candidate | Votes | % | ± | |
|---|---|---|---|---|---|
| Labour | George Warne | 16,032 | 45.2 | +2.1 | |
| Unionist | R. White | 11,149 | 31.4 | N/A | |
| National Liberal | John Neal | 5,192 | 14.6 | N/A | |
| Liberal | Matthew Davey | 3,134 | 8.8 | −48.1 | |
| Majority | 4,883 | 13.8 | N/A | ||
| Turnout | 35,507 | 76.6 | +18.7 | ||
| Registered electors | 46,354 | ||||
| Labour gain from Liberal | Swing | +25.1 | |||
Election results 1885–1918
Elections in the 1880s

| Party | Candidate | Votes | % | ± | |
|---|---|---|---|---|---|
| Lib-Lab | Charles Fenwick | 5,858 | 68.4 | N/A | |
| Conservative | John Blencowe Cookson | 2,703 | 31.6 | N/A | |
| Majority | 3,155 | 36.8 | N/A | ||
| Turnout | 8,561 | 82.4 | N/A | ||
| Registered electors | 10,392 | ||||
| Lib-Lab win (new seat) | |||||
| Party | Candidate | Votes | % | ± | |
|---|---|---|---|---|---|
| Lib-Lab | Charles Fenwick | 5,235 | 75.4 | +7.0 | |
| Liberal Unionist | William Wight | 1,710 | 24.6 | −7.0 | |
| Majority | 3,525 | 50.8 | +14.0 | ||
| Turnout | 6,945 | 66.8 | −15.6 | ||
| Registered electors | 10,392 | ||||
| Lib-Lab hold | Swing | +7.0 | |||
Elections in the 1890s
| Party | Candidate | Votes | % | ± | |
|---|---|---|---|---|---|
| Lib-Lab | Charles Fenwick | 5,696 | 66.1 | −9.3 | |
| Conservative | Seymour McCalmont Hill | 2,920 | 33.9 | +9.3 | |
| Majority | 2,776 | 32.2 | −18.6 | ||
| Turnout | 8,616 | 76.2 | +9.4 | ||
| Registered electors | 11,304 | ||||
| Lib-Lab hold | Swing | −9.3 | |||
| Party | Candidate | Votes | % | ± | |
|---|---|---|---|---|---|
| Lib-Lab | Charles Fenwick | 5,629 | 69.9 | +3.8 | |
| Conservative | Joseph John Harris | 2,422 | 30.1 | −3.8 | |
| Majority | 3,207 | 39.8 | +7.6 | ||
| Turnout | 8,051 | 65.8 | −10.4 | ||
| Registered electors | 12,234 | ||||
| Lib-Lab hold | Swing | +3.8 | |||
Elections in the 1900s
| Party | Candidate | Votes | % | ± | |
|---|---|---|---|---|---|
| Lib-Lab | Charles Fenwick | 5,474 | 56.1 | −13.8 | |
| Conservative | J Stanley Appleby | 4,283 | 43.9 | +13.8 | |
| Majority | 1,191 | 12.2 | −27.6 | ||
| Turnout | 9,757 | 68.8 | +3.0 | ||
| Registered electors | 14,179 | ||||
| Lib-Lab hold | Swing | −13.8 | |||
| Party | Candidate | Votes | % | ± | |
|---|---|---|---|---|---|
| Lib-Lab | Charles Fenwick | 10,386 | 76.4 | +20.3 | |
| Conservative | Walter Riddell | 3,210 | 23.6 | −20.3 | |
| Majority | 7,176 | 52.8 | +40.6 | ||
| Turnout | 13,596 | 77.6 | +8.8 | ||
| Registered electors | 17,529 | ||||
| Lib-Lab hold | Swing | +20.3 | |||
Elections in the 1910s
| Party | Candidate | Votes | % | ± | |
|---|---|---|---|---|---|
| Lib-Lab | Charles Fenwick | 10,872 | 70.0 | −6.4 | |
| Conservative | Charles Percy | 4,650 | 30.0 | +6.4 | |
| Majority | 6,222 | 40.0 | −12.8 | ||
| Turnout | 15,522 | 81.6 | +4.0 | ||
| Registered electors | 19,028 | ||||
| Lib-Lab hold | Swing | −6.8 | |||
| Party | Candidate | Votes | % | ± | |
|---|---|---|---|---|---|
| Lib-Lab | Charles Fenwick | Unopposed | |||
| Lib-Lab hold | |||||
General Election 1914/15:
Another General Election was required to take place before the end of 1915. The political parties had been making preparations for an election to take place and by the July 1914, the following candidates had been selected;
- Liberal-Labour:Charles Fenwick
- Labour: William Straker
| Party | Candidate | Votes | % | ± | |
|---|---|---|---|---|---|
| Liberal | Robert Mason | 5,814 | 52.5 | N/A | |
| Independent Labour | Ebenezer Edwards[n 3] | 5,267 | 47.5 | N/A | |
| Majority | 547 | 5.0 | N/A | ||
| Turnout | 11,081 | 51.3 | −30.3 | ||
| Registered electors | 21,602 | ||||
| Liberal hold | Swing | N/A | |||
| Party | Candidate | Votes | % | ± | |
|---|---|---|---|---|---|
| C | Liberal | Robert Mason | 14,065 | 56.9 | N/A |
| Labour | Ebby Edwards | 10,666 | 43.1 | N/A | |
| Majority | 3,399 | 13.8 | N/A | ||
| Turnout | 24,731 | 57.9 | N/A | ||
| Registered electors | 42,750 | ||||
| Liberal gain from Lib-Lab | Swing | N/A | |||
| C indicates candidate endorsed by the coalition government. | |||||
See also
Notes and references
- Notes
- ↑ A county constituency (for the purposes of election expenses and type of returning officer)
- ↑ As with all constituencies, the constituency elects one Member of Parliament (MP) by the first past the post system of election at least every five years.
- ↑ Edwards was the nominee of the Northumberland Miners' Association and was supported by the Miners' Federation of Great Britain. However, due to the War-time electoral pact, he was not endorsed by Labour's national executive
- References
- ↑ "Electorate Figures – Boundary Commission for England". 2011 Electorate Figures. Boundary Commission for England. 4 March 2011. Retrieved 13 March 2011.
- ↑ "'Wansbeck', June 1983 up to May 1997". ElectionWeb Project. Cognitive Computing Limited. Retrieved 14 March 2016.
- ↑ Craig, F.W.S., ed. (1972). Boundaries of parliamentary constituencies 1985-1972. Chichester, Sussex: Political Reference Publications. ISBN 0-900178-09-4.
- ↑ 2010 post-revision map non-metropolitan areas and unitary authorities of England
- ↑ Unemployment claimants by constituency The Guardian
- 1 2 Leigh Rayment's Historical List of MPs – Constituencies beginning with "W" (part 1)
- ↑ "Wansbeck". BBC News. Retrieved 12 June 2017.
- ↑ "Election Data 2015". Electoral Calculus. Archived from the original on 17 October 2015. Retrieved 17 October 2015.
- ↑ "Election Data 2010". Electoral Calculus. Archived from the original on 17 October 2015. Retrieved 17 October 2015.
- ↑ "Election Data 2005". Electoral Calculus. Archived from the original on 15 October 2011. Retrieved 18 October 2015.
- ↑ "Election Data 2001". Electoral Calculus. Archived from the original on 15 October 2011. Retrieved 18 October 2015.
- ↑ "Election Data 1997". Electoral Calculus. Archived from the original on 15 October 2011. Retrieved 18 October 2015.
- ↑ "Election Data 1992". Electoral Calculus. Archived from the original on 15 October 2011. Retrieved 18 October 2015.
- ↑ "Politics Resources". Election 1992. Politics Resources. 9 April 1992. Retrieved 6 Dec 2010.
- ↑ "Election Data 1987". Electoral Calculus. Archived from the original on 15 October 2011. Retrieved 18 October 2015.
- ↑ "Election Data 1983". Electoral Calculus. Archived from the original on 15 October 2011. Retrieved 18 October 2015.
- 1 2 3 4 5 6 The Liberal Year Book, 1907
- ↑ Debrett's House of Commons & Judicial Bench, 1886
- 1 2 3 4 5 6 7 8 Craig, FWS, ed. (1974). British Parliamentary Election Results: 1885-1918. London: Macmillan Press. ISBN 9781349022984.
- ↑ Debrett's House of Commons & Judicial Bench, 1901
- ↑ Debrett's House of Commons & Judicial Bench, 1901
- ↑ Debrett's House of Commons & Judicial Bench, 1916
- ↑ Debrett's House of Commons & Judicial Bench, 1916
- ↑ Craig, F.W.S., ed. (1969). British parliamentary election results 1918-1949. Glasgow: Political Reference Publications. p. 442. ISBN 0-900178-01-9.
Sources
- Craig, F. W. S. (1983) [1969]. British parliamentary election results 1918–1949 (3rd ed.). Chichester: Parliamentary Research Services. ISBN 0-900178-06-X.