Na h-Eileanan an Iar (UK Parliament constituency)
Coordinates: 57°40′16″N 6°57′11″W / 57.671°N 6.953°W
| Na h-Eileanan an Iar | |
|---|---|
|
County constituency for the House of Commons | |
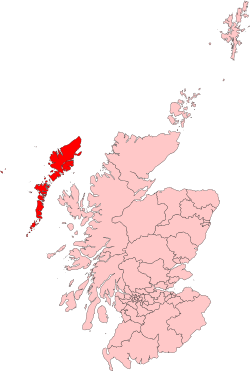 Boundary of Na h-Eileanan an Iar in Scotland. | |
| Subdivisions of Scotland | Na h-Eileanan Siar |
| Electorate | 20,887[1] |
| Current constituency | |
| Created | 1918 |
| Member of parliament | Angus MacNeil (SNP) |
| Created from |
Ross & Cromarty Inverness-shire |
| Overlaps | |
| European Parliament constituency | Scotland |
Na h-Eileanan an Iar (/nə
History
The constituency was formed by merging areas which were formerly within the Ross and Cromarty constituency and the Inverness-shire constituency.
Na h-Eileanan an Iar is the Scottish Gaelic for the Western Isles, which was the constituency's name prior to the 2005 general election. An identical constituency with the same name is used by the Scottish Parliament.
Boundaries
The constituency area is that of the Outer Hebrides, known also as Na h-Eileanan Siar, and the constituency has the smallest electorate in the United Kingdom, one-fifth of the size of the largest, the Isle of Wight, which is also an island constituency. However, the Isle of Wight is a substantially smaller parliamentary constituency in geographical terms. It has been suggested that Na h-Eileanan an Iar could be combined with the Orkney and Shetland constituency: the resulting combined electorate would still be well below the average constituency quota. The Scottish Boundary Commission in 1980 proposed that the seat should be extended to include the Skye and Lochalsh areas; this was overturned at a public enquiry. Generally, considerations of geographical size, a disparate population and convenience for the MPs concerned, as well as tradition and identity, have tended to override the arguments about numerical imbalance. Furthermore, a change in the Boundary Commission's rules in 2000 added a rule which forbade Orkney or Shetland being combined with another council area. In 2011, the Parliamentary Voting System and Constituencies Act 2011 was introduced, which prevented both Na h-Eileanan an Iar and Orkney and Shetland from being combined with any other constituency.[2]
Local government areas
When created, the area of the constituency was divided between two local government areas: the counties of Ross and Cromarty and Inverness-shire. The division line was the Lewis-Harris boundary, with Lewis in Ross and Cromarty and Harris in Inverness-shire.
In 1975 the constituency area became also an island council area, known as the Western Isles council area. That same area became one of the 32 unitary council areas of Scotland in 1996. The council area is known also as Na h-Eileanan Siar.
Politics
The seat has been a two-way marginal between the Labour Party and the Scottish National Party for many years. Until 2015, it became increasingly safe for the Scottish National Party. This trend was reversed in the 2017 general election, when the SNP suffered a swing against them for the first time since 1997.
During the Scottish independence referendum, 2014 the constituency voted against independence by a margin of 53.42% (10,544) to 46.58% (9,195) in favour on a turnout of 86.2%[3]
Members of Parliament
Election results
Elections of the 2010s
| Party | Candidate | Votes | % | ± | |
|---|---|---|---|---|---|
| SNP | Angus MacNeil | 6,013 | 40.6 | -13.7 | |
| Labour | Ealasaid MacDonald | 5,006 | 33.8 | +5.2 | |
| Conservative | Daniel McCroskrie | 2,441 | 16.5 | +8.9 | |
| Scottish Christian | John Cormack | 1,108 | 7.5 | +0.9 | |
| Liberal Democrat | James Paterson | 250 | 1.7 | -1.2 | |
| Majority | 1,007 | 6.8 | -18.9 | ||
| Turnout | 14,818 | 69.7 | -3.5 | ||
| SNP hold | Swing | -9.5 | |||
| Party | Candidate | Votes | % | ± | |
|---|---|---|---|---|---|
| SNP | Angus MacNeil | 8,662 | 54.3 | +8.6 | |
| Labour | Alasdair Morrison | 4,560 | 28.6 | −4.3 | |
| Conservative | Mark Brown | 1,215 | 7.6 | +3.2 | |
| Scottish Christian | John Cormack | 1,045 | 6.6 | n/a | |
| Liberal Democrat | Ruaraidh Ferguson | 456 | 2.9 | −4.6 | |
| Majority | 4,102 | 25.7 | +12.9 | ||
| Turnout | 15,938 | 73.2 | +7.1 | ||
| SNP hold | Swing | +6.5 | |||
| Party | Candidate | Votes | % | ± | |
|---|---|---|---|---|---|
| SNP | Angus MacNeil | 6,723 | 45.7 | +0.8 | |
| Labour | Donald MacSween | 4,838 | 32.9 | −1.6 | |
| Independent | Murdo Murray | 1,412 | 9.6 | N/A | |
| Liberal Democrat | Jean Davis | 1,097 | 7.5 | −0.5 | |
| Conservative | Sheena Norquay | 647 | 4.4 | +0.0 | |
| Majority | 1,885 | 12.8 | |||
| Turnout | 14,717 | 66.1 | +0.7 | ||
| SNP hold | Swing | +1.2 | |||
Elections of the 2000s
| Party | Candidate | Votes | % | ± | |
|---|---|---|---|---|---|
| SNP | Angus MacNeil | 6,213 | 44.9 | +8.0 | |
| Labour | Calum MacDonald | 4,772 | 34.5 | −10.5 | |
| Liberal Democrat | Jean Davis | 1,096 | 7.9 | +1.4 | |
| Christian Vote | George Hargreaves | 1,048 | 7.6 | N/A | |
| Conservative | Andy Maciver | 610 | 4.4 | −5.1 | |
| Scottish Socialist | Joanne Telfer | 97 | 0.7 | −1.5 | |
| Majority | 1,441 | 10.4 | |||
| Turnout | 13,836 | 64.1 | +4.0 | ||
| SNP gain from Labour | Swing | +9.3 | |||
| Party | Candidate | Votes | % | ± | |
|---|---|---|---|---|---|
| Labour | Calum MacDonald | 5,924 | 45.0 | −10.6 | |
| SNP | Alasdair Nicholson | 4,850 | 36.9 | +3.5 | |
| Conservative | Douglas Taylor | 1,250 | 9.5 | +2.8 | |
| Liberal Democrat | John Horne | 849 | 6.5 | +3.4 | |
| Scottish Socialist | Joanne Telfer | 286 | 2.2 | N/A | |
| Majority | 1,074 | 8.1 | |||
| Turnout | 13,159 | 60.6 | −9.5 | ||
| Labour hold | Swing | ||||
Elections of the 1990s
| Party | Candidate | Votes | % | ± | |
|---|---|---|---|---|---|
| Labour | Calum MacDonald | 8,955 | 55.6 | ||
| SNP | Anne Lorne Gillies | 5,379 | 33.4 | ||
| Conservative | Jamie McGrigor | 1,071 | 6.6 | ||
| Liberal Democrat | Neil Mitchison | 495 | 3.1 | ||
| Referendum | Ralph Lionel | 206 | 1.3 | N/A | |
| Majority | 3,576 | 22.2 | |||
| Turnout | 16,106 | 70.1 | |||
| Labour hold | Swing | ||||
| Party | Candidate | Votes | % | ± | |
|---|---|---|---|---|---|
| Labour | Calum MacDonald | 7,664 | 47.8 | +5.1 | |
| SNP | Frances M. MacFarlane | 5,961 | 37.2 | +8.7 | |
| Conservative | Robert J. Heany | 1,362 | 8.5 | ||
| Liberal Democrat | Neil Mitchison | 552 | 3.4 | ||
| Independent | Andrew R. Price | 491 | 3.1 | N/A | |
| Majority | 1,703 | 10.6 | |||
| Turnout | 16,030 | 70.4 | |||
| Labour hold | Swing | ||||
Elections of the 1980s
| Party | Candidate | Votes | % | ± | |
|---|---|---|---|---|---|
| Labour | Calum MacDonald | 7,041 | 42.7 | +12.6 | |
| SNP | Ian Smith | 4,701 | 28.5 | −26.0 | |
| Social Democratic | Kenneth MacIver | 3,419 | 20.7 | ||
| Conservative | Murdo Morrison | 1,336 | 8.1 | −1.5 | |
| Majority | 2,340 | 14.2 | |||
| Turnout | 70.2 | ||||
| Labour gain from SNP | Swing | ||||
| Party | Candidate | Votes | % | ± | |
|---|---|---|---|---|---|
| SNP | Donald Stewart | 8,272 | 54.5 | ||
| Labour | Brian Wilson | 4,560 | 30.1 | ||
| Conservative | Murdo Morrison | 1,460 | 9.6 | ||
| Liberal | Neil M. MacLeod | 876 | 5.8 | ||
| Majority | 3,712 | 24.5 | |||
| Turnout | 66.5 | ||||
| SNP hold | Swing | ||||
Elections of the 1970s
| Party | Candidate | Votes | % | ± | |
|---|---|---|---|---|---|
| SNP | Donald Stewart | 7,941 | 52.5 | ||
| Labour | Alexander Matheson[17] | 4,878 | 32.3 | ||
| Conservative | Murdo Morrison[17] | 1,600 | 10.6 | ||
| Liberal | Neil Munro MacLeod[17] | 700 | 4.6 | ||
| Majority | 3,063 | 20.2 | |||
| Turnout | 67.5 | ||||
| SNP hold | Swing | ||||
| Party | Candidate | Votes | % | ± | |
|---|---|---|---|---|---|
| SNP | Donald Stewart | 8,758 | 61.45 | ||
| Labour | Mary Doig | 3,526 | 24.74 | ||
| Conservative | Norman K. Wilson[17] | 1,180 | 8.28 | ||
| Liberal | Neil Macmillan [17] | 789 | 5.54 | ||
| Majority | 5,232 | 36.71 | |||
| Turnout | 63.41 | ||||
| SNP hold | Swing | ||||
| Party | Candidate | Votes | % | ± | |
|---|---|---|---|---|---|
| SNP | Donald Stewart | 10,079 | 67.05 | ||
| Labour | Andrew W. Wilson[17] | 2,879 | 19.15 | ||
| Conservative | John Mackay | 1,042 | 6.93 | ||
| United Labour Party | Malcolm Macmillan | 1,031 | 6.86 | ||
| Majority | 7,200 | 47.90 | |||
| Turnout | 66.27 | ||||
| SNP hold | Swing | ||||
| Party | Candidate | Votes | % | ± | |
|---|---|---|---|---|---|
| SNP | Donald Stewart | 6,568 | 43.12 | ||
| Labour | Malcolm Macmillan | 5,842 | 38.35 | ||
| Conservative | Roderick Murray MacLeod[17] | 2,812 | 18.53 | ||
| Majority | 726 | 4.77 | |||
| Turnout | 23,533 | 64.73 | |||
| SNP gain from Labour | Swing | ||||
Elections of the 1960s
| Party | Candidate | Votes | % | ± | |
|---|---|---|---|---|---|
| Labour | Malcolm Macmillan | 8,565 | 61.03 | ||
| Conservative | Charles Alexander Cameron | 2,832 | 20.18 | ||
| Liberal | John Francis Matheson Macleod | 2,638 | 18.80 | ||
| Majority | 5,733 | 40.85 | |||
| Turnout | 61.49 | ||||
| Labour hold | Swing | ||||
| Party | Candidate | Votes | % | ± | |
|---|---|---|---|---|---|
| Labour | Malcolm Macmillan | 8,740 | 55.14 | ||
| Liberal | Donny MacLeod | 4,894 | 30.88 | ||
| Unionist | Charles Alexander Cameron | 2,217 | 13.99 | ||
| Majority | 3,846 | 24.26 | |||
| Turnout | 66.88 | ||||
| Labour hold | Swing | ||||
Elections of the 1950s
| Party | Candidate | Votes | % | ± | |
|---|---|---|---|---|---|
| Labour | Malcolm Macmillan | 8,663 | 53.61 | ||
| National Liberal and Conservative | Donny MacLeod | 7,496 | 46.39 | ||
| Majority | 1,167 | 7.22 | |||
| Turnout | 64.18 | ||||
| Labour hold | Swing | ||||
| Party | Candidate | Votes | % | ± | |
|---|---|---|---|---|---|
| Labour | Malcolm Macmillan | 8,487 | 48.77 | ||
| National Liberal and Conservative | John C Frame | 6,315 | 42.66 | ||
| Majority | 2,172 | 14.67 | |||
| Turnout | 59.55 | ||||
| Labour hold | Swing | ||||
| Party | Candidate | Votes | % | ± | |
|---|---|---|---|---|---|
| Labour | Malcolm Macmillan | 8,039 | 48.77 | ||
| Conservative and National Liberal | John Mitchell | 6,709 | 40.70 | ||
| Liberal | David Murray | 916 | 5.56 | ||
| SNP | Calum Maclean | 820 | 4.97 | ||
| Majority | 1,330 | 8.07 | |||
| Turnout | 60.55 | ||||
| Labour hold | Swing | ||||
| Party | Candidate | Votes | % | ± | |
|---|---|---|---|---|---|
| Labour | Malcolm Macmillan | 8,387 | 53.21 | ||
| Liberal | Huntley McDonald Sinclair | 6,950 | 44.09 | ||
| Scottish Home Rule | David Murray | 425 | 2.70 | ||
| Majority | 1,437 | 9.12 | |||
| Turnout | 55.7 | ||||
| Labour hold | Swing | ||||
Elections of the 1940s
| Party | Candidate | Votes | % | ± | |
|---|---|---|---|---|---|
| Labour | Malcolm Macmillan | 5,914 | 45.7 | +4.7 | |
| Liberal | Huntly McDonald Sinclair | 4,277 | 33.0 | ||
| Unionist | Iain Macleod | 2,756 | 21.3 | ||
| Majority | 1,637 | 12.7 | +2.6 | ||
| Turnout | 12,947 | 53.3 | +6.5 | ||
| Labour hold | Swing | ||||
Elections of the 1930s
| Party | Candidate | Votes | % | ± | |
|---|---|---|---|---|---|
| Labour | Malcolm Macmillan | 5,421 | 41.0 | ||
| Liberal National | Thomas Ramsay | 4,076 | 30.9 | -23.9 | |
| SNP | Alexander MacEwan | 3,704 | 28.1 | ||
| Majority | 1,345 | 10.1 | |||
| Turnout | 12,947 | 46.8 | +8.0 | ||
| Labour gain from Liberal National | Swing | ||||
| Party | Candidate | Votes | % | ± | |
|---|---|---|---|---|---|
| Liberal National | Thomas Ramsay | 5,793 | 54.8 | +10.7 | |
| Unionist | Iain MacAlisdair Moffatt-Pender | 4,785 | 45.2 | +21.8 | |
| Majority | 1,008 | 9.6 | -2.0 | ||
| Turnout | 10,578 | 36.8 | -3.7 | ||
| Liberal National hold | Swing | ||||
Elections of the 1920s
| Party | Candidate | Votes | % | ± | |
|---|---|---|---|---|---|
| Liberal | Thomas Ramsay | 4,877 | 44.1 | -10.1 | |
| Labour | John M MacDiarmid | 3,589 | 32.5 | +15.3 | |
| Unionist | Iain MacAlisdair Moffatt-Pender | 2,593 | 23.4 | -5.2 | |
| Majority | 1,288 | 21.6 | -14.0 | ||
| Turnout | 11,059 | 40.5 | +1.4 | ||
| Liberal hold | Swing | -12.7 | |||
| Party | Candidate | Votes | % | ± | |
|---|---|---|---|---|---|
| Liberal | Alexander Livingstone | 4,579 | 54.2 | 14.6 | |
| Unionist | William Morrison | 2,318 | 28.6 | -8.3 | |
| Labour | A. G. Burns | 1,454 | 17.2 | ||
| Majority | 2,161 | 25.6 | +22.9 | ||
| Turnout | 8,451 | 39.1 | -1.0 | ||
| Liberal hold | Swing | 11.5 | |||
| Party | Candidate | Votes | % | ± | |
|---|---|---|---|---|---|
| Liberal | Alexander Livingstone | 3,391 | 39.6 | -6.3 | |
| Unionist | William Morrison | 3,158 | 36.9 | n/a | |
| Independent Labour | Hugh McCowan | 2,011 | 23.5 | n/a | |
| Majority | 233 | 2.7 | -5.5 | ||
| Turnout | 6,549 | 40.1 | -14.0 | ||
| Liberal gain from National Liberal | Swing | n/a | |||
| Party | Candidate | Votes | % | ± | |
|---|---|---|---|---|---|
| National Liberal | William Cotts | 6,177 | 54.1 | +11.6 | |
| Liberal | Donald Murray | 5,238 | 45.9 | -1.4 | |
| Majority | 939 | 8.2 | +3.4 | ||
| Turnout | 11,415 | 54.1 | +10.5 | ||
| National Liberal gain from Liberal | Swing | 6.5 | |||
Elections of the 1910s
| Party | Candidate | Votes | % | ± | |
|---|---|---|---|---|---|
| Liberal | Donald Murray | 3,765 | 47.3 | ||
| Coalition Liberal | William Cotts | 3,375 | 42.5 | ||
| Highland Land League | Hugh MacGowan | 809 | 10.2 | ||
| Majority | 390 | 4.8 | |||
| Turnout | 7,949 | 43.6 | |||
References
- ↑ Office for National Statistics (24 February 2016). "Parliamentary Electors by Parliamentary Constituencies 2010–2015". Retrieved 17 February 2017.
- ↑ The Parliamentary Voting System and Constituencies Act 2011 Section 11
- ↑ "Scottish independence referendum - Results -". BBC News. 2014-09-19. Retrieved 2017-03-31.
- ↑ Leigh Rayment's Historical List of MPs – Constituencies beginning with "W" (part 2)
- ↑ Leigh Rayment's Historical List of MPs – Constituencies beginning with "N" (part 1)
- ↑
- ↑ "Election Data 2015". Electoral Calculus. Archived from the original on 17 October 2015. Retrieved 17 October 2015.
- ↑ "Comhairle nan Eilean Siar - Election Office (UK Parliamentary Elections)". Cne-siar.gov.uk. Retrieved 2017-03-31.
- ↑ "Election Data 2010". Electoral Calculus. Archived from the original on 17 October 2015. Retrieved 17 October 2015.
- ↑ "Election 2010: Na H-Eileanan An Iar (Western Isles)", BBC News
- ↑ "Election Data 2005". Electoral Calculus. Archived from the original on 15 October 2011. Retrieved 18 October 2015.
- ↑ "Election Data 2001". Electoral Calculus. Archived from the original on 15 October 2011. Retrieved 18 October 2015.
- ↑ "Election Data 1997". Electoral Calculus. Archived from the original on 15 October 2011. Retrieved 18 October 2015.
- ↑ "Election Data 1992". Electoral Calculus. Archived from the original on 15 October 2011. Retrieved 18 October 2015.
- ↑ "Election Data 1987". Electoral Calculus. Archived from the original on 15 October 2011. Retrieved 18 October 2015.
- ↑ "Election Data 1983". Electoral Calculus. Archived from the original on 15 October 2011. Retrieved 18 October 2015.
- 1 2 3 4 5 6 7 Stornoway Gazette
- ↑ Kimber's UK General Election results 1974 (Oct)
- ↑ Kimber's UK General Election results 1974 (Feb)
- ↑ Kimber's UK General Election results 1970
- ↑ Kimber's UK General Election results 1966
- ↑ Kimber's UK General Election results 1964
- ↑ "Election results" (TXT). Tools.assembla.com. Retrieved 2017-05-24.
- ↑ "Election results" (TXT). Tools.assembla.com. Retrieved 2017-05-24.
- ↑ "Election results" (TXT). Tools.assembla.com. Retrieved 2017-05-24.
- ↑ Whitaker's Almanack, 1939
- ↑ Whitaker's Almanack, 1934
- ↑ Whitaker's Almanack, 1920