Arundel and South Downs (UK Parliament constituency)
Coordinates: 51°51′22″N 0°33′32″W / 51.856°N 0.559°W
| Arundel and South Downs | |
|---|---|
|
County constituency for the House of Commons | |
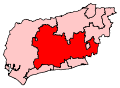 Boundary of Arundel and South Downs in West Sussex. | |
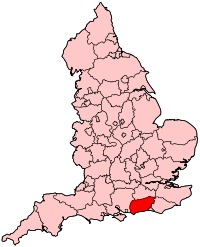 Location of West Sussex within England. | |
| County | West Sussex |
| Population | 97,267 (2011 census)[1] |
| Electorate | 76,697 (December 2010)[2] |
| Major settlements | Arundel, Hassocks, Petworth, Pulborough and Steyning |
| Current constituency | |
| Created | 1997 |
| Member of parliament | Nick Herbert (Conservative) |
| Number of members | One |
| Created from | Arundel and Horsham |
| Overlaps | |
| European Parliament constituency | South East England |
Arundel and South Downs (/ˈærʊndəl/) is a constituency[n 1] created in 1997, represented in the House of Commons of the UK Parliament since 2005 by Nick Herbert of the Conservative Party.[n 2]
Boundaries
The constituency contains the town of Arundel and villages and hamlets within the South Downs national park boundaries or encircled by the park, the largest of which are Hassocks, Hurstpierpoint, Petworth, Pulborough, Steyning (/stɛnɪŋ/) and Storrington.
- 2010 – reviewed boundaries adopted
Following their review of parliamentary boundaries in West Sussex which Parliament approved in 2007, the Boundary Commission for England formed new constituencies. First contested in 2010 the seat was constituted as follows:
| Wards of the United Kingdom | In district/borough of: |
|---|---|
| Angmering, Arundel, Barnham, Findon, and Walberton | Arun |
| Bury, Petworth, and Wisborough Green | Chichester |
| Bramber, Upper Beeding and Woodmancote, Chanctonbury, Chantry, Cowfold,Partridge Green, Shermanbury and West Grinstead, Henfield, Pulborough and Coldwaltham, and Steyning | Horsham |
| Hassocks, and Hurstpierpoint and Downs. | Mid Sussex |
In their recommendations, the Boundary Commission for England mooted the name Chanctonbury after uninhabited Chanctonbury Ring, an ancient hill fort at its centre. This name was rejected during the local inquiry process at which the current name was chosen.[3]
History
- Results since 1997 (creation)
The 2015 result gave the victor for the seat an increased margin versus the runner up relative to the previous election — at 44.8% of votes over the closest runner-up, the majority is approximately double the smallest majority since the 1997 formation of the seat. It made the seat the 8th safest of the Conservative Party's 331 seats by percentage of majority.[4]
- De-selection of incumbent seeking re-election in 2005
The incumbent Howard Flight MP had national media coverage in the run-up to the 2005 general election due to his deselection requested by the party leader for membership of Conservative Way Forward, lobbying for spending cuts to be more severe than set out in the small cuts in the 2005 manifesto. Flight hinted his preferred cuts would be as implemented by a Conservative government in his view. He had represented the constituency since its creation at the 1997 general election. Anne Marie Morris, Laura Sandys and Nick Herbert put themselves forward for nomination as replacement candidates. The chosen candidate, Nick Herbert, won the seat at the election.[5] Morris and Sandys became MPs elsewhere in 2010.
- Predecessor seats
Arundel and South Downs and its predecessor seats have in the 20th century been a Conservative Party stronghold save that the minor contributory Horsham seat to the area's electorate saw victory by 8.6% of the vote over the Labour Party in 1966, followed statistically by a next-most-marginal victory again with the Labour Party as runner-up, in 1950, of 14.4%.
Between 1974 and 1983, much of the South Downs area was part of the Shoreham constituency, with the town of Arundel remaining in the Arundel constituency.
Prior to 1974, the seat was largely part of the Arundel and Shoreham constituency.
Members of Parliament
| Election | Member[6] | Party | |
|---|---|---|---|
| 1997 | Howard Flight | Conservative | |
| 2005 | Nick Herbert | Conservative | |
Elections
Elections in the 2010s
| Party | Candidate | Votes | % | ± | |
|---|---|---|---|---|---|
| Conservative | Nick Herbert | 37,573 | 62.4 | +1.6 | |
| Labour | Caroline Fife | 13,690 | 22.7 | +11.5 | |
| Liberal Democrat | Shweta Kapadia | 4,783 | 7.9 | +0.7 | |
| Green | Jo Prior | 2,542 | 4.2 | −2.2 | |
| UKIP | John Wallace | 1,668 | 2.8 | −11.7 | |
| Majority | 23,883 | 39.7 | −6.6 | ||
| Turnout | 60,256 | 74.6 | +1.5 | ||
| Conservative hold | Swing | -4.95 | |||
| Party | Candidate | Votes | % | ± | |
|---|---|---|---|---|---|
| Conservative | Nick Herbert | 34,331 | 60.8 | +3.0 | |
| UKIP | Peter Grace | 8,154 | 14.4 | +8.8 | |
| Labour | Christopher Wellbelove | 6,324 | 11.2 | +2.6 | |
| Liberal Democrat | Shweta Kapadia | 4,062 | 7.2 | −20.7 | |
| Green | Isabel Thurston | 3,606 | 6.4 | +6.4 | |
| Majority | 26,177 | 46.3 | +16.4 | ||
| Turnout | 56,477 | 73.1 | +0.9 | ||
| Conservative hold | Swing | +2.9 | |||
| Party | Candidate | Votes | % | ± | |
|---|---|---|---|---|---|
| Conservative | Nick Herbert | 32,333 | 57.8 | +8.0 | |
| Liberal Democrat | Derek Deedman | 15,642 | 27.9 | +0.8 | |
| Labour | Tim Lunnon | 4,835 | 8.6 | −8.5 | |
| UKIP | Stuart Bower | 3,172 | 5.7 | +0.3 | |
| Majority | 16,691 | 29.9 | |||
| Turnout | 55,982 | 72.2 | +1.4 | ||
| Conservative hold | Swing | +3.6 | |||
Elections in the 2000s
| Party | Candidate | Votes | % | ± | |
|---|---|---|---|---|---|
| Conservative | Nick Herbert | 24,752 | 49.8 | −2.4 | |
| Liberal Democrat | Derek Deedman | 13,443 | 27.1 | +4.7 | |
| Labour | Sharon Whitlam | 8,482 | 17.1 | −3.6 | |
| UKIP | Andrew Moffat | 2,700 | 5.4 | +0.7 | |
| Protest Vote Party | Mark Stack | 313 | 0.6 | +0.6 | |
| Majority | 11,309 | 22.8 | |||
| Turnout | 49,690 | 68.5 | 3.8 | ||
| Conservative hold | Swing | −3.5 | |||
| Party | Candidate | Votes | % | ± | |
|---|---|---|---|---|---|
| Conservative | Howard Flight | 23,969 | 52.2 | −0.9 | |
| Liberal Democrat | Derek R. Deedman | 10,265 | 22.4 | −3.4 | |
| Labour | Charles S. Taylor | 9,488 | 20.7 | +2.4 | |
| UKIP | Robert Perrin | 2,167 | 4.7 | +1.8 | |
| Majority | 13,704 | 29.8 | |||
| Turnout | 45,889 | 64.7 | −10.8 | ||
| Conservative hold | Swing | +1.25 | |||
Elections in the 1990s
| Party | Candidate | Votes | % | ± | |
|---|---|---|---|---|---|
| Conservative | Howard Flight | 27,251 | 53.1 | N/A | |
| Liberal Democrat | John Goss | 13,216 | 25.7 | N/A | |
| Labour | Richard Black | 9,376 | 18.3 | N/A | |
| UKIP | James Herbert | 1,494 | 2.9 | N/A | |
| Majority | 14,035 | 27.3 | N/A | ||
| Turnout | 51,337 | 75.5 | N/A | ||
| Conservative win (new seat) | |||||
See also
Notes and references
- Notes
- ↑ A county constituency (for the purposes of election expenses and type of returning officer)
- ↑ As with all constituencies, the constituency elects one Member of Parliament (MP) by the first past the post system of election at least every five years.
- References
- ↑ "Usual Resident Population, 2011". Neighbourhood Statistics. Office for National Statistics. Retrieved 26 January 2015.
- ↑ "Electorate Figures – Boundary Commission for England". 2011 Electorate Figures. Boundary Commission for England. 4 March 2011. Archived from the original on 6 November 2010. Retrieved 13 March 2011.
- ↑ Boundary Commission for England, fourth periodic report, 1995
- ↑ "List of Conservative MPs elected in 2015 by % majority". UK Political.info. Retrieved 29 January 2017.
- ↑ "BBC NEWS - UK - Politics - Tory shortlist to replace Flight". newsrss.bbc.co.uk.
- ↑ Leigh Rayment's Historical List of MPs – Constituencies beginning with "A" (part 3)
- ↑ "Election Data 2015". Electoral Calculus. Archived from the original on 17 October 2015. Retrieved 17 October 2015.
- ↑ "Election Data 2010". Electoral Calculus. Archived from the original on 26 July 2013. Retrieved 17 October 2015.
- ↑ "Election Data 2005". Electoral Calculus. Archived from the original on 15 October 2011. Retrieved 18 October 2015.
- ↑ "Election Data 2001". Electoral Calculus. Archived from the original on 15 October 2011. Retrieved 18 October 2015.
- ↑ "Election Data 1997". Electoral Calculus. Archived from the original on 15 October 2011. Retrieved 18 October 2015.
Sources
- Election result, 2005 (BBC)
- Election results, 1997 – 2001 (BBC)
- Election results, 1997 – 2001 (Election Demon)
- Election results, 1997 – 2005 (Guardian)