Woking (UK Parliament constituency)
| Woking | |
|---|---|
|
Borough constituency for the House of Commons | |
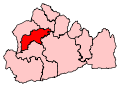 Boundary of Woking in Surrey. | |
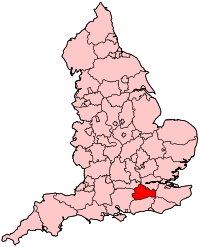 Location of Surrey within England. | |
| County | Surrey |
| Electorate | 74,328 (December 2010) |
| Current constituency | |
| Created | 1950 |
| Member of parliament | Jonathan Lord (Conservative) |
| Created from | Chertsey and Farnham |
| Overlaps | |
| European Parliament constituency | South East England |
Woking is a constituency created in 1950 represented in the House of Commons of the UK Parliament. To date it has elected at each election the Conservative Party candidate.
History
It was created in 1950 from the county constituencies of Chertsey and lightly populated parts of Farnham.[n 1]
With exceptions in 1974 (February election), 1997, 2005 and 2010, when the majority was less, Woking has returned a Conservative candidate whose majority has exceeded 15% of the votes cast, with a Liberal Democrat the runner-up in the five general elections until 2015 when a Labour candidate polled second place. Its MP since 2010 is Jonathan Lord. The narrowest margin of victory was 11.2% of the vote, in 1997, its most marginal result. The 2015 result made the seat the 41st-safest of the Conservative Party's 331 seats by percentage of majority.[1]
There are a number of Liberal Democrat councillors locally and one Labour-voting ward (Canalside), but the Conservatives usually hold the majority of the wards comfortably.
Boundaries
- 1950–74: The Urban Districts of Frimley and Camberley, and Woking, and in the Rural District of Guildford the parishes of Ash, Normandy, and Pirbright.
- 1974–83: as above less Frimley and Camberley. Note in 1974 the areas became parts of Woking (borough) and Guildford (borough).
- 1983–97: unchanged (i.e. The Borough of Woking, and the Borough of Guildford wards of Ash, Ash Vale, Normandy, and Pirbright.)
- 1997–present: as above less Ash and Ash Vale
The 1974-recipient seat of Frimley and Camberley was North West Surrey (abolished in 1997). The 1997-recipient of Ash and Ash Vale was Surrey Heath. The constituency is based around the town of Woking in Surrey. The Boundary Commission for England made no boundary changes for Woking in the review before the 2010 general election.
Members of Parliament
| Election | Member[2] | Party | |
|---|---|---|---|
| 1950 | Harold Watkinson | Conservative | |
| 1951 | |||
| 1955 | |||
| 1959 | |||
| 1964 | Sir Cranley Onslow | Conservative | |
| 1966 | |||
| 1970 | |||
| 1974 Feb | |||
| 1974 Oct | |||
| 1979 | |||
| 1983 | |||
| 1987 | |||
| 1992 | |||
| 1997 | Humfrey Malins | Conservative | |
| 2001 | |||
| 2005 | |||
| 2010 | Jonathan Lord | Conservative | |
| 2015 | |||
| 2017 | |||
Elections
Elections in the 2010s
| Party | Candidate | Votes | % | ± | |
|---|---|---|---|---|---|
| Conservative | Jonathan Lord | 29,903 | 54.1 | -2.1 | |
| Labour | Fiona Colley | 13,179 | 23.9 | +7.7 | |
| Liberal Democrat | Will Forster | 9,711 | 17.6 | +5.9 | |
| UKIP | Troy de Leon | 1,161 | 2.1 | -9.2 | |
| Green | James Brierley | 1,092 | 2.0 | -2.1 | |
| Independent | Hassan Akberali | 200 | 0.4 | N/A | |
| Majority | 16,724 | 30.2 | -9.8 | ||
| Turnout | 55,246 | 72.5 | +2.5 | ||
| Conservative hold | Swing | -4.9 | |||
| Party | Candidate | Votes | % | ± | |
|---|---|---|---|---|---|
| Conservative | Jonathan Lord | 29,199 | 56.2 | +5.9 | |
| Labour | Jill Rawling | 8,389 | 16.1 | +8.1 | |
| Liberal Democrat | Chris Took | 6,047 | 11.6 | −25.8 | |
| UKIP | Rob Burberry | 5,873 | 11.3 | +7.5 | |
| Green | Martin Robson | 2,109 | 4.1 | N/A | |
| CISTA | Declan Wade | 229 | 0.4 | N/A | |
| Magna Carta Conservation Party Great Britain | Ruth Temple | 77 | 0.1 | N/A | |
| The Evolution Party | Angela Woolford | 41 | 0.1 | N/A | |
| Majority | 20,810 | 40.0 | +27.1 | ||
| Turnout | 51,964 | 70.0 | −1.5 | ||
| Conservative hold | Swing | −1.1 | |||
On 9 June 2015, it was announced that the 2015 election result had been challenged by the Magna Carta Conservation Party candidate, Ruth Temple. Temple claimed in her petition that Jonathan Lord had been ineligible to stand and was thus not duly elected.[6][7]
| Party | Candidate | Votes | % | ± | |
|---|---|---|---|---|---|
| Conservative | Jonathan Lord | 26,551 | 50.3 | +2.9 | |
| Liberal Democrat | Rosie Sharpley | 19,744 | 37.4 | +4.3 | |
| Labour | Tom Miller | 4,246 | 8.0 | −8.3 | |
| UKIP | Rob Burberry | 1,997 | 3.8 | +0.9 | |
| Peace | Julie Roxburgh | 204 | 0.4 | N/A | |
| Magna Carta Conservation Party Great Britain | Ruth Temple | 44 | 0.1 | N/A | |
| Majority | 6,807 | 12.9 | −1.5 | ||
| Turnout | 52,786 | 71.5 | +8.1 | ||
| Conservative hold | Swing | −0.7 | |||
Elections in the 2000s
| Party | Candidate | Votes | % | ± | |
|---|---|---|---|---|---|
| Conservative | Humfrey Malins | 21,838 | 47.4 | +1.4 | |
| Liberal Democrat | Anne Lee | 15,226 | 33.1 | +2.8 | |
| Labour | Ellie Blagbrough | 7,507 | 16.3 | −4.0 | |
| UKIP | Matthew Davies | 1,324 | 2.9 | −0.5 | |
| UK Community Issues Party | Michael Osman | 150 | 0.3 | N/A | |
| Majority | 6,612 | 14.4 | -1.3 | ||
| Turnout | 46,045 | 63.4 | +3.2 | ||
| Conservative hold | Swing | −0.7 | |||
| Party | Candidate | Votes | % | ± | |
|---|---|---|---|---|---|
| Conservative | Humfrey Malins | 19,747 | 46.0 | +7.6 | |
| Liberal Democrat | Alan Hilliar | 12,988 | 30.3 | +3.0 | |
| Labour | Sabir Hussain | 8,714 | 20.3 | −0.7 | |
| UKIP | Michael Harvey | 1,461 | 3.4 | +2.4 | |
| Majority | 6,759 | 15.7 | +4.5 | ||
| Turnout | 42,910 | 60.2 | −12.5 | ||
| Conservative hold | Swing | +2.3 | |||
Elections in the 1990s
| Party | Candidate | Votes | % | ± | |
|---|---|---|---|---|---|
| Conservative | Humfrey Malins | 19,553 | 38.4 | −20.7 | |
| Liberal Democrat | Philip Goldenberg | 13,875 | 27.3 | +0.2 | |
| Labour | Katie Hanson | 10,695 | 21.0 | +7.6 | |
| Ind. Conservative | Hugh Bell | 3,933 | 7.7 | N/A | |
| Referendum | Christopher Skeate | 2,209 | 4.3 | N/A | |
| UKIP | Michael Harvey | 512 | 1.0 | N/A | |
| Natural Law | Deirdre Sleeman | 137 | 0.3 | -0.2 | |
| Majority | 5,678 | 11.2 | -19.8 | ||
| Turnout | 50,914 | 72.7 | -6.5 | ||
| Conservative hold | Swing | -10.3 | |||
This constituency underwent boundary changes between the 1992 and 1997 general elections and thus change in share of vote is based on a notional calculation.
| Party | Candidate | Votes | % | ± | |
|---|---|---|---|---|---|
| Conservative | Cranley Onslow | 37,744 | 58.9 | +0.9 | |
| Liberal Democrat | Dorothy A. Buckrell | 17,902 | 28.0 | −3.4 | |
| Labour | James M. Dalgleish | 8,080 | 12.6 | +2.1 | |
| Natural Law | Teresa A. Macintyre | 302 | 0.5 | N/A | |
| Majority | 19,842 | 31.0 | +4.3 | ||
| Turnout | 64,028 | 79.2 | +4.1 | ||
| Conservative hold | Swing | +2.1 | |||
Elections in the 1980s
| Party | Candidate | Votes | % | ± | |
|---|---|---|---|---|---|
| Conservative | Cranley Onslow | 35,990 | 58.1 | -0.2 | |
| SDP–Liberal Alliance (Liberal) | Philip Goldenberg | 19,446 | 31.4 | +2.0 | |
| Labour | Anita Pollack | 6,537 | 10.5 | -1.2 | |
| Majority | 16,544 | 26.7 | -2.2 | ||
| Turnout | 61,973 | 75.1 | +3.4 | ||
| Conservative hold | Swing | -1.1 | |||
| Party | Candidate | Votes | % | ± | |
|---|---|---|---|---|---|
| Conservative | Cranley Onslow | 32,748 | 58.3 | +1.2 | |
| SDP–Liberal Alliance (Liberal) | Philip Goldenberg | 16,511 | 29.4 | +11.4 | |
| Labour | Barbara Broer | 6,566 | 11.7 | -6.3 | |
| Party of Associates with Licensees | D. M. Comens | 368 | 0.6 | N/A | |
| Majority | 16,237 | 28.9 | -4.2 | ||
| Turnout | 56,193 | 71.7 | -4.8 | ||
| Conservative hold | Swing | -5.1 | |||
Elections in the 1970s
| Party | Candidate | Votes | % | ± | |
|---|---|---|---|---|---|
| Conservative | Cranley Onslow | 31,719 | 57.05 | +11.01 | |
| Labour | Nigel Beard | 13,327 | 23.97 | +0.27 | |
| Liberal | George H. Dunk | 9,991 | 17.97 | -10.43 | |
| National Front | P. A. Gleave | 564 | 1.01 | -0.85 | |
| Majority | 18,392 | 33.08 | +15.44 | ||
| Turnout | 55,601 | 76.51 | +3.58 | ||
| Conservative hold | Swing | +5.4 | |||
| Party | Candidate | Votes | % | ± | |
|---|---|---|---|---|---|
| Conservative | Cranley Onslow | 22,804 | 46.04 | -0.29 | |
| Liberal | P. Wade | 14,069 | 28.40 | -4.01 | |
| Labour | J. W. Tattersall | 11,737 | 23.70 | +2.44 | |
| National Front | R. Vaughan-Smith | 921 | 1.86 | N/A | |
| Majority | 8,735 | 17.64 | +3.72 | ||
| Turnout | 49,531 | 72.93 | -7.94 | ||
| Conservative hold | Swing | +1.9 | |||
| Party | Candidate | Votes | % | ± | |
|---|---|---|---|---|---|
| Conservative | Cranley Onslow | 25,243 | 46.33 | -10.38 | |
| Liberal | P. Wade | 17,660 | 32.41 | +17.54 | |
| Labour | J. W. Tattersall | 11,583 | 21.26 | -7.16 | |
| Majority | 7,583 | 13.92 | -14.37 | ||
| Turnout | 54,486 | 80.87 | +10.99 | ||
| Conservative hold | Swing | -14.0 | |||
| Party | Candidate | Votes | % | ± | |
|---|---|---|---|---|---|
| Conservative | Cranley Onslow | 37,220 | 56.71 | +5.31 | |
| Labour | R. M. Taylor | 18,652 | 28.42 | -2.38 | |
| Liberal | P. Wade | 9,763 | 14.87 | -2.93 | |
| Majority | 18,568 | 28.29 | +7.69 | ||
| Turnout | 65,635 | 69.88 | -7.23 | ||
| Conservative hold | Swing | +3.8 | |||
Elections in the 1960s
| Party | Candidate | Votes | % | ± | |
|---|---|---|---|---|---|
| Conservative | Cranley Onslow | 32,057 | 51.40 | -0.30 | |
| Labour | Michael Downing | 19,210 | 30.80 | +1.22 | |
| Liberal | Agnes H. Scott | 11,104 | 17.80 | -0.92 | |
| Majority | 12,847 | 20.60 | -1.52 | ||
| Turnout | 62,371 | 77.11 | -0.98 | ||
| Conservative hold | Swing | -0.8 | |||
| Party | Candidate | Votes | % | ± | |
|---|---|---|---|---|---|
| Conservative | Cranley Onslow | 31,170 | 51.70 | -15.70 | |
| Labour | H. G. N. Clother | 17,834 | 29.58 | -3.02 | |
| Liberal | Agnes H. Scott | 11,285 | 18.72 | N/A | |
| Majority | 13,336 | 22.12 | -12.69 | ||
| Turnout | 60,289 | 78.09 | +0.74 | ||
| Conservative hold | Swing | -6.3 | |||
Elections in the 1950s
| Party | Candidate | Votes | % | ± | |
|---|---|---|---|---|---|
| Conservative | Harold Watkinson | 33,521 | 67.40 | +2.99 | |
| Labour | R David Vaughan Williams | 16,210 | 32.60 | -2.99 | |
| Majority | 17,311 | 34.81 | +5.99 | ||
| Turnout | 49,731 | 77.35 | +1.63 | ||
| Conservative hold | Swing | +3.0 | |||
| Party | Candidate | Votes | % | ± | |
|---|---|---|---|---|---|
| Conservative | Harold Watkinson | 27,860 | 64.41 | -0.54 | |
| Labour | R David Vaughan Williams | 15,393 | 35.59 | +0.54 | |
| Majority | 12,467 | 28.82 | -1.08 | ||
| Turnout | 43,253 | 75.72 | -3.01 | ||
| Conservative hold | Swing | -0.5 | |||
| Party | Candidate | Votes | % | ± | |
|---|---|---|---|---|---|
| Conservative | Harold Watkinson | 26,522 | 64.95 | +6.97 | |
| Labour | W. Eric Wolff | 14,313 | 35.05 | +3.86 | |
| Majority | 12,209 | 29.90 | +3.12 | ||
| Turnout | 40,835 | 78.73 | -4.51 | ||
| Conservative hold | Swing | +1.6 | |||
| Party | Candidate | Votes | % | ± | |
|---|---|---|---|---|---|
| Conservative | Harold Watkinson | 24,454 | 57.98 | ||
| Labour | T. Davies | 13,157 | 31.19 | ||
| Liberal | Michael Fernley Turner-Bridger | 4,567 | 10.83 | ||
| Majority | 11,297 | 26.78 | |||
| Turnout | 42,178 | 83.24 | |||
| Conservative hold | Swing | ||||
See also
Notes and references
- References
- ↑ List of Conservative MPs elected in 2015 by % majority UK Political.info. Retrieved 2017-01-29
- ↑ Leigh Rayment's Historical List of MPs – Constituencies beginning with "W" (part 5)
- ↑ "Known candidates for Woking in the 2017 General Election". Democracy Club. 12 May 2017. Archived from the original on 14 May 2017. Retrieved 14 May 2017.
- ↑ "Election Data 2015". Electoral Calculus. Archived from the original on 17 October 2015. Retrieved 17 October 2015.
- ↑ "UK 2015 general election results in full". The Guardian. 8 May 2015. Retrieved 14 May 2017.
- ↑ "Election Petition Public Notice" (PDF). Woking Borough Council. Retrieved 24 July 2015.
- ↑ Pack, Mark. "Three election petitions against constituency results". Retrieved 24 July 2015.
- ↑ "Election Data 2010". Electoral Calculus. Archived from the original on 17 October 2015. Retrieved 17 October 2015.
- ↑ "Election Data 2005". Electoral Calculus. Archived from the original on 15 October 2011. Retrieved 18 October 2015.
- ↑ "Election Data 2001". Electoral Calculus. Archived from the original on 15 October 2011. Retrieved 18 October 2015.
- ↑ "Election Data 1997". Electoral Calculus. Archived from the original on 15 October 2011. Retrieved 18 October 2015.
- ↑ "Election Data 1992". Electoral Calculus. Archived from the original on 15 October 2011. Retrieved 18 October 2015.
- ↑ "Politics Resources". Election 1992. Politics Resources. 9 April 1992. Retrieved 2010-12-06.
- ↑ "Election Data 1987". Electoral Calculus. Archived from the original on 15 October 2011. Retrieved 18 October 2015.
- ↑ "Election Data 1983". Electoral Calculus. Archived from the original on 15 October 2011. Retrieved 18 October 2015.
- ↑ "1959 General Election data, marked up". tools.assembla.com/svn/grodt.
- ↑ "1955 General Election data, marked up". tools.assembla.com/svn/grodt.
- Notes
- ↑ All extant UK seats elect one Member of Parliament (MP) by the first past the post system of election, as from the outset in Woking in 1950
Sources
- "Election result, 2015". BBC News Online.
- "Election result, 2010". BBC News Online.
- "Election result, 2005". BBC News Online.
- "Election results, 1997–2001". BBC News Online.
- "Election results, 1997–2001". Election Demon.
- "Election results, 1983–1992". Election Demon.
- "Election results, 1950–1979". Politics Resources.