Aberavon (UK Parliament constituency)
Coordinates: 51°36′00″N 3°48′43″W / 51.600°N 3.812°W
| Aberavon | |
|---|---|
|
County constituency for the House of Commons | |
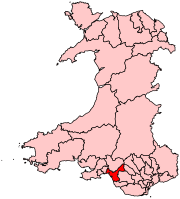 Boundary of Aberavon in Wales. | |
| Preserved county | West Glamorgan |
| Population | 66,133 (2011 census)[1] |
| Electorate | 51,233 (December 2010)[2] |
| Major settlements | Port Talbot |
| Current constituency | |
| Created | 1918 |
| Member of parliament | Stephen Kinnock (Labour) |
| Number of members | One |
| Created from | Swansea District and Mid Glamorganshire |
| Overlaps | |
| Welsh Assembly | Aberavon, South Wales West |
| European Parliament constituency | Wales |
Aberavon (Welsh: Aberafan) is a constituency represented in the House of Commons of the Parliament of the United Kingdom. It returns one Member of Parliament (MP) by the first past the post system. It is represented by Stephen Kinnock of the Labour Party.
History
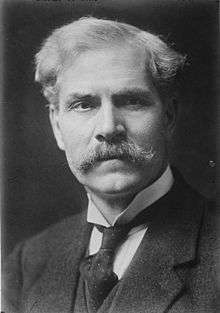
The constituency was created for the 1918 general election by a division of the Swansea District. With the exception of the first term, it has always been held by the Labour Party. Ramsay MacDonald, who became Labour's first Prime Minister in 1924, held the seat from 1922 to 1929. Its current MP, Stephen Kinnock, is the son of Neil Kinnock, who was Labour leader and Leader of the Opposition from 1983 to 1992.
It is one of the most consistently safe seats for Labour; since the end of the Second World War, the Labour candidate has always won Aberavon with a majority at least 33%, and with the exception of 2015, the Labour candidate has also always won an overall majority of the vote in the seat. In 2015, Kinnock only won 48.9% of the vote in Aberavon, against a surge in the vote for the UKIP candidate; however, in 2017, Kinnock's voteshare rose by 19.2 percentage points, the biggest increase in the Labour vote in the seat's history, and his majority increased to 50.4%, the highest for an Aberavon MP since 2001. The 2017 result also made Aberavon the safest Labour seat in Wales.
Boundaries
The constituency is in South Wales, situated on the right bank of the River Afan, near its mouth in Swansea Bay. The constituency today includes the wards of Aberavon, Baglan, Briton Ferry East, Briton Ferry West, Bryn and Cwmavon, Coedffranc Central, Coedffranc North, Coedffranc West, Cymmer, Glyncorrwg, Gwynfi, Margam, Port Talbot, Sandfields East, Sandfields West and Tai-bach
1918-1949: The Municipal Borough of Aberavon; the Urban Districts of Briton Ferry, Glencorwg, Margam, and Porthcawl; and part of the Rural Districts of Neath, and Penybont.
1950-1983: The Municipal Borough of Port Talbot; the Urban Districts of Glyncorrwg, and Porthcawl; and part of the Rural District of Penybont.[3]
Members of Parliament
| Election | Member[4] | Party | |
|---|---|---|---|
| 1918 | Jack Edwards | Liberal | |
| 1922 | Rt Hon Ramsay MacDonald | Labour | |
| 1929 | William Cove | Labour | |
| 1959 | Sir John Morris | Labour | |
| 2001 | Hywel Francis | Labour | |
| 2015 | Stephen Kinnock | Labour | |
Elections
Elections in the 2010s
| Party | Candidate | Votes | % | ± | |
|---|---|---|---|---|---|
| Labour | Stephen Kinnock | 22,662 | 68.1 | +19.2 | |
| Conservative | Sadie Vidal | 5,901 | 17.7 | +5.9 | |
| Plaid Cymru | Andrew Bennison | 2,761 | 8.3 | −3.3 | |
| UKIP | Caroline Jones | 1,345 | 4.0 | −11.7 | |
| Liberal Democrats | Cen Phillips | 599 | 1.8 | −2.6 | |
| Majority | 16,761 | 50.4 | +17.3 | ||
| Turnout | 33,268 | 66.7 | +3.4 | ||
| Registered electors | 49,892 | ||||
| Labour hold | Swing | +6.7 | |||
| Party | Candidate | Votes | % | ± | |
|---|---|---|---|---|---|
| Labour | Stephen Kinnock | 15,416 | 48.9 | −3.0 | |
| UKIP | Peter Bush | 4,971 | 15.8 | +14.2 | |
| Conservative | Edward Yi He | 3,742 | 11.9 | −2.4 | |
| Plaid Cymru | Duncan Higgitt | 3,663 | 11.6 | +4.5 | |
| Liberal Democrats | Helen Ceri-Clarke | 1,397 | 4.4 | −11.8 | |
| Independent | Captain Beany | 1,137 | 3.6 | +1.8 | |
| Green | Jonathan Tier | 711 | 2.3 | N/A | |
| Socialist Labour | Andrew Jordan | 352 | 1.1 | N/A | |
| TUSC | Owen Herbert | 134 | 0.4 | N/A | |
| Majority | 10,445 | 33.1 | −2.6 | ||
| Turnout | 31,523 | 63.3 | +2.3 | ||
| Registered electors | 49,821 | ||||
| Labour hold | Swing | −8.6 | |||
| Party | Candidate | Votes | % | ± | |
|---|---|---|---|---|---|
| Labour | Hywel Francis | 16,073 | 51.9 | −8.1 | |
| Liberal Democrats | Keith Davies | 5,034 | 16.3 | +2.5 | |
| Conservative | Caroline Jones | 4,411 | 14.2 | +4.1 | |
| Plaid Cymru | Paul Nicholls-Jones | 2,198 | 7.1 | −4.7 | |
| BNP | Kevin Edwards | 1,276 | 4.1 | N/A | |
| Independent | Andrew Tutton | 919 | 3.0 | N/A | |
| New Millennium Bean Party | Captain Beany | 558 | 1.8 | N/A | |
| UKIP | Joe Callan | 489 | 1.6 | N/A | |
| Majority | 11,039 | 35.7 | −10.6 | ||
| Turnout | 30,958 | 61.0 | +2.0 | ||
| Registered electors | 50,838 | ||||
| Labour hold | Swing | −5.3 | |||
Elections in the 2000s
| Party | Candidate | Votes | % | ± | |
|---|---|---|---|---|---|
| Labour | Hywel Francis | 18,077 | 60.0 | −3.1 | |
| Liberal Democrats | Claire Waller | 4,140 | 13.8 | +4.0 | |
| Plaid Cymru | Philip Evans | 3,545 | 11.8 | +2.1 | |
| Conservative | Annunziata Rees-Mogg | 3,064 | 10.2 | +2.6 | |
| Veritas | Jim Wright | 768 | 2.6 | N/A | |
| Green | Miranda La Vey | 510 | 1.7 | N/A | |
| Majority | 13,937 | 46.3 | −7.1 | ||
| Turnout | 30,104 | 58.9 | −1.9 | ||
| Registered electors | 50,685 | ||||
| Labour hold | Swing | -3.6 | |||
| Party | Candidate | Votes | % | ± | |
|---|---|---|---|---|---|
| Labour | Hywel Francis | 19,063 | 63.1 | −8.2 | |
| Plaid Cymru | Lisa Turnbull | 2,955 | 9.8 | +4.0 | |
| Liberal Democrats | Christopher Davies | 2,933 | 9.7 | -1.6 | |
| Conservative | Ali Miraj | 2,296 | 7.6 | −0.3 | |
| Independent | Andrew Tutton | 1,960 | 6.5 | N/A | |
| New Millennium Bean | Captain Beany | 727 | 2.4 | +1.4 | |
| Socialist Alliance | Martin Chapman | 256 | 0.8 | N/A | |
| Majority | 16,108 | 53.3 | −9.5 | ||
| Turnout | 30,190 | 61.0 | −10.9 | ||
| Registered electors | 49,524 | ||||
| Labour hold | Swing | ||||
Elections in the 1990s
| Party | Candidate | Votes | % | ± | |
|---|---|---|---|---|---|
| Labour | John Morris | 25,650 | 71.3 | +4.2 | |
| Liberal Democrat | Ronald McConville | 4,079 | 11.3 | −1.1 | |
| Conservative | Peter Harper | 2,835 | 7.9 | −5.9 | |
| Plaid Cymru | Philip Cockwell | 2,088 | 5.8 | +1.0 | |
| Referendum | Peter David | 970 | 2.7 | N/A | |
| Independent | Captain Beany | 341 | 1.0 | −0.8 | |
| Majority | 21,571 | 62.8 | +9.6 | ||
| Turnout | 35,963 | 71.9 | −5.7 | ||
| Registered electors | 50,031 | ||||
| Labour hold | Swing | +1.6 | |||
| Party | Candidate | Votes | % | ± | |
|---|---|---|---|---|---|
| Labour | John Morris | 26,877 | 67.1 | +0.3 | |
| Conservative | Hywel Williams | 5,567 | 13.9 | −0.5 | |
| Liberal Democrat | Marilyn Harris | 4,999 | 12.5 | −3.6 | |
| Plaid Cymru | David W.J. Saunders | 1,919 | 4.8 | +2.0 | |
| Real Bean | Captain Beany | 707 | 1.8 | N/A | |
| Majority | 21,310 | 53.2 | +2.5 | ||
| Turnout | 40,069 | 77.6 | −0.1 | ||
| Registered electors | 51,650 | ||||
| Labour hold | Swing | +0.4 | |||
Elections in the 1980s
| Party | Candidate | Votes | % | ± | |
|---|---|---|---|---|---|
| Labour | John Morris | 27,126 | 66.8 | +8.0 | |
| Liberal | Marilyn Harris | 6,517 | 16.0 | −4.3 | |
| Conservative | Paul Warwick | 5,861 | 14.4 | −1.9 | |
| Plaid Cymru | Anne Howells | 1,124 | 2.8 | −1.8 | |
| Majority | 20,609 | 50.7 | +12.3 | ||
| Turnout | 40,628 | 77.7 | +2.1 | ||
| Registered electors | 52,280 | ||||
| Labour hold | Swing | ||||
| Party | Candidate | Votes | % | ± | |
|---|---|---|---|---|---|
| Labour | John Morris | 23,745 | 58.75 | −2.9 | |
| Liberal | Sheila M. Cutts | 8,206 | 20.30 | +11.3 | |
| Conservative | G.N.A. Bailey | 6,605 | 16.3 | −8.4 | |
| Plaid Cymru | A.G. Phillips | 1,859 | 4.6 | +0.8 | |
| Majority | 15,539 | 38.45 | +1.5 | ||
| Turnout | 40,415 | 75.62 | −3.5 | ||
| Registered electors | 53,443 | ||||
| Labour hold | Swing | ||||
Elections in the 1970s
| Party | Candidate | Votes | % | ± | |
|---|---|---|---|---|---|
| Labour | John Morris | 31,665 | 61.7 | −1.1 | |
| Conservative | F. McCarthy | 12,692 | 24.7 | +7.9 | |
| Liberal | Sheila M. Cutts | 4,624 | 9.0 | −2.0 | |
| Plaid Cymru | Geraint Thomas | 1,954 | 3.8 | −4.7 | |
| Communist | G. Rowden | 406 | 0.8 | N/A | |
| Majority | 18,973 | 37.0 | −9.1 | ||
| Turnout | 47,179 | 79.2 | +6.1 | ||
| Registered electors | 64,864 | ||||
| Labour hold | Swing | ||||
| Party | Candidate | Votes | % | ± | |
|---|---|---|---|---|---|
| Labour | John Morris | 29,683 | 62.82 | -2.4 | |
| Conservative | N K Hammond | 7,931 | 16.78 | -5.8 | |
| Liberal | Sheila M. Cutts | 5,178 | 10.96 | N/A | |
| Plaid Cymru | Geraint Thomas | 4,032 | 8.53 | -3.6 | |
| Workers Revolutionary | J. Bevan | 427 | 0.9 | N/A | |
| Majority | 21,752 | 46.04 | +3.4 | ||
| Turnout | 47,251 | 73.07 | -2.6 | ||
| Registered electors | 64,667 | ||||
| Labour hold | Swing | ||||
| Party | Candidate | Votes | % | ± | |
|---|---|---|---|---|---|
| Labour | John Morris | 31,656 | 65.24 | -1.8 | |
| Conservative | Peter Hubbard-Miles | 10,968 | 22.60 | +0.3 | |
| Plaid Cymru | DG Foster | 5,898 | 12.2 | +3.8 | |
| Majority | 20,688 | 42.64 | -2.1 | ||
| Turnout | 48,522 | 75.62 | +0.84 | ||
| Registered electors | 64,162 | ||||
| Labour hold | Swing | ||||
| Party | Candidate | Votes | % | ± | |
|---|---|---|---|---|---|
| Labour | John Morris | 31,314 | 66.99 | −8.45 | |
| Conservative | Ian Grist | 10,419 | 22.29 | +1.35 | |
| Plaid Cymru | Graham Farmer | 3,912 | 8.37 | N/A | |
| Communist | Julian Tudor Hart | 1,102 | 2.36 | −1.26 | |
| Majority | 20,895 | 44.70 | −9.81 | ||
| Turnout | 46,747 | 74.78 | −3.49 | ||
| Registered electors | 62,516 | ||||
| Labour hold | Swing | ||||
Elections in the 1960s
| Party | Candidate | Votes | % | ± | |
|---|---|---|---|---|---|
| Labour | John Morris | 33,763 | 75.44 | +3.33 | |
| Conservative | Robert Hicks | 9,369 | 20.94 | +0.41 | |
| Communist | Julian Tudor Hart | 1,620 | 3.62 | +0.88 | |
| Majority | 24,394 | 54.51 | +2.93 | ||
| Turnout | 45,146 | 78.27 | −2.58 | ||
| Registered electors | 57,179 | ||||
| Labour hold | Swing | ||||
| Party | Candidate | Votes | % | ± | |
|---|---|---|---|---|---|
| Labour | John Morris | 33,103 | 72.11 | +6.35 | |
| Conservative | John Stradling Thomas | 9,424 | 20.53 | −7.07 | |
| Plaid Cymru | Glyn John | 2,118 | 4.61 | −2.02 | |
| Communist | Julian Tudor Hart | 1,260 | 2.74 | N/A | |
| Majority | 23,679 | 51.58 | +13.42 | ||
| Turnout | 45,905 | 80.85 | −1.23 | ||
| Registered electors | 56,777 | ||||
| Labour hold | Swing | ||||
Elections in the 1950s
| Party | Candidate | Votes | % | ± | |
|---|---|---|---|---|---|
| Labour | John Morris | 30,397 | 65.76 | −3.78 | |
| Conservative | Geoffrey Howe | 12,759 | 27.60 | −2.86 | |
| Plaid Cymru | Iixtyd M Lewis | 3,066 | 6.63 | N/A | |
| Majority | 17,638 | 38.16 | −0.91 | ||
| Turnout | 46,222 | 82.08 | +2.81 | ||
| Registered electors | 56,316 | ||||
| Labour hold | Swing | ||||
| Party | Candidate | Votes | % | ± | |
|---|---|---|---|---|---|
| Labour | William Cove | 29,003 | 69.54 | −2.43 | |
| Conservative | Geoffrey Howe | 12,706 | 30.46 | +2.43 | |
| Majority | 16,297 | 39.07 | −4.87 | ||
| Turnout | 41,709 | 79.27 | −5.36 | ||
| Registered electors | 52,616 | ||||
| Labour hold | Swing | −2.43 | |||
| Party | Candidate | Votes | % | ± | |
|---|---|---|---|---|---|
| Labour | William Cove | 30,498 | 71.97 | +3.29 | |
| Conservative | John Loveridge | 11,878 | 28.03 | +9.05 | |
| Majority | 18,620 | 43.94 | −5.76 | ||
| Turnout | 42,376 | 84.63 | −1.21 | ||
| Registered electors | 50,071 | ||||
| Labour hold | Swing | ||||
| Party | Candidate | Votes | % | ± | |
|---|---|---|---|---|---|
| Labour | William Cove | 29,278 | 68.68 | −3.83 | |
| National Liberal and Conservative | Auberon Herbert | 8,091 | 18.98 | −8.51 | |
| Liberal | Maldwyn Thomas | 5,263 | 12.35 | N/A | |
| Majority | 21,187 | 49.70 | +4.68 | ||
| Turnout | 42,634 | 85.84 | +6.42 | ||
| Registered electors | 49,667 | ||||
| Labour hold | Swing | ||||
Elections in the 1940s
| Party | Candidate | Votes | % | ± | |
|---|---|---|---|---|---|
| Labour | William Cove | 31,286 | 72.51 | N/A | |
| Conservative | David Llewellyn | 11,860 | 27.49 | N/A | |
| Majority | 19,426 | 45.02 | N/A | ||
| Turnout | 43,146 | 79.42 | N/A | ||
| Registered electors | 54,323 | ||||
| Labour hold | Swing | N/A | |||
Elections in the 1930s
| Party | Candidate | Votes | % | ± | |
|---|---|---|---|---|---|
| Labour | William Cove | Unopposed | |||
| Registered electors | 49,729 | ||||
| Labour hold | |||||
| Party | Candidate | Votes | % | ± | |
|---|---|---|---|---|---|
| Labour | William Cove | 23,029 | 58.4 | +2.5 | |
| Liberal | Edward Curran | 16,378 | 41.6 | +8.4 | |
| Majority | 6,651 | 16.9 | -5.8 | ||
| Turnout | 39,407 | 84.4 | -2.6 | ||
| Registered electors | 46,689 | ||||
| Labour hold | Swing | -3.0 | |||
Elections in the 1920s
| Party | Candidate | Votes | % | ± | |
|---|---|---|---|---|---|
| Labour | William Cove | 22,194 | 55.9 | +2.8 | |
| Liberal | William Henry Williams | 13,155 | 33.2 | -13.7 | |
| Unionist | Francis Bertram Reece | 4,330 | 10.9 | N/A | |
| Majority | 9,039 | 22.7 | +16.5 | ||
| Turnout | 39,679 | 87.0 | -2.6 | ||
| Registered electors | 45,613 | ||||
| Labour hold | Swing | +8.2 | |||

| Party | Candidate | Votes | % | ± | |
|---|---|---|---|---|---|
| Labour | Ramsay MacDonald | 17,724 | 53.1 | -2.5 | |
| Liberal | William Henry Williams | 15,624 | 46.9 | N/A | |
| Majority | 2,100 | 6.2 | -5.0 | ||
| Turnout | 33,348 | 89.6 | +2.4 | ||
| Registered electors | 37,200 | ||||
| Labour hold | Swing | ||||
| Party | Candidate | Votes | % | ± | |
|---|---|---|---|---|---|
| Labour | Ramsay MacDonald | 17,439 | 55.6 | +9.0 | |
| Unionist | Sidney Hutchinson Byass | 13,927 | 44.4 | +8.3 | |
| Majority | 3,512 | 11.2 | +0.7 | ||
| Turnout | 31,366 | 87.2 | +1.4 | ||
| Registered electors | 39,750 | ||||
| Labour hold | Swing | +0.3 | |||
| Party | Candidate | Votes | % | ± | |
|---|---|---|---|---|---|
| Labour | Ramsay MacDonald | 14,318 | 46.6 | +10.9 | |
| Unionist | Sidney Hutchinson Byass | 11,111 | 36.1 | N/A | |
| National Liberal | John Edwards | 5,238 | 17.3 | -45.5 | |
| Majority | 3,207 | 10.5 | -16.5 | ||
| Turnout | 30,667 | 88.6 | +17.2 | ||
| Registered electors | 34,716 | ||||
| Labour gain from Liberal | Swing | +28.2 | |||
Elections in the 1910s
| Party | Candidate | Votes | % | ± | |
|---|---|---|---|---|---|
| C | Liberal | Jack Edwards | 13,635 | 62.8 | N/A |
| Labour | Robert Williams | 7,758 | 35.7 | N/A | |
| NFDDSS | T.G. Jones | 324 | 1.5 | N/A | |
| Majority | 5,877 | 27.1 | N/A | ||
| Turnout | 21,697 | 71.4 | N/A | ||
| Registered electors | 30,415 | ||||
| Liberal win (new seat) | |||||
| C indicates candidate endorsed by the coalition government. | |||||
- Jones withdrew in favour of Edwards on 13 Dec 1918
See also
Notes and references
- ↑ "Usual Resident Population, 2011". Neighbourhood Statistics. Office for National Statistics. Retrieved 25 January 2015.
- ↑ "Beyond 20/20 WDS - Table view". 2011 Electorate Figures. StatsWales. 1 December 2010. Retrieved 13 March 2011.
- ↑ Craig, F.W.S., ed. (1972). Boundaries of parliamentary constituencies 1985-1972. Chichester, Sussex: Political Reference Publications. ISBN 0-900178-09-4.
- ↑ Leigh Rayment's Historical List of MPs – Constituencies beginning with "A" (part 1)
- ↑ Notices Neath Port Talbot Council
- ↑ "Aberavon Parliamentary constituency". Election 2017 Results. BBC. Retrieved 8 June 2017.
- ↑ "Election Data 2015". Electoral Calculus. Archived from the original on 17 October 2015. Retrieved 17 October 2015.
- ↑ "Aberavon and Neath Results" (PDF). UK Parliamentary Elections May 2015 results. Neath Port Talbot County Borough Council. Archived from the original (PDF) on 2015-10-05. Retrieved 16 September 2015.
- ↑ "Aberavon Parliamentary constituency". Election 2015 Results. BBC. Retrieved 8 May 2015.
- ↑ "Election Data 2010". Electoral Calculus. Archived from the original on 26 July 2013. Retrieved 17 October 2015.
- ↑ "BBC News | Election 2010 | Constituency | Aberavon". news.bbc.co.uk. Retrieved 4 November 2015.
- ↑ "Election Data 2005". Electoral Calculus. Archived from the original on 15 October 2011. Retrieved 18 October 2015.
- ↑ "Election Data 2001". Electoral Calculus. Archived from the original on 15 October 2011. Retrieved 18 October 2015.
- ↑ "Election Data 1997". Electoral Calculus. Archived from the original on 15 October 2011. Retrieved 18 October 2015.
- ↑ "Politics Resources". Election 1997. Politics Resources. 1 May 1997. Retrieved 25 December 2010.
- ↑ C. Rallings & M. Thrasher, The Media Guide to the New Parliamentary Constituencies, p.120 (Plymouth: LGC Elections Centre, 1995)
- ↑ "Election Data 1992". Electoral Calculus. Archived from the original on 15 October 2011. Retrieved 18 October 2015.
- ↑ "Politics Resources". Election 1992. Politics Resources. 9 April 1992. Retrieved 6 December 2010.
- ↑ "Election Data 1987". Electoral Calculus. Archived from the original on 15 October 2011. Retrieved 18 October 2015.
- ↑ "Election Data 1983". Electoral Calculus. Archived from the original on 15 October 2011. Retrieved 18 October 2015.
- ↑ The Times' Guide to the House of Commons. 1950.
- 1 2 3 4 5 6 7 British parliamentary election results, 1918–1949, Fred W. S. Craig
External links
- Politics Resources (Election results from 1922 onwards)
- Electoral Calculus (Election results from 1955 onwards)
- 2017 Election House Of Commons Library 2017 Election report
- A Vision Of Britain Through Time (Constituency elector numbers)
Further reading
- Richard Kimber (2008). "UK General Elections since 1832 UK General Elections since 1832". psr.keele.ac.uk. Archived from the original on 9 June 2008. Retrieved 23 June 2008.
| Parliament of the United Kingdom | ||
|---|---|---|
| Preceded by Bewdley |
Constituency represented by the Prime Minister 22 January – 4 November 1924 |
Succeeded by Bewdley |